
Market
Yi He Discusses Binance’s Token Listing Criteria After CZ’s Remark


In a recent interview, Binance co-founder Yi He addressed concerns about the exchange’s token listing process. The exchange has used similar KPI guidelines for several years, but the market is changing at a breakneck pace.
Although Binance has increased the staff that oversees token listings, it still suffers from slow response times. According to Yi, the firm needs to focus on assets that create value while absolutely rejecting corruption or shaky projects.
Yi He Talks Binance Listings
Yi He, co-founder of Binance, is one of the most influential women in the crypto industry. She currently serves as the exchange’s Chief Marketing Officer and is a powerful force within the company. Yi recently sat for a lengthy Chinese-language interview, during which she directly addressed a few concerns with Binance’s token listing criteria.
“A pressing concern may be that listing on Binance no longer delivers the same wealth effects it once did. Internally, we’ve had many discussions on this topic. For many projects, listing on Binance has become their ultimate goal, akin to going public on Nasdaq. But how can we address this issue and restore the wealth effect for users?” asked He.
Binance is one of the world’s largest crypto exchanges, and Yi acknowledged that its listings have always been important. Although Coinbase listings have recently failed to cause large gains, tokens continually spike when Binance lists them.
This follows criticism from the exchange’s former CEO, Changpeng Zhao, who labeled Binance’s listing policy as “a bit broken.” The exchange listed the TST meme coin even though CZ repeatedly clarified that it’s not a real token.
Most recently, Binance has faced significant criticism for listing low-market-cap meme coins, which often leads to pump-and-dump schemes.
Yi He said that listings are determined by ROI, market performance on other exchanges, and the ability to attract new users. However, the firm’s research indicates that investor demographics are changing, bringing new responsibilities.
In other words, even though Binance’s listing team has grown, Yi He said it nonetheless struggles with slower response times. She claimed that this market is very difficult to navigate, but market incentives are always clear and present.
Moving forward, Binance will need to prioritize tokens that create value, not shaky gains, to maintain its relevance.
If we don’t face problems head-on and work on improvements, burying our heads in the sand will only erode confidence in the entire industry. In this cycle, we’ve seen early, passionate entrepreneurs grow disillusioned, even going so far as to declare, ‘Blockchain is dead.’ Some argue that over the past 10 years, blockchain has failed to generate real value,” Yi said.
Yi also discussed a few other aspects of Binance’s business beyond its listing criteria. For one, she repeatedly emphasized Binance Labs’ independence, apparently ignoring its recent rebrand.
She also said that the firm is working hard to repair relationships with US regulators. All in all, Yi He painted a realistic yet optimistic view of the company’s future trajectory.
Disclaimer
In adherence to the Trust Project guidelines, BeInCrypto is committed to unbiased, transparent reporting. This news article aims to provide accurate, timely information. However, readers are advised to verify facts independently and consult with a professional before making any decisions based on this content. Please note that our Terms and Conditions, Privacy Policy, and Disclaimers have been updated.


Cardano is showing renewed strength as bullish momentum builds, driving ADA closer to the $0.8119 resistance level. After steady accumulation, buyers are beginning to take control, pushing the price higher and reinforcing optimism in the market. This growing confidence suggests that ADA could be on the verge of a significant breakout, provided it can overcome key resistance zones.
With technical indicators turning positive and market sentiment improving, all eyes are on whether ADA can sustain its upward momentum. A decisive move past $0.8119 may pave the way for further gains, while failure to break through might invite renewed selling pressure. As the battle between bulls and bears intensifies, the coming sessions will be crucial in determining Cardano’s next move.
Technical Analysis: Can ADA Sustain Its Upside Trajectory?
Presently, Cardano is exhibiting strong bullish momentum as it steadily climbs toward the $0.8119 resistance level, a barrier crucial for its next major move. After facing a strong rebound at the $0.6822 support mark, buying pressure has increased, pushing ADA higher as market sentiment turns optimistic. but the sustainability of this uptrend depends on key technical factors.
Related Reading
It is worth noting that ADA’s price steadily rises toward the 100-day Simple Moving Average (SMA), a critical level that often acts as a dynamic resistance. A successful break above this indicator could reinforce positive sentiment and pave the way for extended gains.
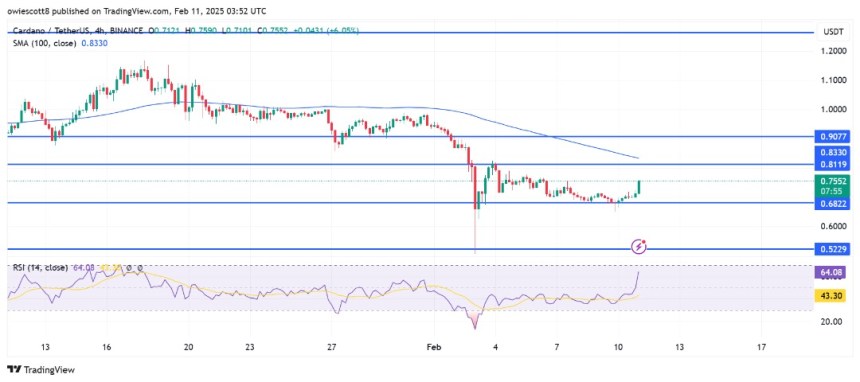
Supporting this momentum, the Relative Strength Index (RSI) has recently crossed above the 50% threshold, indicating a shift from bearish to bullish market conditions. This is a significant development, as an RSI above 50% typically suggests that buying pressure outweighs selling pressure, triggering further upside potential.
Additionally, ADA’s trading volume has surged by over 10% in the last 24 hours, indicating growing market activity and increased investor interest. This uptick in volume suggests that traders are becoming more engaged, possibly fueling price movements.
As long as the RSI remains on an upward trajectory and buying pressure continues to rise alongside volume, it might strengthen ADA’s bullish outlook, increasing the likelihood of a breakout above key resistance levels.
What’s Next For Cardano? Predictions Beyond $0.8119
As Cardano continues its upward trajectory, breaking through the $0.8119 resistance level has become a focal point. But what lies beyond this key milestone?
Related Reading
If buyers maintain control and push the price above this key barrier, ADA is likely to see an extended rally toward $0.8306 and $0.9077 in the near term. A decisive move above these levels can strengthen upward performances, opening the door for a test of $1.2630, a psychological milestone.
However, if Cardano struggles to surpass $0.8119, it may enter a consolidation phase or experience a pullback, with $0.6822 as the next closest support level. The bulls must hold this zone to prevent further bearish pressure. Furthermore, a break below this level could signal an extended correction, exposing ADA to deeper losses.
Featured image from Medium, chart from Tradingview.com

Solana-based meme coin Fartcoin has been the market’s top performer over the past 24 hours, surging by 30% and outperforming major cryptocurrencies. The rally comes as the broader market posts a modest 2% rebound following the recent decline.
The meme coin has broken above a descending trendline that previously kept its price in a downtrend. This breakout signals a potential shift in momentum.
Fartcoin Breaks Above Bearish Trend Line
FARTCOIN’s double-digit price surge has pushed it above a descending trendline that previously kept its price in a downtrend. This bearish pattern emerged as traders began to take profit after the token climbed to an all-time high of $2.74 on January 19.
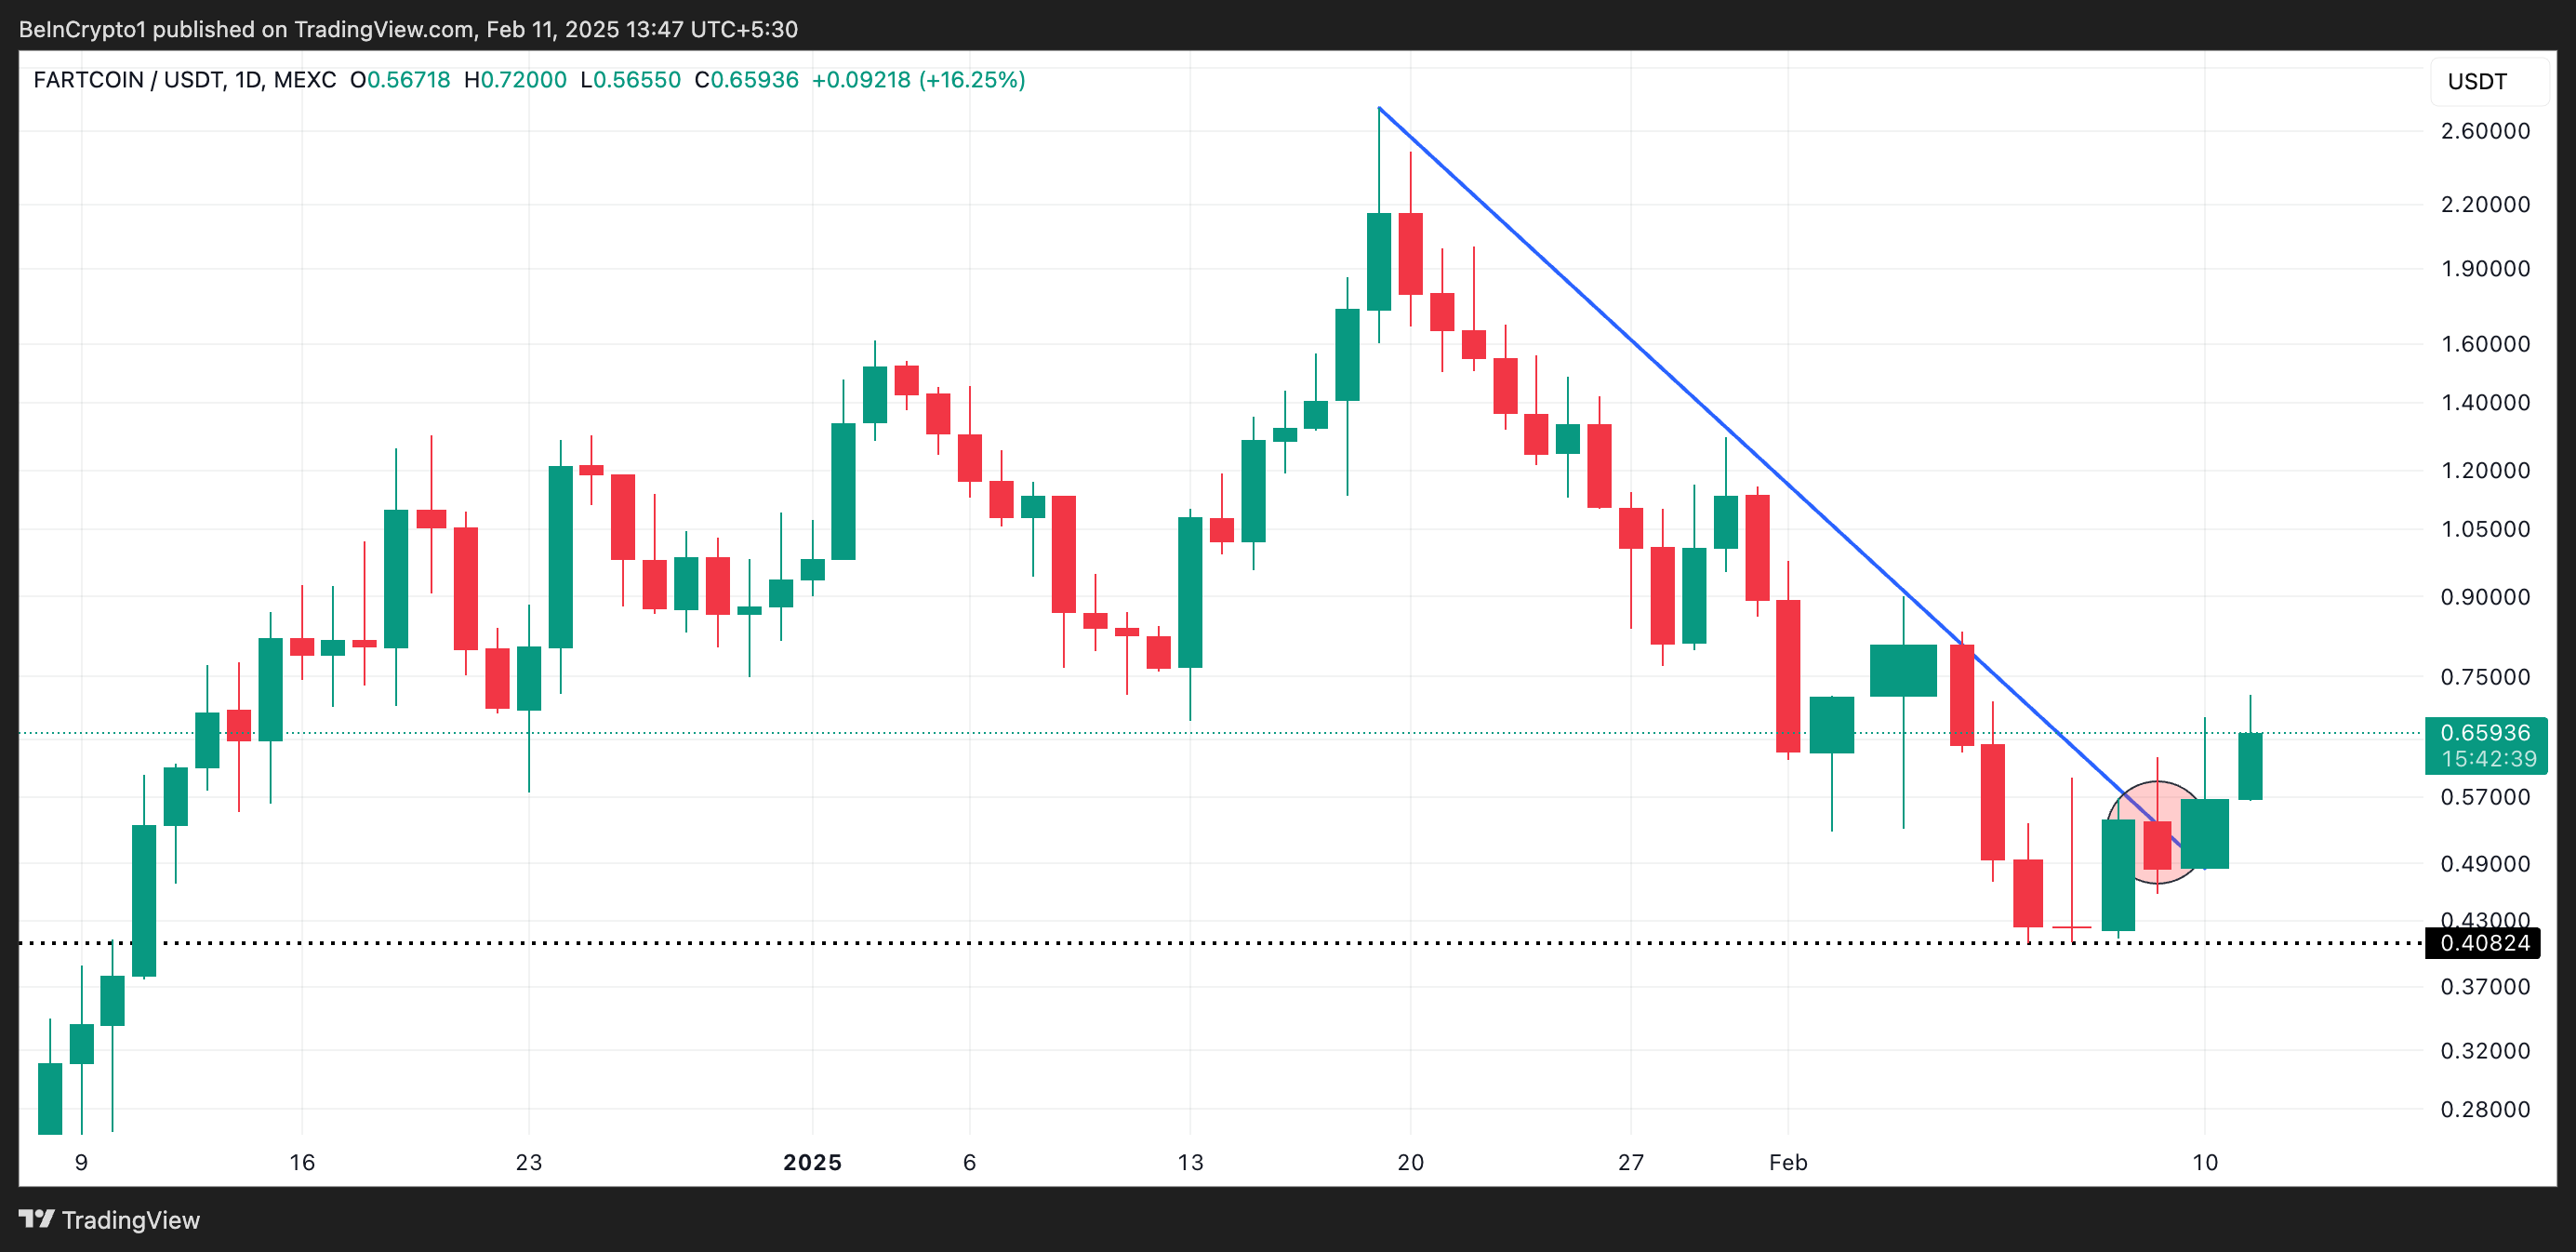
However, the resurgence in FARTCOIN’s demand and the resulting break above this trend line marks a bullish shift in the market trend.
When an asset breaks above a descending trendline, it signals a potential trend reversal from bearish to bullish. This indicates that the selling pressure is weakening, and buyers are gaining control. This breakout suggests that FARTCOIN may continue upward if demand remains strong.
FARTCOIN’s surging open interest also suggests increasing trader confidence, reinforcing the bullish outlook. At press time, it is at $221 million, noting a 28% spike over the past 24 hours.
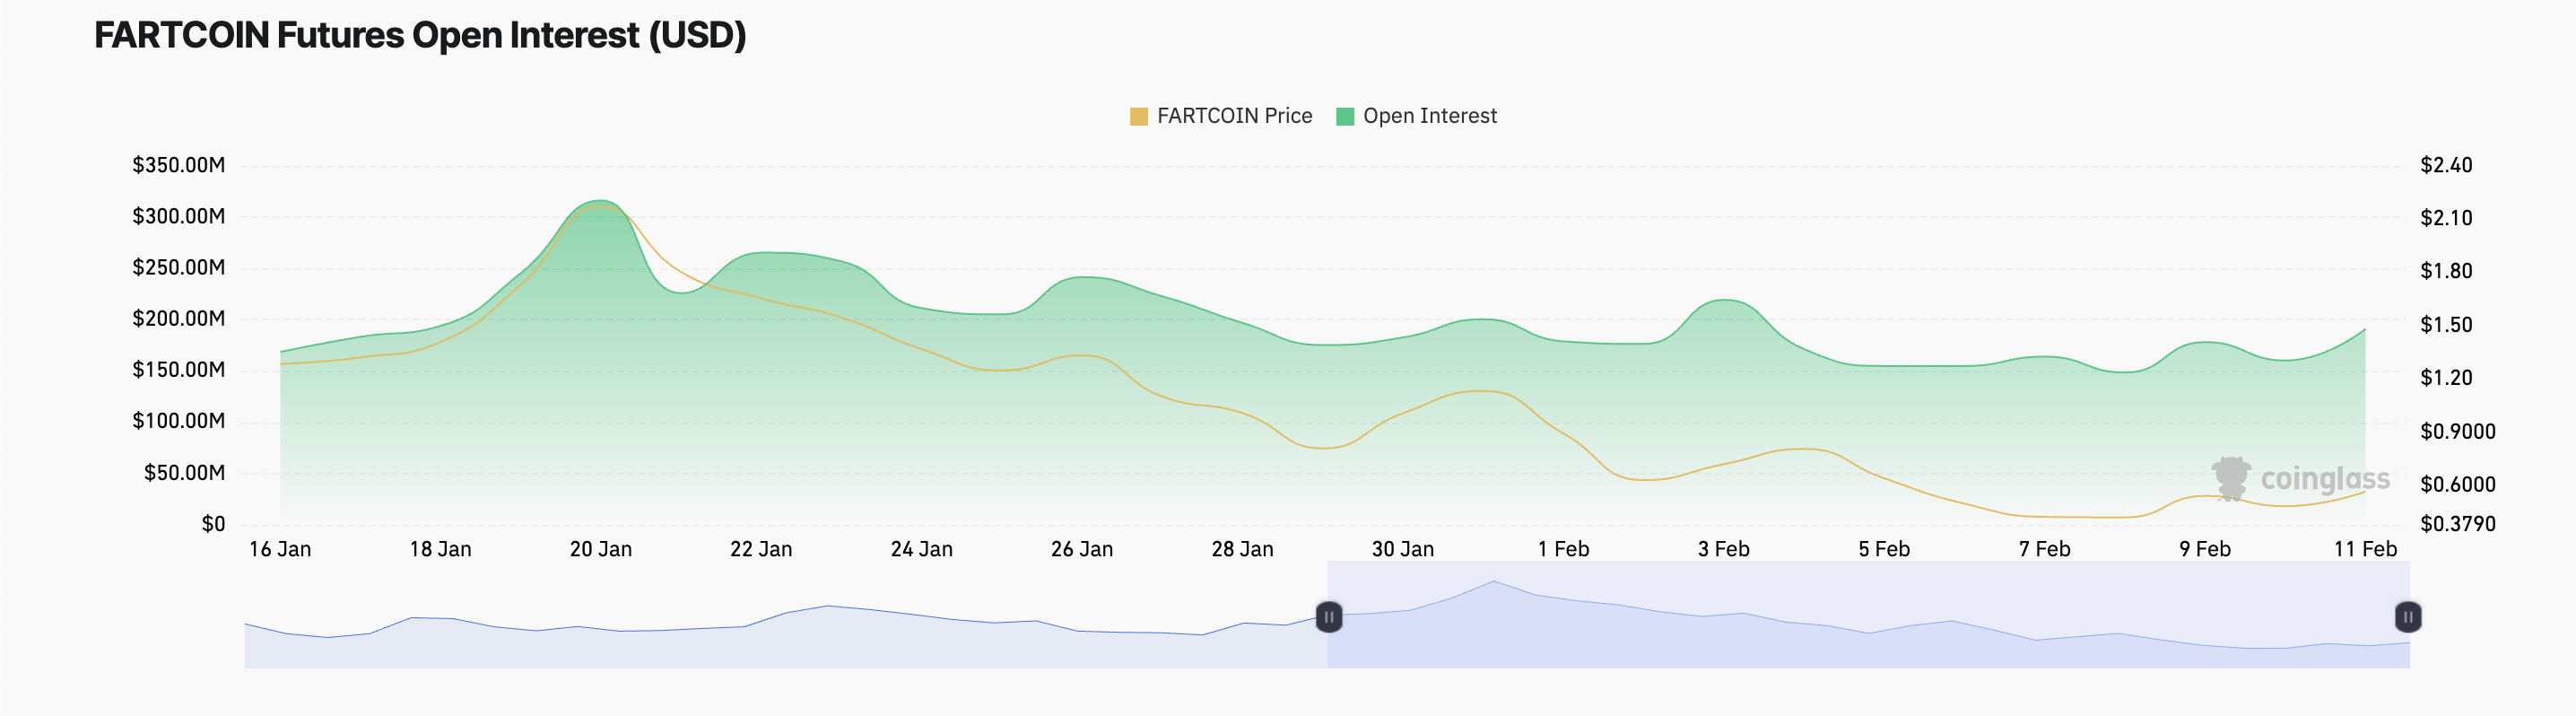
Open interest measures the total number of active futures or options contracts that have not been closed or settled. Spikes in open interest during a price rally like this indicate strong market participation, with new capital entering trades. It suggests a sustained momentum and hints at the potential for further price gains.
FARTCOIN Price Prediction: Will It Hit $1.05 or Fall Back to $0.40?
A sustained rally above the breakout line could propel FARTCOIN to new heights. However, the buying momentum must also be sustained for this to happen.
The meme coin could rally back above the $1 price zone to trade at $1.05 in this scenario.
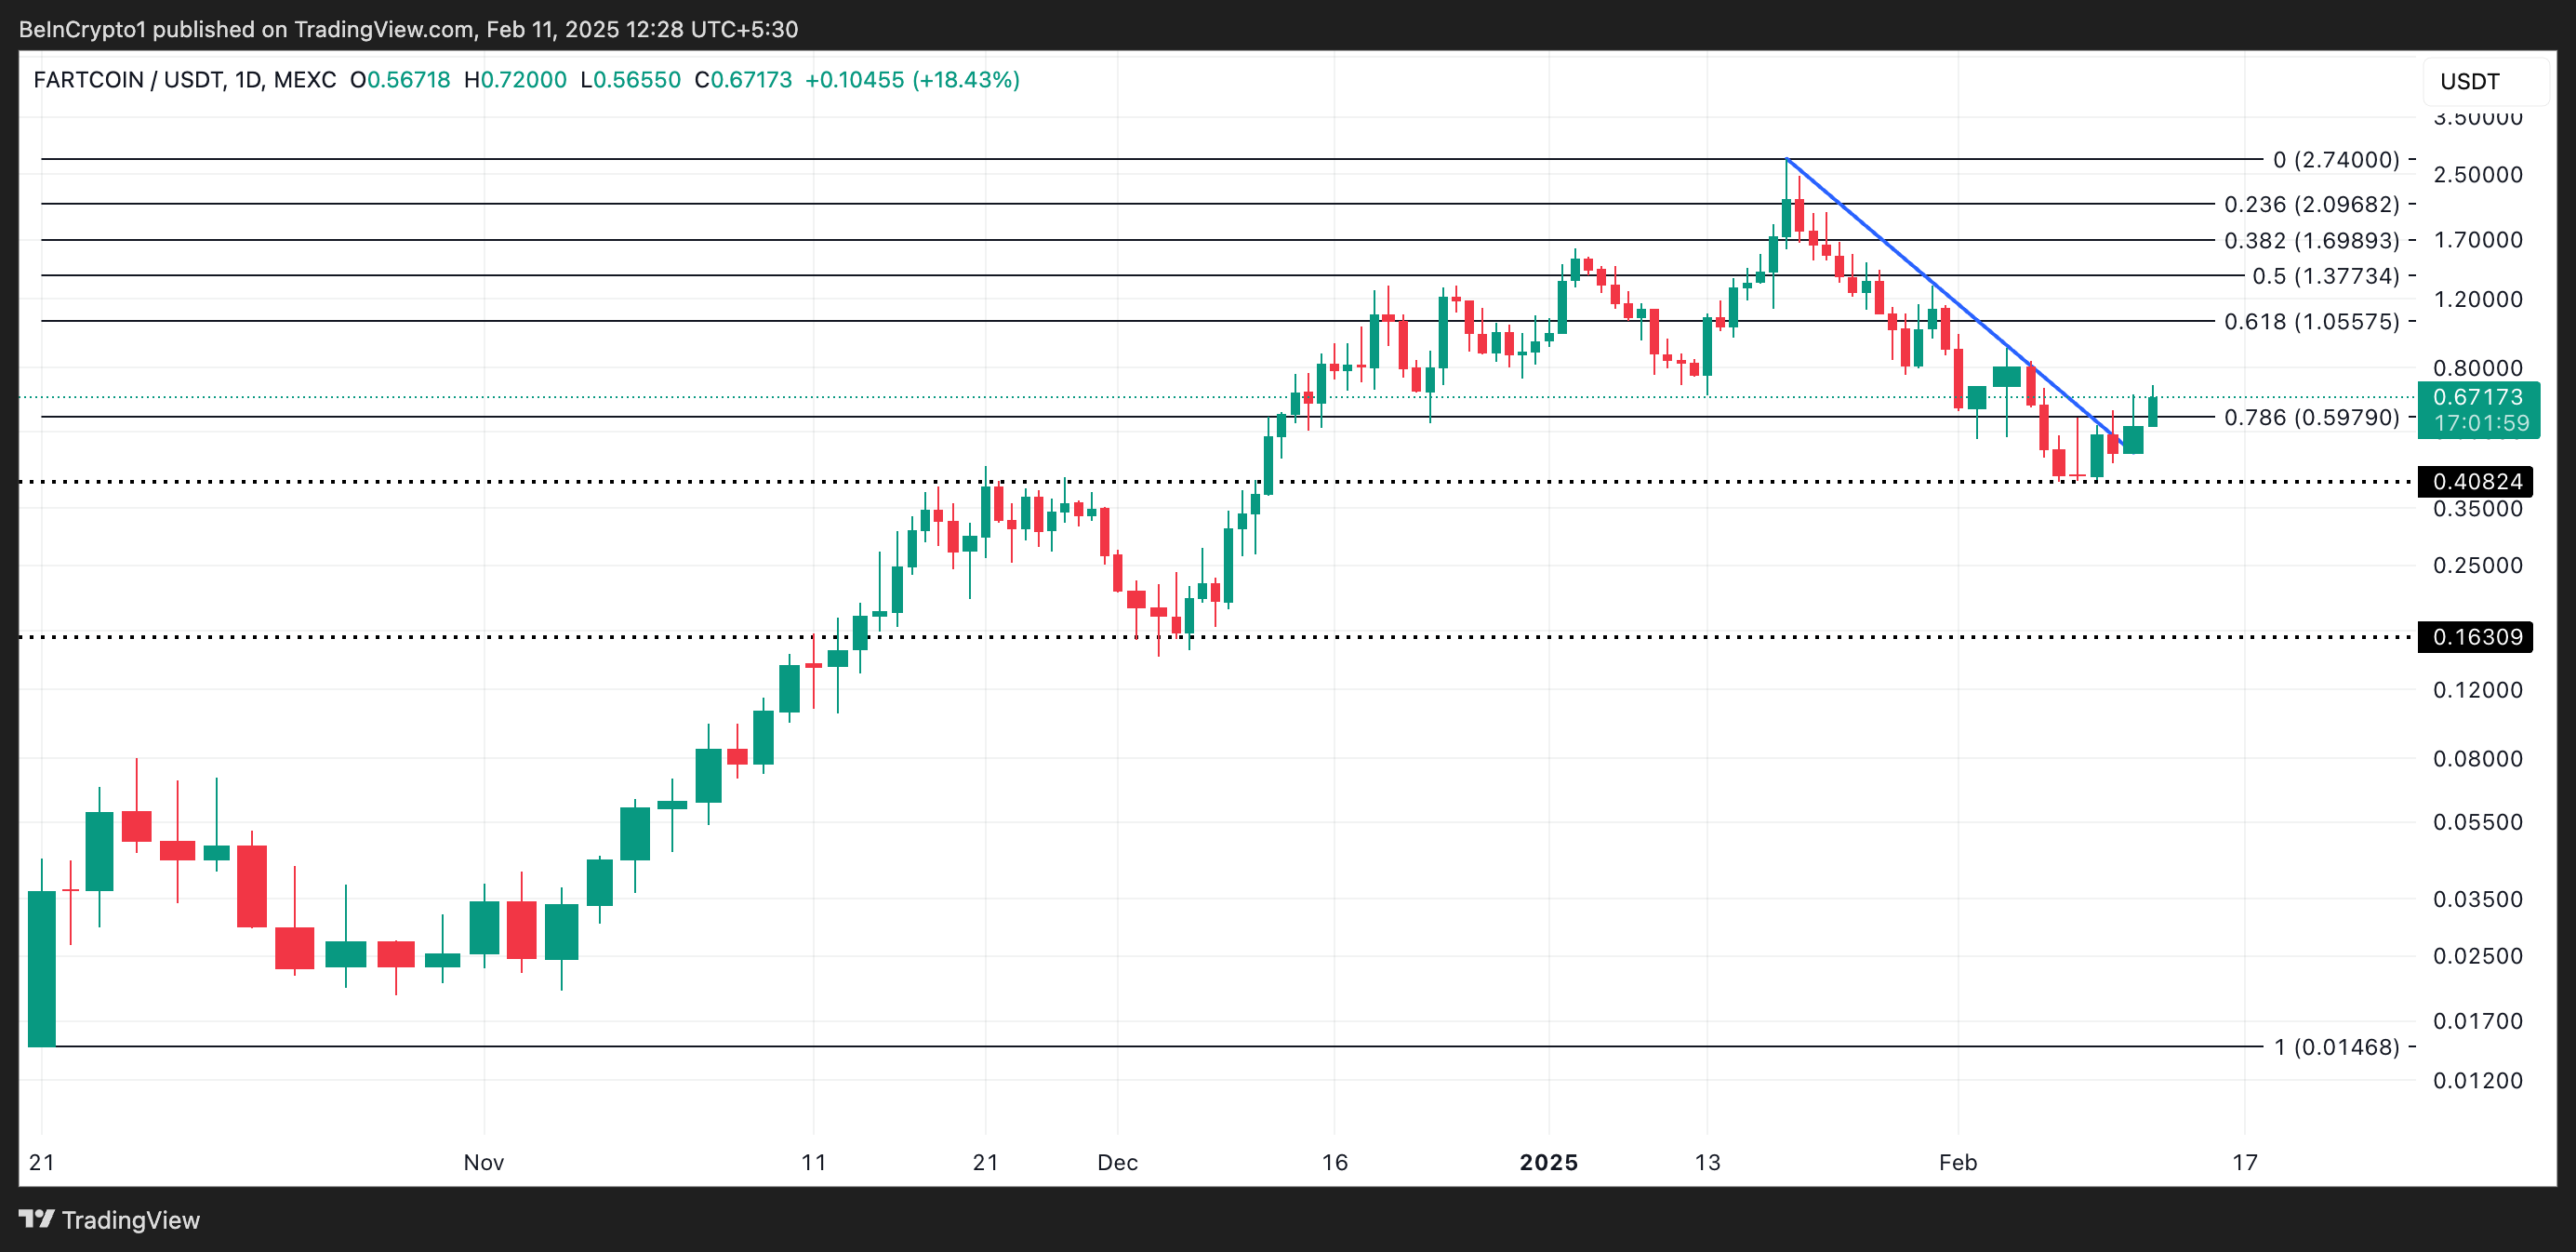
However, if profit-taking commences, this bullish outlook will be invalidated. The token’s price could fall below the descending trend line to trade at $0.40 in this case
Disclaimer
In line with the Trust Project guidelines, this price analysis article is for informational purposes only and should not be considered financial or investment advice. BeInCrypto is committed to accurate, unbiased reporting, but market conditions are subject to change without notice. Always conduct your own research and consult with a professional before making any financial decisions. Please note that our Terms and Conditions, Privacy Policy, and Disclaimers have been updated.
Bitcoin price is consolidating above the $96,200 support zone. BTC is showing a few positive signs and might attempt to rally above $99,000.
- Bitcoin started a decent recovery wave above the $95,000 level.
- The price is trading above $96,000 and the 100 hourly Simple moving average.
- There is a connecting bearish trend line forming with resistance at $98,000 on the hourly chart of the BTC/USD pair (data feed from Kraken).
- The pair could start another increase if it clears the $98,000 zone.
Bitcoin Price Eyes Fresh Increase
Bitcoin price failed to continue higher above the $100,500 zone. It started another decline below the $97,500 zone. BTC gained bearish momentum for a move below the $96,000 and $95,000 levels.
There was also a spike below the 61.8% Fib retracement level of the upward wave from the $91,000 swing low to the $102,500 high. The price tested the $95,000 zone and recently recovered some losses. There was a move above the $96,000 level.
Bitcoin price is now trading above $97,000 and the 100 hourly Simple moving average. On the upside, immediate resistance is near the $98,000 level. There is also a connecting bearish trend line forming with resistance at $98,000 on the hourly chart of the BTC/USD pair.

The first key resistance is near the $99,000 level. The next key resistance could be $100,000. A close above the $100,000 resistance might send the price further higher. In the stated case, the price could rise and test the $101,200 resistance level. Any more gains might send the price toward the $102,500 level.
Another Decline In BTC?
If Bitcoin fails to rise above the $98,000 resistance zone, it could start a fresh decline. Immediate support on the downside is near the $96,500 level. The first major support is near the $95,500 level.
The next support is now near the $93,700 zone or the 76.4% Fib retracement level of the upward wave from the $91,000 swing low to the $102,500 high. Any more losses might send the price toward the $92,000 support in the near term. The main support sits at $91,000.
Technical indicators:
Hourly MACD – The MACD is now gaining pace in the bullish zone.
Hourly RSI (Relative Strength Index) – The RSI for BTC/USD is now above the 50 level.
Major Support Levels – $96,500, followed by $95,500.
Major Resistance Levels – $98,000 and $100,000.

ADA Aims For $0.8119 As Confidence Grows

Ethereum’s Price Recovery Of The $4,000 Mark Hinges On This Crucial Support Level

Breakout Signals Potential for $1.05

North Carolina Introduces Bill to Invest in Bitcoin and Digital Assets

Will It Smash Resistance and Climb?
Crypto ETF Filings Fuel Rally In ADA, LTC, & Others, Altcoin Season Imminent?

2.52 Million Altcoins Are Ruining Crypto’s Future

Animoca Brands Valuation Tanks 75% In Two Years, Here’s Why

Crypto exchange BingX hacked for $43 million

Are The Big Players Losing Interest?

Hong Kong’s Securities Association Tips Authorities On Crypto Self-Regulation

Coinbase cbBTC Set to go Live on Solana
2.52 Million Altcoins Are Ruining Crypto’s Future
Animoca Brands Valuation Tanks 75% In Two Years, Here’s Why
Crypto exchange BingX hacked for $43 million
Are The Big Players Losing Interest?
Hong Kong’s Securities Association Tips Authorities On Crypto Self-Regulation
Coinbase cbBTC Set to go Live on Solana
-

 Altcoin22 hours ago
Trump’s Tariffs, AI Meme Coins, P2E Games
-

 Altcoin14 hours ago
Bitcoin Treasury Firm Metaplanet Is Japan’s Hottest Stock, Up 3,600%
-
 Market23 hours ago
Weekly Price Analysis: Crypto Prices Reel from Risk Off Sentiments
-

 Market20 hours ago
Shiba Inu (SHIB) Demand Plummets as Meme Coin Hype Fades
-

 Ethereum24 hours ago
Analyst Says Prepare For Ethereum Price To Hit $17,000, Here’s Why
-
 Market19 hours ago
Strategy Resumes Bitcoin Buys After Rebrand and Purchase Pause
-

 Bitcoin24 hours ago
Japan’s FSA Plans Crypto Tax Reform & Bitcoin ETF Greenlight
-
 Altcoin23 hours ago
Berachain Price Drops 14%, Arthur Hayes Breaks Down the Crash