
Ethereum
Ethereum Holds Multi-Year Bullish Pattern – Expert Suggests The Next Move Will Be ‘The Real Deal’

Ethereum has been struggling below the $2,800 mark for days, with sentiment around the second-largest cryptocurrency in the world becoming increasingly negative. Persistent selling pressure has left investors and analysts worried about Ethereum’s ability to stage a recovery, with many starting to lose hope for a rally.
The bearish sentiment has only intensified as ETH continues to underperform compared to Bitcoin and other major assets, causing frustration among market participants who expected a stronger start to the year.
Related Reading
Despite this negative outlook, there are reasons for optimism. Top analyst Jelle shared a technical analysis revealing that Ethereum is still trading within a multi-year ascending triangle, a bullish chart pattern that could signal a significant move higher. This pattern suggests Ethereum may just be consolidating before a potential breakout into higher prices. Historical patterns have shown that ascending triangles often lead to explosive price moves when key resistance levels are breached.
As ETH trades near critical support levels, the coming days will be crucial for determining its short-term direction. Investors are watching closely to see if this bullish pattern holds and whether Ethereum can regain momentum, potentially sparking a recovery that could restore confidence in the market.
Ethereum Prepares For A Decisive Move
Ethereum appears to be gearing up for a decisive move as it struggles to reclaim momentum amid a challenging market environment. Investors are growing increasingly frustrated with Ethereum’s lackluster price action, and optimism for a rally is fading.
Compared to Bitcoin and other altcoins like Solana, Ethereum has been underperforming, leaving bulls with little control over the price action. The constant selling pressure has dampened hopes for a recovery, leading many to question whether Ethereum can regain its footing.
However, not all hope is lost. Top analyst Jelle recently shared a technical analysis on X, pointing out that Ethereum is still trading within a multi-year ascending triangle—a bullish pattern that historically precedes explosive moves.
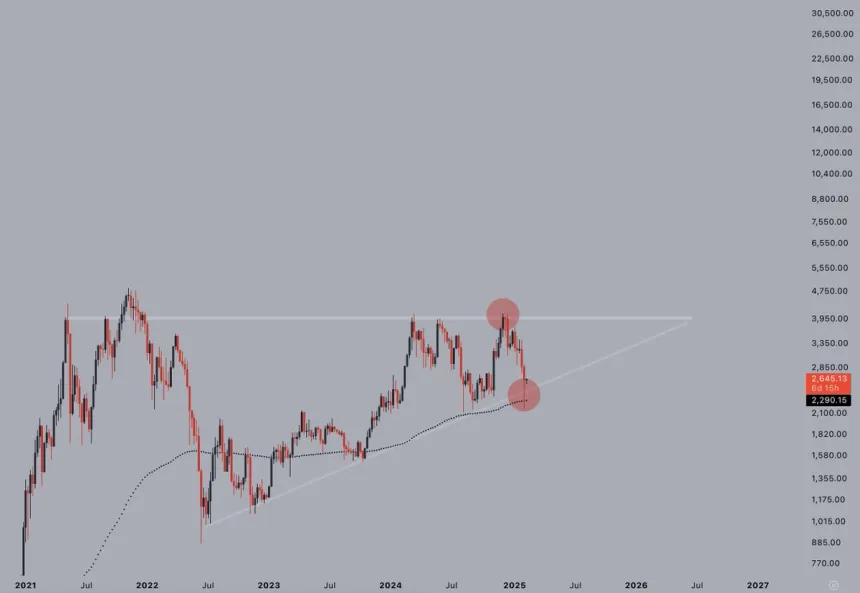
According to Jelle, Ethereum’s price has faked out on both sides of this structure, a behavior that often suggests the next move will be the real deal. This technical setup indicates that Ethereum is building energy for a significant breakout or breakdown.
Related Reading
Jelle also highlights the $4,000 mark as a critical supply zone. Ethereum has tested this level three times without success, but he believes the fourth attempt could finally break through. If Ethereum can clear this key resistance, it would mark a turning point and potentially ignite a rally into price discovery, restoring confidence among investors.
Price Analysis: Key Levels To Hold
Ethereum is currently trading at $2,650 after several days of selling pressure and market uncertainty. The price has struggled to reclaim the $2,800 mark since last Wednesday, reflecting a bearish sentiment that has dominated ETH’s price action since late December. Bulls are facing increasing challenges as the momentum remains on the side of the bears, and confidence among investors continues to weaken.
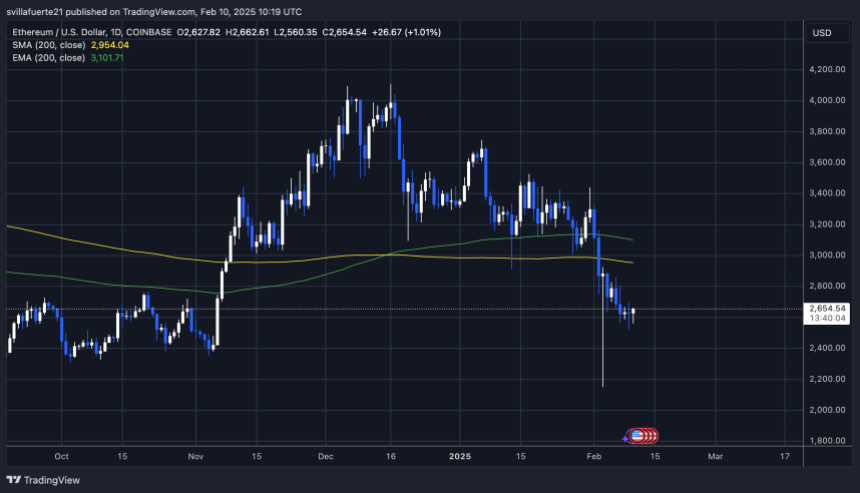
To reverse the ongoing downtrend, bulls need to hold the $2,600 level as strong support. This price has acted as a key demand zone in the past and could provide the foundation for a recovery. However, simply holding this level is not enough—Ethereum must also reclaim the $2,800 mark and, more importantly, break above the $3,000 level to signal a shift in market sentiment.
Related Reading
If Ethereum can hold above $2,600 and successfully reclaim both the $2,800 and $3,000 levels, it could spark a push into higher supply zones. A move like this would provide the momentum needed for bulls to regain control and potentially drive ETH toward stronger resistance levels. However, failing to hold $2,600 could open the door to further downside, with the next critical support levels significantly lower.
Featured image from Dall-E, chart from TradingView


Ethereum‘s bullish expectations in the ongoing cycle continue to be delayed due to heightened volatility across the general crypto market. Despite its struggles to initiate a major price rally, many crypto experts remain optimistic about an upsurge, pointing to key support levels that could spark a rebound for ETH.
A Push Back For Ethereum To $4,000 Closer?
Technical expert and trader Ali Martinez has highlighted an encouraging development for Ethereum, which could see the altcoin transitioning toward a positive territory shortly. Ali Martinez has predicted that ETH is eyeing possible upward movement to key resistance levels, but there’s a catch.
In his analysis, Ali Martinez stated that ETH might recover between the $3,000 and $4,000 level as it hovers near the crucial $2,600 support area. For the altcoin to surge to the price range, the expert noted that it needs to maintain its footing above this critical support zone.
ETH’s sustenance of the level is likely to build a bullish momentum, setting the stage for a strong recovery. The chart shows a Parallel Channel formation, a pattern that has historically preceded an upward trend.
His bullish forecast comes as ETH navigates heightened volatility, hindering its price from experiencing a notable price rally. Despite the worrying price movements, Martinez contends that now could be the right time to purchase the altcoin.

This is due to a positive signal cited in the TD Sequential indicator. Looking at Ethereum’s chart, the analyst outlined that ETH appears to be gearing up for a rebound as the indicator flashes a potential buy signal in the weekly and daily time frame.
The TD Sequential coupled with growing buying pressure, ETH could witness a trend reversal. Nonetheless, validating the authenticity of the signal will depend heavily on the state of the market and broader sentiment.
Once Ethereum recovers its upward trend, a 100% growth might be imminent. Ted Pillows, a market analyst and investor predicted after comparing the current price trend with the one seen in 2024.
In 2024, ETH witnessed a drop to crucial support levels such as the $2,100 mark. Following the decline, the altcoin pumped about 100% in the next 6 weeks. With recent price action trending similarly to 2024, the analyst expects the same 100% rally in the following weeks.
ETH Holding An Ascending Support
As ETH prepares for a rebound, Carl Moon noted that the asset is holding on to ascending support and has every potential to reenter into the pattern. After that, the analyst has placed the $4,000 target in the medium term.
Ethereum continues to hold above the $2,600 level with bullish momentum. Investors are betting significantly on its future price performances. Presently, its trading volume has surged by more than 87% in the last day.
Featured image from Unsplash, chart from Tradingview.com

A crypto analyst has shared a new bold forecast for the Ethereum price, predicting that the number one altcoin is on the verge of an explosive rally to $17,000. The analyst has cited past trends to support his bullish projections, highlighting that Ethereum rallies significantly after a decline.
Ethereum Price Forecast Targets $17,000
According to Kiu_Coin, the Ethereum season has just begun, opening up possibilities of price reversals and buying opportunities. Lately, the Ethereum price has been trading sideways, experiencing massive declines that the analyst has described as a “shake out.”
Related Reading
His chart shows that Ethereum has recorded a unique pattern of shakeouts over the past years, followed by explosive upward moves. In this context, a shakeout refers to a sudden drop in the price of a cryptocurrency that forces weak players in the market to sell their holdings before the price reverses and surges upward.
In his price chart, Ethereum experienced a final shakeout around 2020, during the previous bull market. This substantial decline was followed by a significant price spike in 2021, marking new ATHs for ETH. At the time, the cryptocurrency had skyrocketed by 1,310.6%, recording one of its largest price increases.
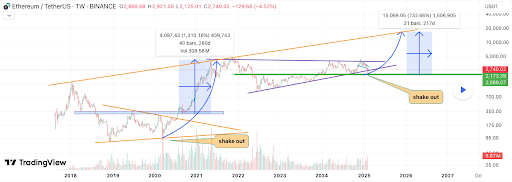
The current price is about $2,637, experiencing a shakeout similar to that in 2020. While other altcoins rallied these past few months, the Ethereum price has struggled with volatility and stagnation.
This bearish trend or shakeout has led to significant sell-offs by investors. If history is any indication, Kiu_Coin believes that once Ethereum concludes this decline stage and weak hands are removed from the market, the cryptocurrency could experience a bullish breakout to new highs.
Update On ETH Price Analysis
The TradingView expert projects an upward move toward the $17,000 price target. This would represent a 732% increase for Ethereum over the next 217 days, seven months from the time of the analysis. Support levels around $2,173 and $2,069 have also been marked on the chart, representing price levels that may prevent further decline in ETH.
As mentioned earlier, the Ethereum price has been on a severe downtrend, failing to meet the market’s expectations as its value drops steadily below the $3,000 mark. While other altcoins have recorded year-to-date increases, CoinMarketCap’s data shows that the Ethereum price has only increased by 5% since the beginning of the year.
Related Reading
Over the past month, the cryptocurrency experienced an 18.5% price crash owing to market volatility and the sudden decline in Bitcoin’s value. Although ETH struggles to recover from bearish trends, its 24-hour trading volume of $19 billion is up by 20.9%.
Featured image from Adobe Stock, chart from Tradingview.com
Ethereum
$55.8M In Ethereum Longs Wiped Out In One Hour As Futures Open Interest Plunges $4.6B – Details

Ethereum has just experienced one of the most chaotic trading days in its history, with price action resembling a rollercoaster. ETH plunged over 30% in less than 24 hours as fears of a U.S. trade war triggered a massive market selloff. However, just as quickly as panic set in, the market rebounded following President Trump’s announcement of negotiations with Canada and Mexico to lift tariffs. This sharp turnaround injected optimism back into the market, but uncertainty remains high.
The sudden drop wiped out millions in leveraged positions, creating one of the largest liquidation events in Ethereum’s history. Data from Glassnode reveals that yesterday, $76.4 million in ETH long liquidations hit the market, with $55.8 million being wiped out in a single hour—marking the second-largest liquidation spike in a year, just behind the $56 million event on December 9. This intense price action highlights the unprecedented volatility in Ethereum and the broader crypto market.
Now, the focus shifts to Ethereum’s ability to sustain its recovery and reclaim key resistance levels. With uncertainty still looming, the next few days will be critical in determining whether ETH can regain its bullish momentum or if further downside is on the horizon.
Ethereum Open Interest Drops Significantly
Ethereum has experienced one of the most volatile trading sessions in its history, dropping over 30% in less than 24 hours amid U.S. trade war fears, only to recover rapidly following President Trump’s announcement of negotiations with Canada and Mexico. This extreme price action has shaken investor confidence, but analysts suggest ETH is now stabilizing and preparing for a push higher.
Key data from Glassnode reveals the extent of the liquidation event that fueled this historic drop. Yesterday, $76.4 million in ETH long liquidations hit the market, with $55.8 million wiped out in a single hour—the second-largest spike in a year, just behind the $56 million liquidation recorded on December 9. The rapid price decline triggered a significant unwinding of futures open interest. ETH futures OI fell from $20.5 billion at the start of February to $15.9 billion today, wiping out $4.6 billion in leveraged positions.
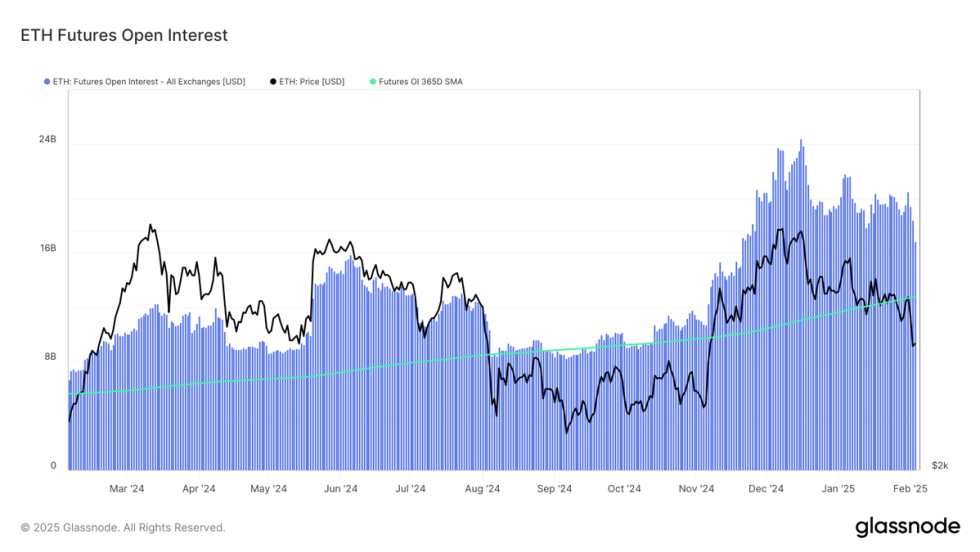
Despite this sharp decline, Ethereum futures OI remains ~22% above its yearly trendline of $13 billion, suggesting that leverage remains elevated. Ethereum’s price has been heavily influenced by leveraged trading, as speculation and aggressive long positions fueled rapid swings. As the market recalibrates, a shift towards spot-driven price action could pave the way for healthier and more sustainable growth.
The coming weeks will be crucial in determining whether Ethereum can recover its bullish momentum. If ETH consolidates above key support levels and open interest stabilizes, the market could be setting up for another leg higher. However, if leverage remains high and speculative trading continues to dominate price action, further volatility and corrections may follow.
ETH Struggles Below Key Level Amid Market Uncertainty
Ethereum (ETH) is trading at $2,810 after a highly volatile start to the week. Despite a sharp recovery from its recent lows, bulls are still facing serious challenges as ETH trades below the crucial $3,000 mark, a level that also aligns with the 200-day moving average. This key resistance has historically acted as a major pivot point for Ethereum’s price action, making it a critical level to reclaim for bullish momentum to resume.
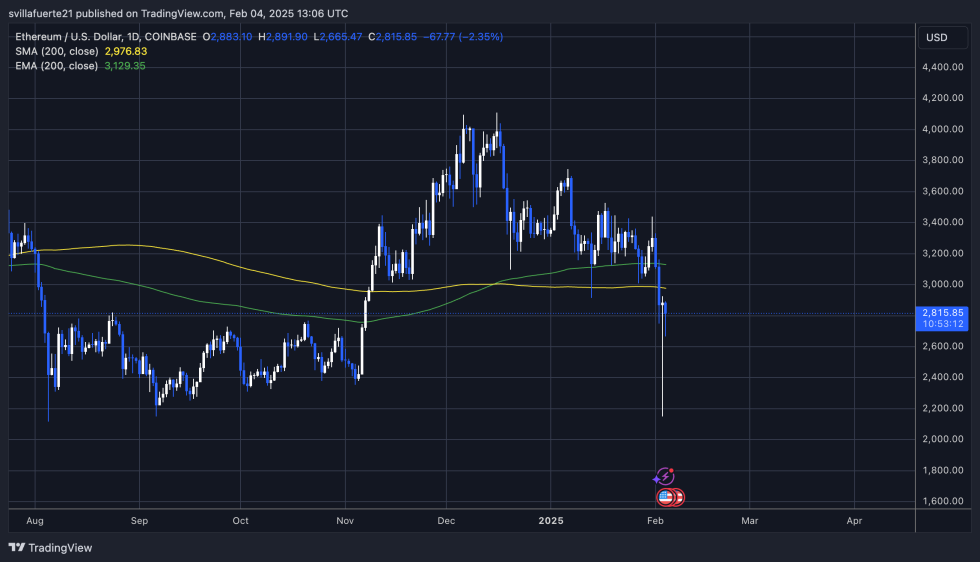
If bulls want to establish a new uptrend, ETH needs to break above the $3,000 mark with strength and hold it as support. A successful reclaim of this level could set the stage for a sustained rally toward $3,200 and beyond. However, failure to do so leaves Ethereum vulnerable to further downside risk.
Losing the $2,800 level could trigger additional selling pressure, potentially leading ETH to revisit lower demand levels around $2,650–$2,700. With market sentiment still uncertain and leveraged positions unwinding, traders are closely watching price action for confirmation of the next major move. Whether Ethereum can regain its footing or faces further declines will depend on its ability to reclaim key resistance levels in the coming days.
Featured image from Dall-E, chart from TradingView

DOGE Holding Time Spikes, Signaling Strong Market Momentum

ADA Aims For $0.8119 As Confidence Grows

Ethereum’s Price Recovery Of The $4,000 Mark Hinges On This Crucial Support Level

Breakout Signals Potential for $1.05

North Carolina Introduces Bill to Invest in Bitcoin and Digital Assets

Will It Smash Resistance and Climb?

2.52 Million Altcoins Are Ruining Crypto’s Future

Animoca Brands Valuation Tanks 75% In Two Years, Here’s Why

Crypto exchange BingX hacked for $43 million

Are The Big Players Losing Interest?

Hong Kong’s Securities Association Tips Authorities On Crypto Self-Regulation

Coinbase cbBTC Set to go Live on Solana
2.52 Million Altcoins Are Ruining Crypto’s Future
Animoca Brands Valuation Tanks 75% In Two Years, Here’s Why
Crypto exchange BingX hacked for $43 million
Are The Big Players Losing Interest?
Hong Kong’s Securities Association Tips Authorities On Crypto Self-Regulation
Coinbase cbBTC Set to go Live on Solana
-

 Altcoin23 hours ago
Trump’s Tariffs, AI Meme Coins, P2E Games
-

 Altcoin14 hours ago
Bitcoin Treasury Firm Metaplanet Is Japan’s Hottest Stock, Up 3,600%
-

 Market24 hours ago
Weekly Price Analysis: Crypto Prices Reel from Risk Off Sentiments
-

 Bitcoin21 hours ago
Crypto Inflows Hit $1.3 Billion Despite Price Volatility
-

 Market21 hours ago
Shiba Inu (SHIB) Demand Plummets as Meme Coin Hype Fades
-

 Ethereum24 hours ago
Analyst Says Prepare For Ethereum Price To Hit $17,000, Here’s Why
-

 Market20 hours ago
Strategy Resumes Bitcoin Buys After Rebrand and Purchase Pause
-

 Bitcoin24 hours ago
Japan’s FSA Plans Crypto Tax Reform & Bitcoin ETF Greenlight