
Market
ETH Price Stuck Below $3,000 as Bearish Pressure Persists

Ethereum (ETH) price is struggling to reclaim the $3,000 level as bearish momentum continues to weigh on its recovery. The RSI remains neutral, failing to break above 50 since February 1, indicating that buying pressure has yet to strengthen significantly.
Meanwhile, the Directional Movement Index (DMI) shows that ETH is still in a downtrend, though selling pressure has started to ease slightly. With short-term EMAs still below long-term ones, ETH remains at risk of further declines unless momentum shifts in favor of the bulls.
ETH RSI Failed to Break Above 50 Since February 1
Ethereum’s Relative Strength Index (RSI) is currently at 44.7, maintaining a neutral stance since February 3 after briefly plunging to 16.7 on February 2. The RSI is a momentum oscillator that measures the strength and speed of price movements on a scale from 0 to 100.
Typically, an RSI above 70 signals overbought conditions, suggesting a potential price correction, while an RSI below 30 indicates oversold levels, often associated with buying opportunities.
A reading between 30 and 70 is considered neutral, meaning the market lacks a clear bullish or bearish trend.
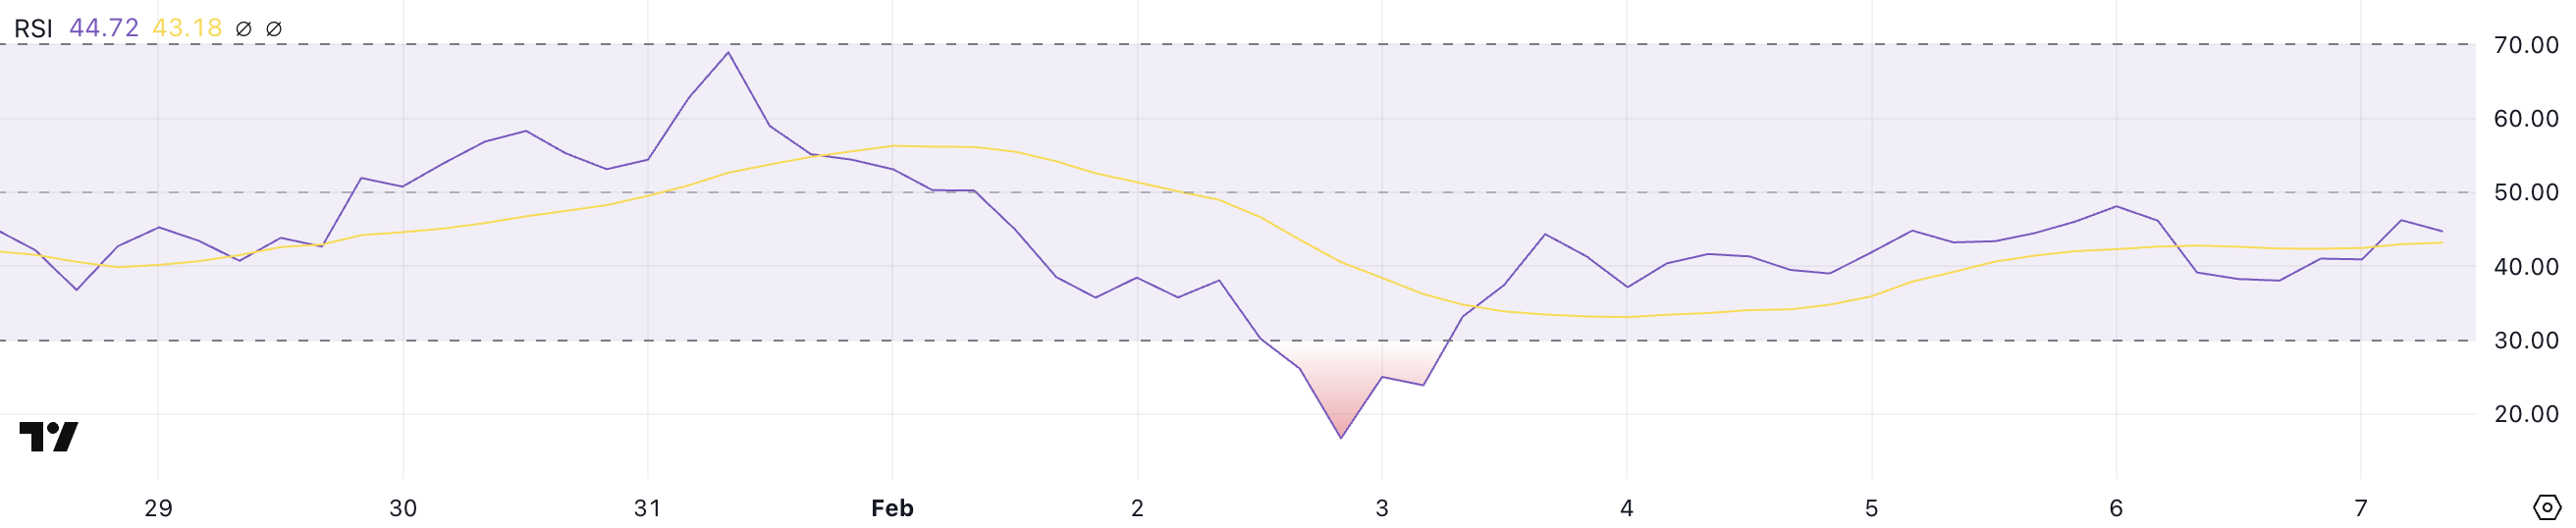
With ETH RSI at 44.7, it remains in neutral territory but continues to struggle to break above 50, a level it has failed to reach since February 1. This suggests that while bearish pressure has eased since the extreme oversold conditions of early February, buying momentum remains weak.
If ETH can push its RSI above 50, it would indicate a shift toward bullish control, potentially leading to a stronger price recovery.
However, failure to do so may signal prolonged consolidation or even renewed selling pressure, keeping ETH in a choppy trading range until stronger demand emerges.
Ethereum DMI Shows The Current Trend Is Still Bearish
Ethereum’s Directional Movement Index (DMI) chart shows that its Average Directional Index (ADX) is currently at 34.2, down from 40 just two days ago. The ADX measures trend strength, with values above 25 generally indicating a strong trend and values below 20 suggesting weak or range-bound price action.
A reading of 34.2 confirms that ETH price is still in a well-defined trend, though the slight decline in ADX suggests that trend strength is weakening.
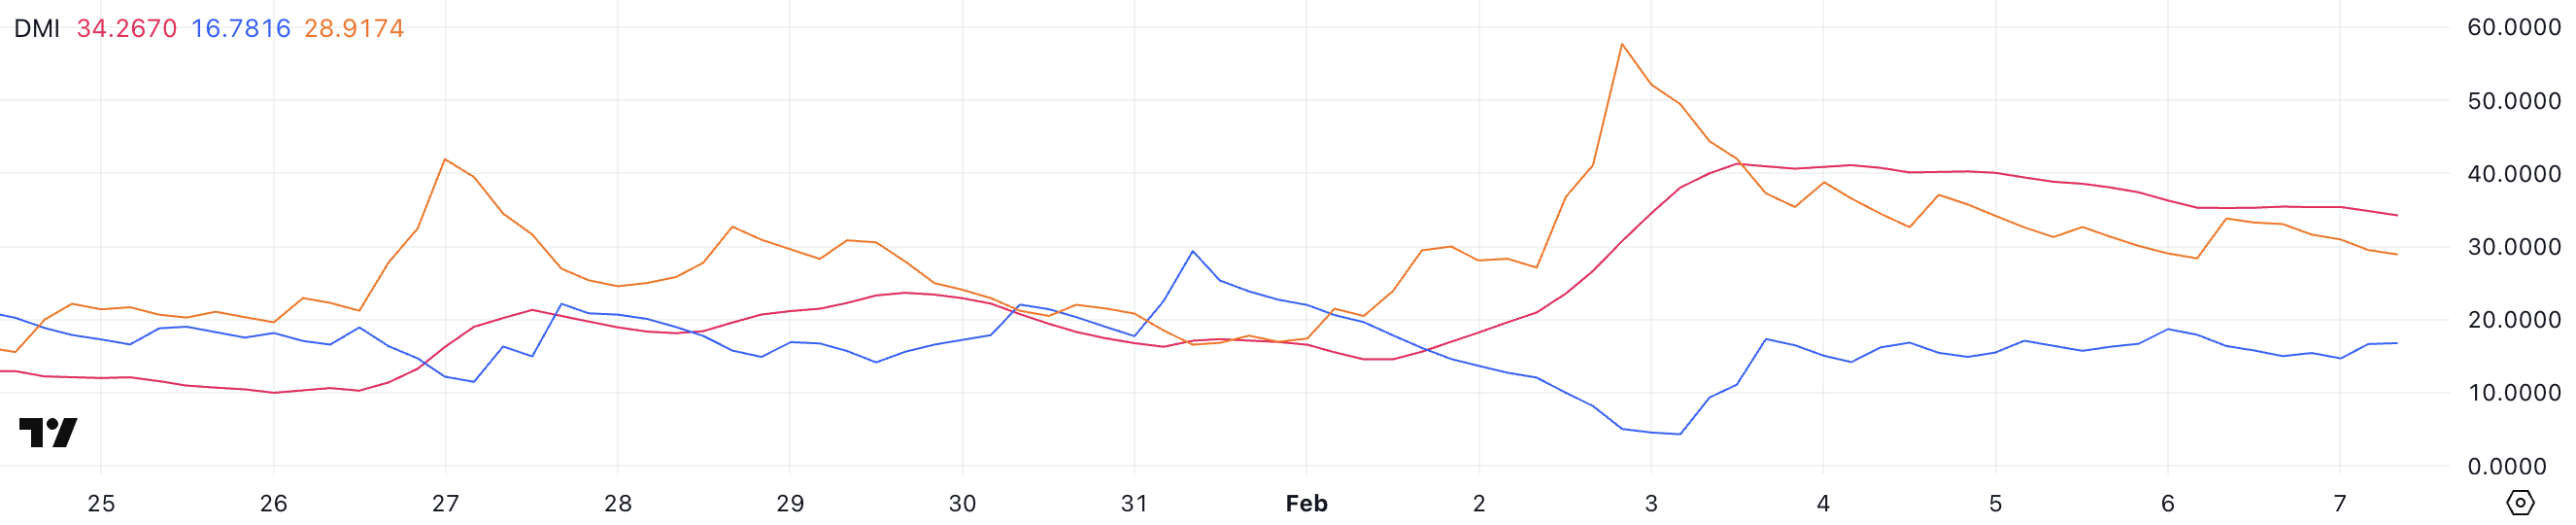
ETH’s +DI is currently at 16.7 and has been fluctuating between 14 and 18 over the past four days. That indicates a weak bullish momentum. Meanwhile, the -DI has dropped from 33.8 yesterday to 28.9, suggesting that selling pressure could be easing.
Despite this, Ethereum remains in a downtrend, as the -DI is still significantly higher than the +DI. If the +DI begins to rise while the -DI continues to decline, it could suggest an early shift in momentum toward a potential trend reversal.
However, as long as the -DI remains dominant and ADX holds above 25, ETH could continue facing downside risks before any significant recovery materializes.
ETH Price Prediction: Will Ethereum Return To $3,000 In The Next Days?
Ethereum Exponential Moving Average (EMA) lines continue to indicate a bearish trend, with short-term EMAs still positioned below long-term ones. This alignment suggests that downward pressure remains dominant, keeping ETH at risk of further declines.
If this bearish momentum persists, Ethereum price could test the support level at $2,356, and a failure to hold this zone could lead to a deeper drop toward $2,163.
The current EMA structure reflects a market where sellers remain in control, and a clear shift in trend would be required to reverse the ongoing decline.
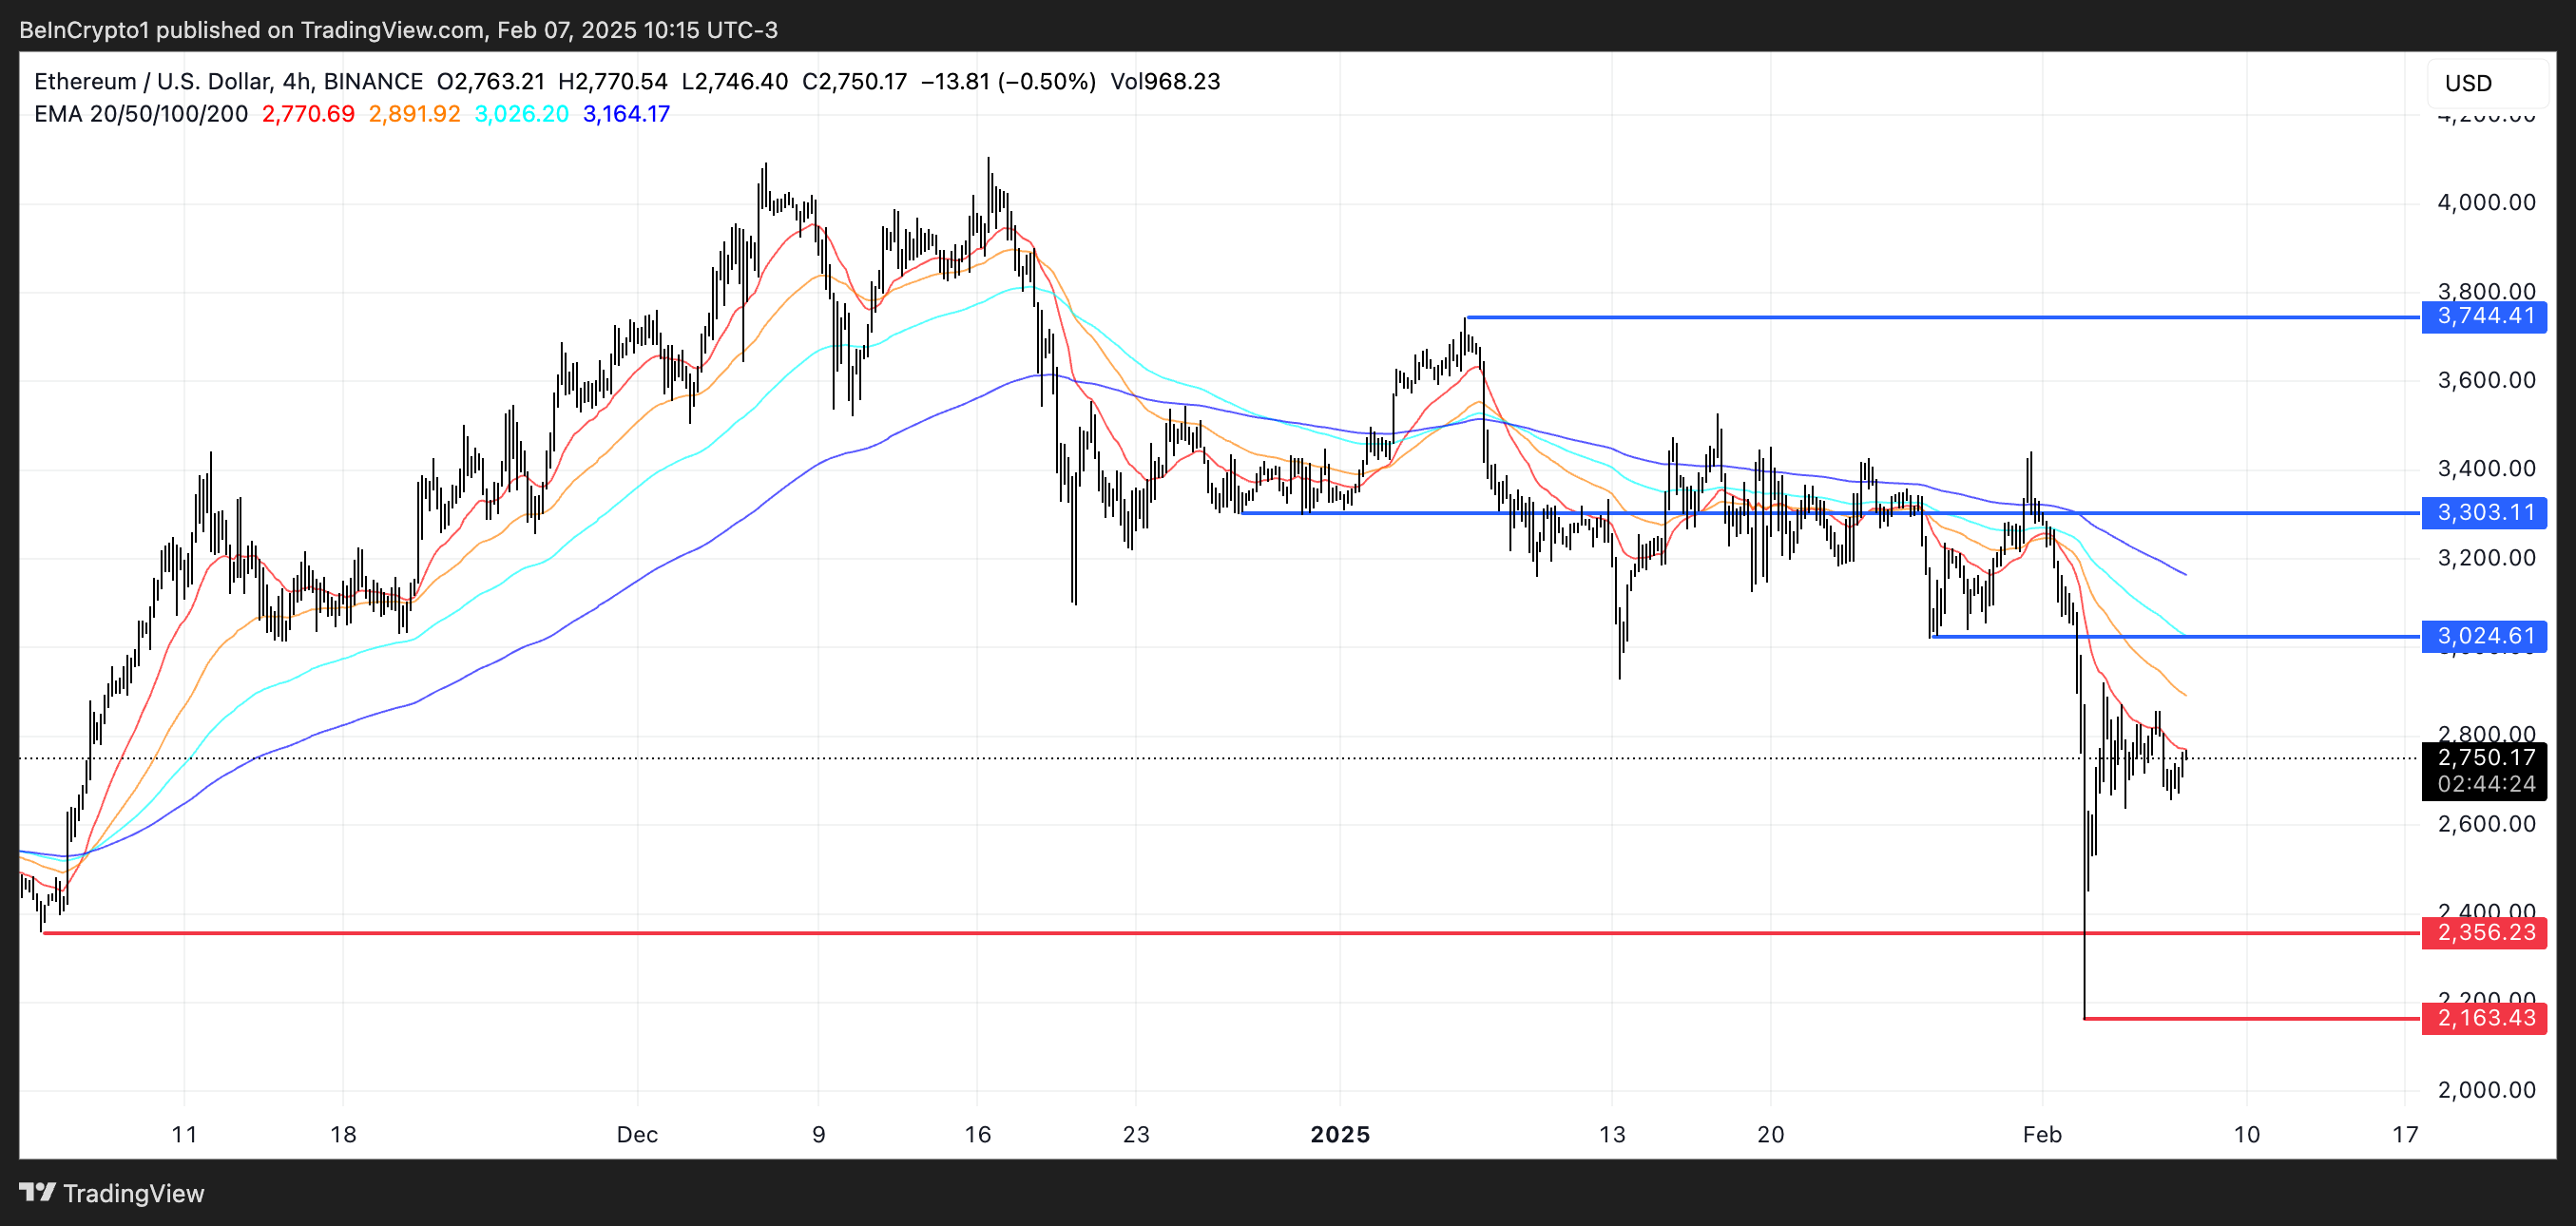
However, if ETH can regain positive momentum, it could make a move back toward the $3,000 level. A breakout above this psychological resistance could signal renewed bullish strength, potentially pushing ETH to $3,300.
If buying pressure remains strong beyond this point, ETH price could even rally to $3,744, marking its highest price since January 6.
Disclaimer
In line with the Trust Project guidelines, this price analysis article is for informational purposes only and should not be considered financial or investment advice. BeInCrypto is committed to accurate, unbiased reporting, but market conditions are subject to change without notice. Always conduct your own research and consult with a professional before making any financial decisions. Please note that our Terms and Conditions, Privacy Policy, and Disclaimers have been updated.


The Economic and Financial Crimes Commission (EFCC), a law enforcement agency in Nigeria, busted a major crypto crime ring with hundreds of potential criminals. Among them, 53 individuals have been officially charged.
The police were only able to recover around $200,000 in assets, but they’ve identified nearly $3 million in various other deposits. Given the global spread of the crime, It’s uncertain how much money this operation made in total or where these assets have been laundered.
EFCC Busts Crypto Criminals
According to reports, these scammers ran several different operations, but they all fell under the broad umbrella of crypto crimes. These suspects were arrested with 739 other members last December, and all pled not guilty.
“The Lagos Zonal Directorate of the EFCC, on February 3, 2025, arraigned [53 defendants] before separate Federal High Courts sitting in Ikoyi, Lagos. They were arraigned on separate charges bordering on alleged cybercrimes, cyber-terrorism, impersonation, possession of documents containing false pretenses, and identity theft, among others,” it read.
Last year, Nigeria won international notoriety for being tough on crypto crime, and the EFCC is maintaining that reputation. Specifically, the country arrested two Binance executives for suspicious trading activity, sparking a diplomatic incident with the US. Eventually, it dropped the charges, but only after months of negotiation.
Law enforcement reportedly only seized over $200,000 in assets. This might seem small compared to some of the major scams in today’s crypto market, but the depth of the crime is still under investigation.
For instance, over 500 local SIM cards, mobile phones, laptops, and several cars were seized from the syndicate’s seven-story base in Lagos.
The vast number of resources suggests that the amount of money stolen could potentially be billions. However, given the global spread of the crime, it would be challenging to track all the stolen assets.
The EFCC claimed that these crypto criminals were a very diverse and multinational group. It contained at least 792 members from five or more countries, not counting Nigeria. Over a nine-month period, they deposited $1.5 million in a bank account and sent $2.39 million to two launderers using P2P transactions.
However, there could be dozens or even hundreds of unknown associates whose funds haven’t been traced. The EFCC accused these crypto criminals of activities that “seriously destabilize the economic and social structure” of Nigeria. It’s clear why.
Still, their capture proves an encouraging point. Law enforcement agencies around the world are learning to pursue crypto criminals, and their methods are improving. These groups can’t evade capture forever.
Disclaimer
In adherence to the Trust Project guidelines, BeInCrypto is committed to unbiased, transparent reporting. This news article aims to provide accurate, timely information. However, readers are advised to verify facts independently and consult with a professional before making any decisions based on this content. Please note that our Terms and Conditions, Privacy Policy, and Disclaimers have been updated.

Despite the strong corrections in the last 30 days, artificial intelligence continues to be one of the most disruptive narratives in crypto. While some AI coins have struggled, others are showing resilience, making them key assets to watch in the second week of February 2025.
SwarmNode.ai (SNAI) has been one of the strongest performers, surging over 170% in a week, while Venice Token (VVV) is attempting a recovery despite transparency concerns. Meanwhile, Virtuals Protocol (VIRTUAL) has dropped 44% in a week, reflecting the broader slowdown in crypto AI agents.
SwarmNode.ai (SNAI)
SNAI serves as the backbone of SwarmNode, a platform designed for deploying serverless AI agents in the cloud. Through the SwarmNode Python SDK, users can seamlessly coordinate and automate interactions between these AI-driven agents, optimizing workflows and enhancing efficiency.
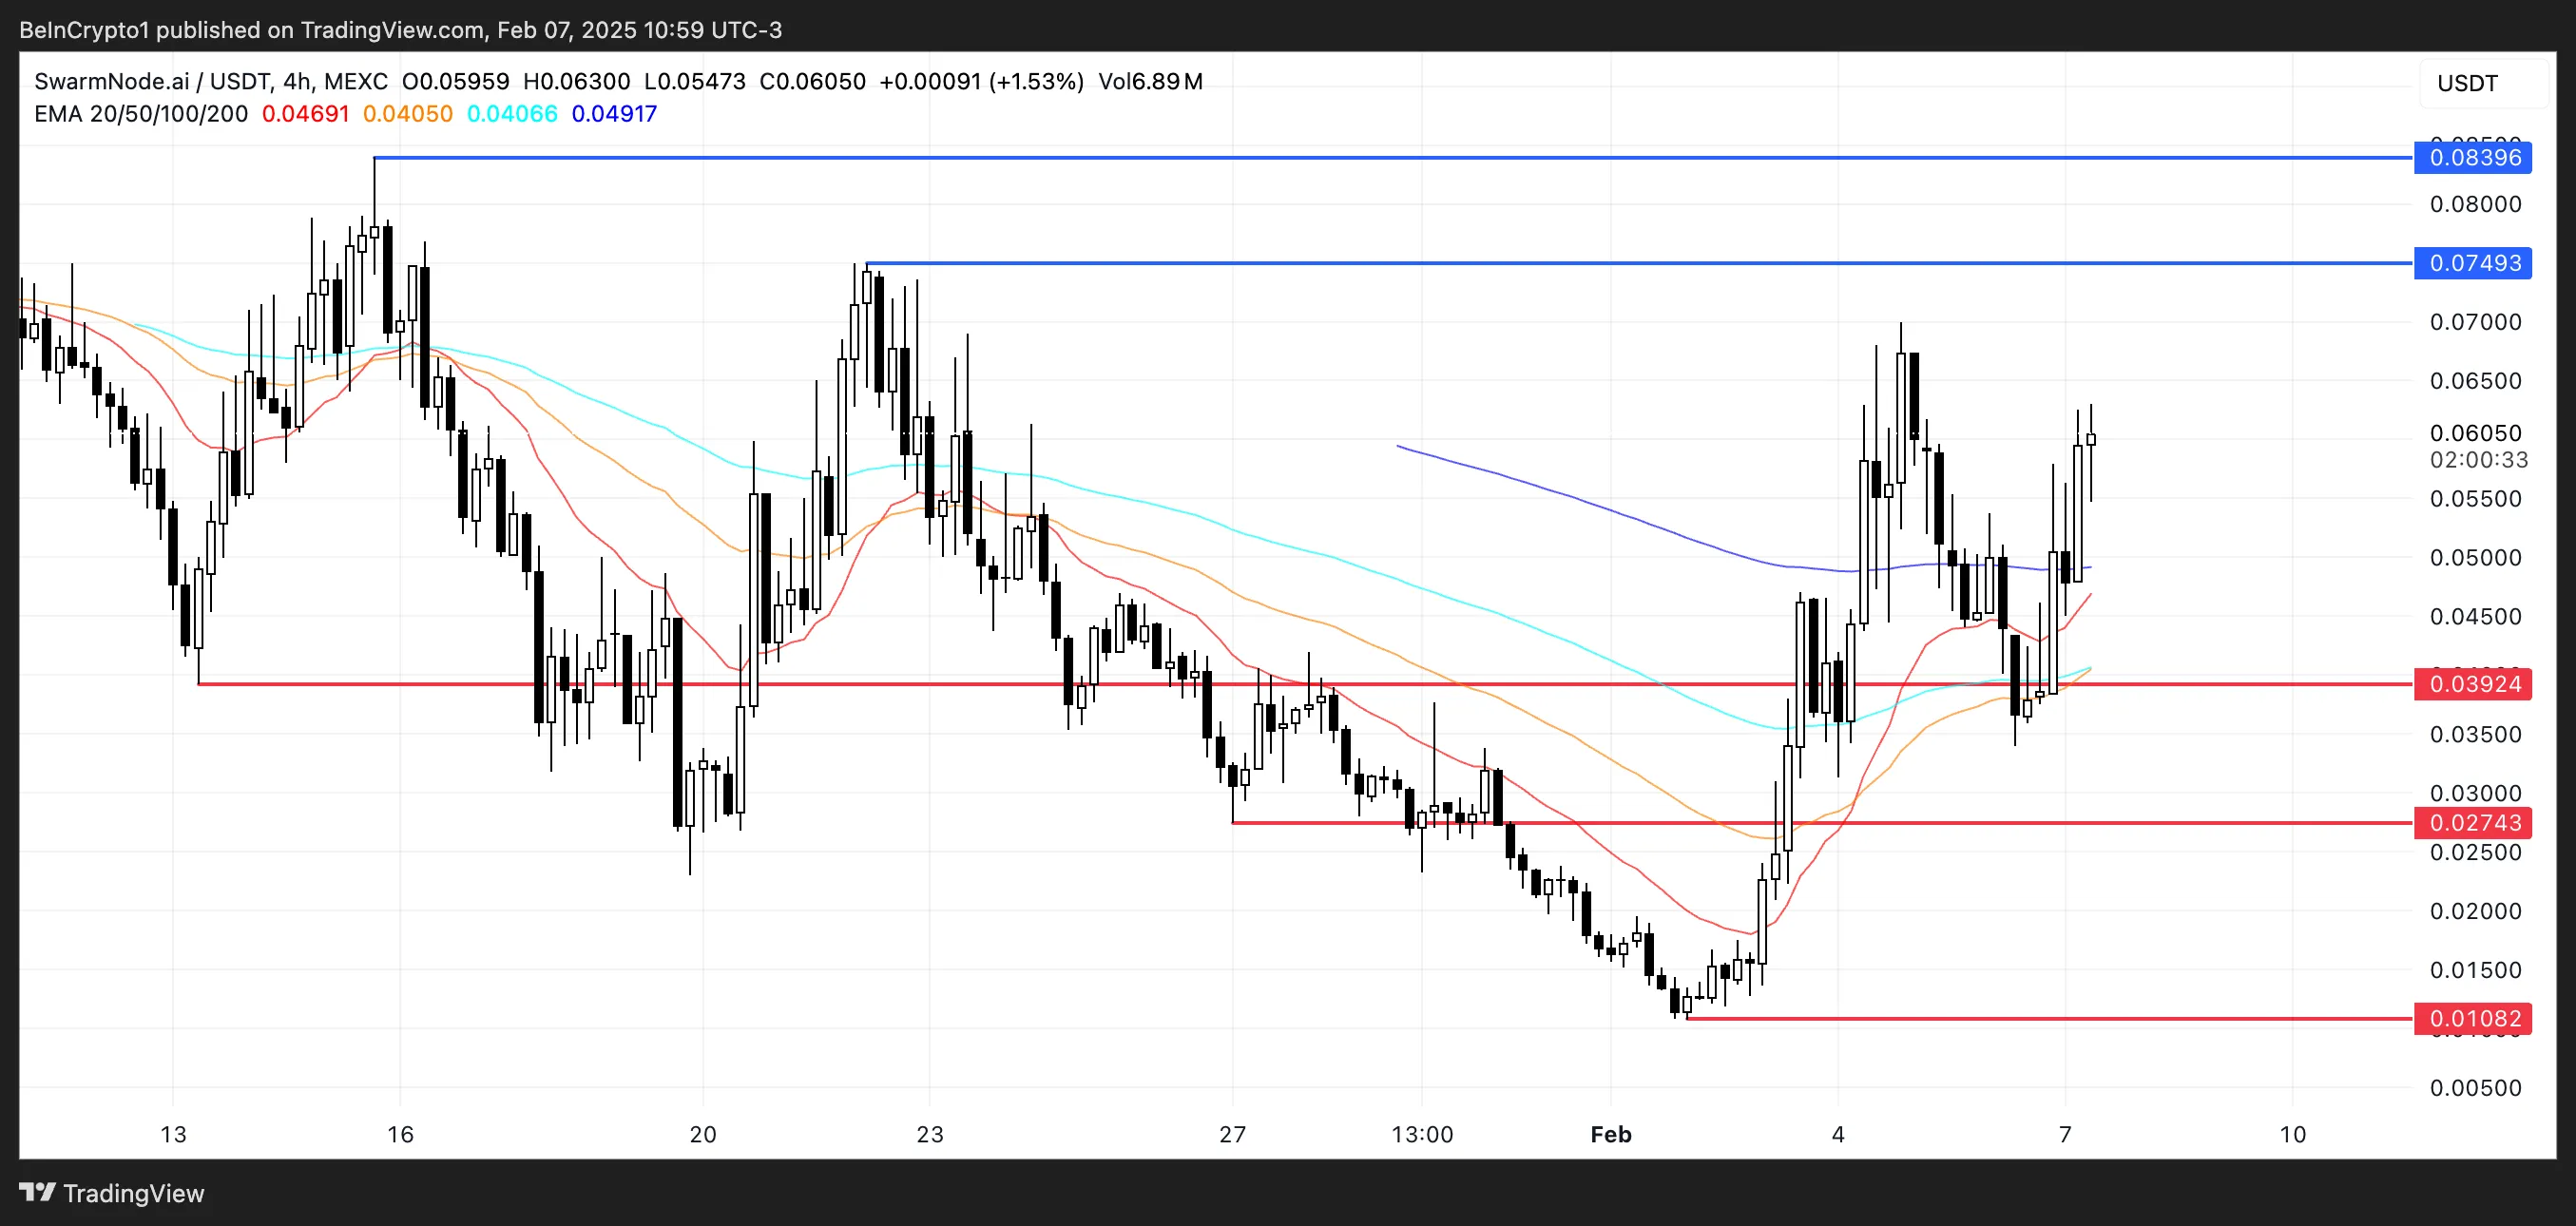
SNAI is one of the few AI coins showing strong gains this week. It has surged over 170% in the past seven days and pushed its market cap to $51 million. Technical indicators suggest that a golden cross may soon form on the price chart, signaling a potential bullish continuation.
If this happens, SNAI could climb toward the $0.749 resistance level, with a successful breakout opening the door for a move to $0.0839. However, if momentum fades, key supports lie at $0.039 and $0.027, with a deeper correction toward $0.010 possible if these levels fail to hold.
Venice Token (VVV)
VVV is the core token of Venice AI, a ChatGPT alternative designed to prioritize privacy and unrestricted conversations. Founded by Erik Voorhees, the founder of ShapeShift, Venice AI integrates decentralized principles to ensure user autonomy and freedom of interaction.
Initially distributed via an airdrop to early adopters, VVV has since been launched on the Base chain, where it quickly became one of the most trending tokens on the network.
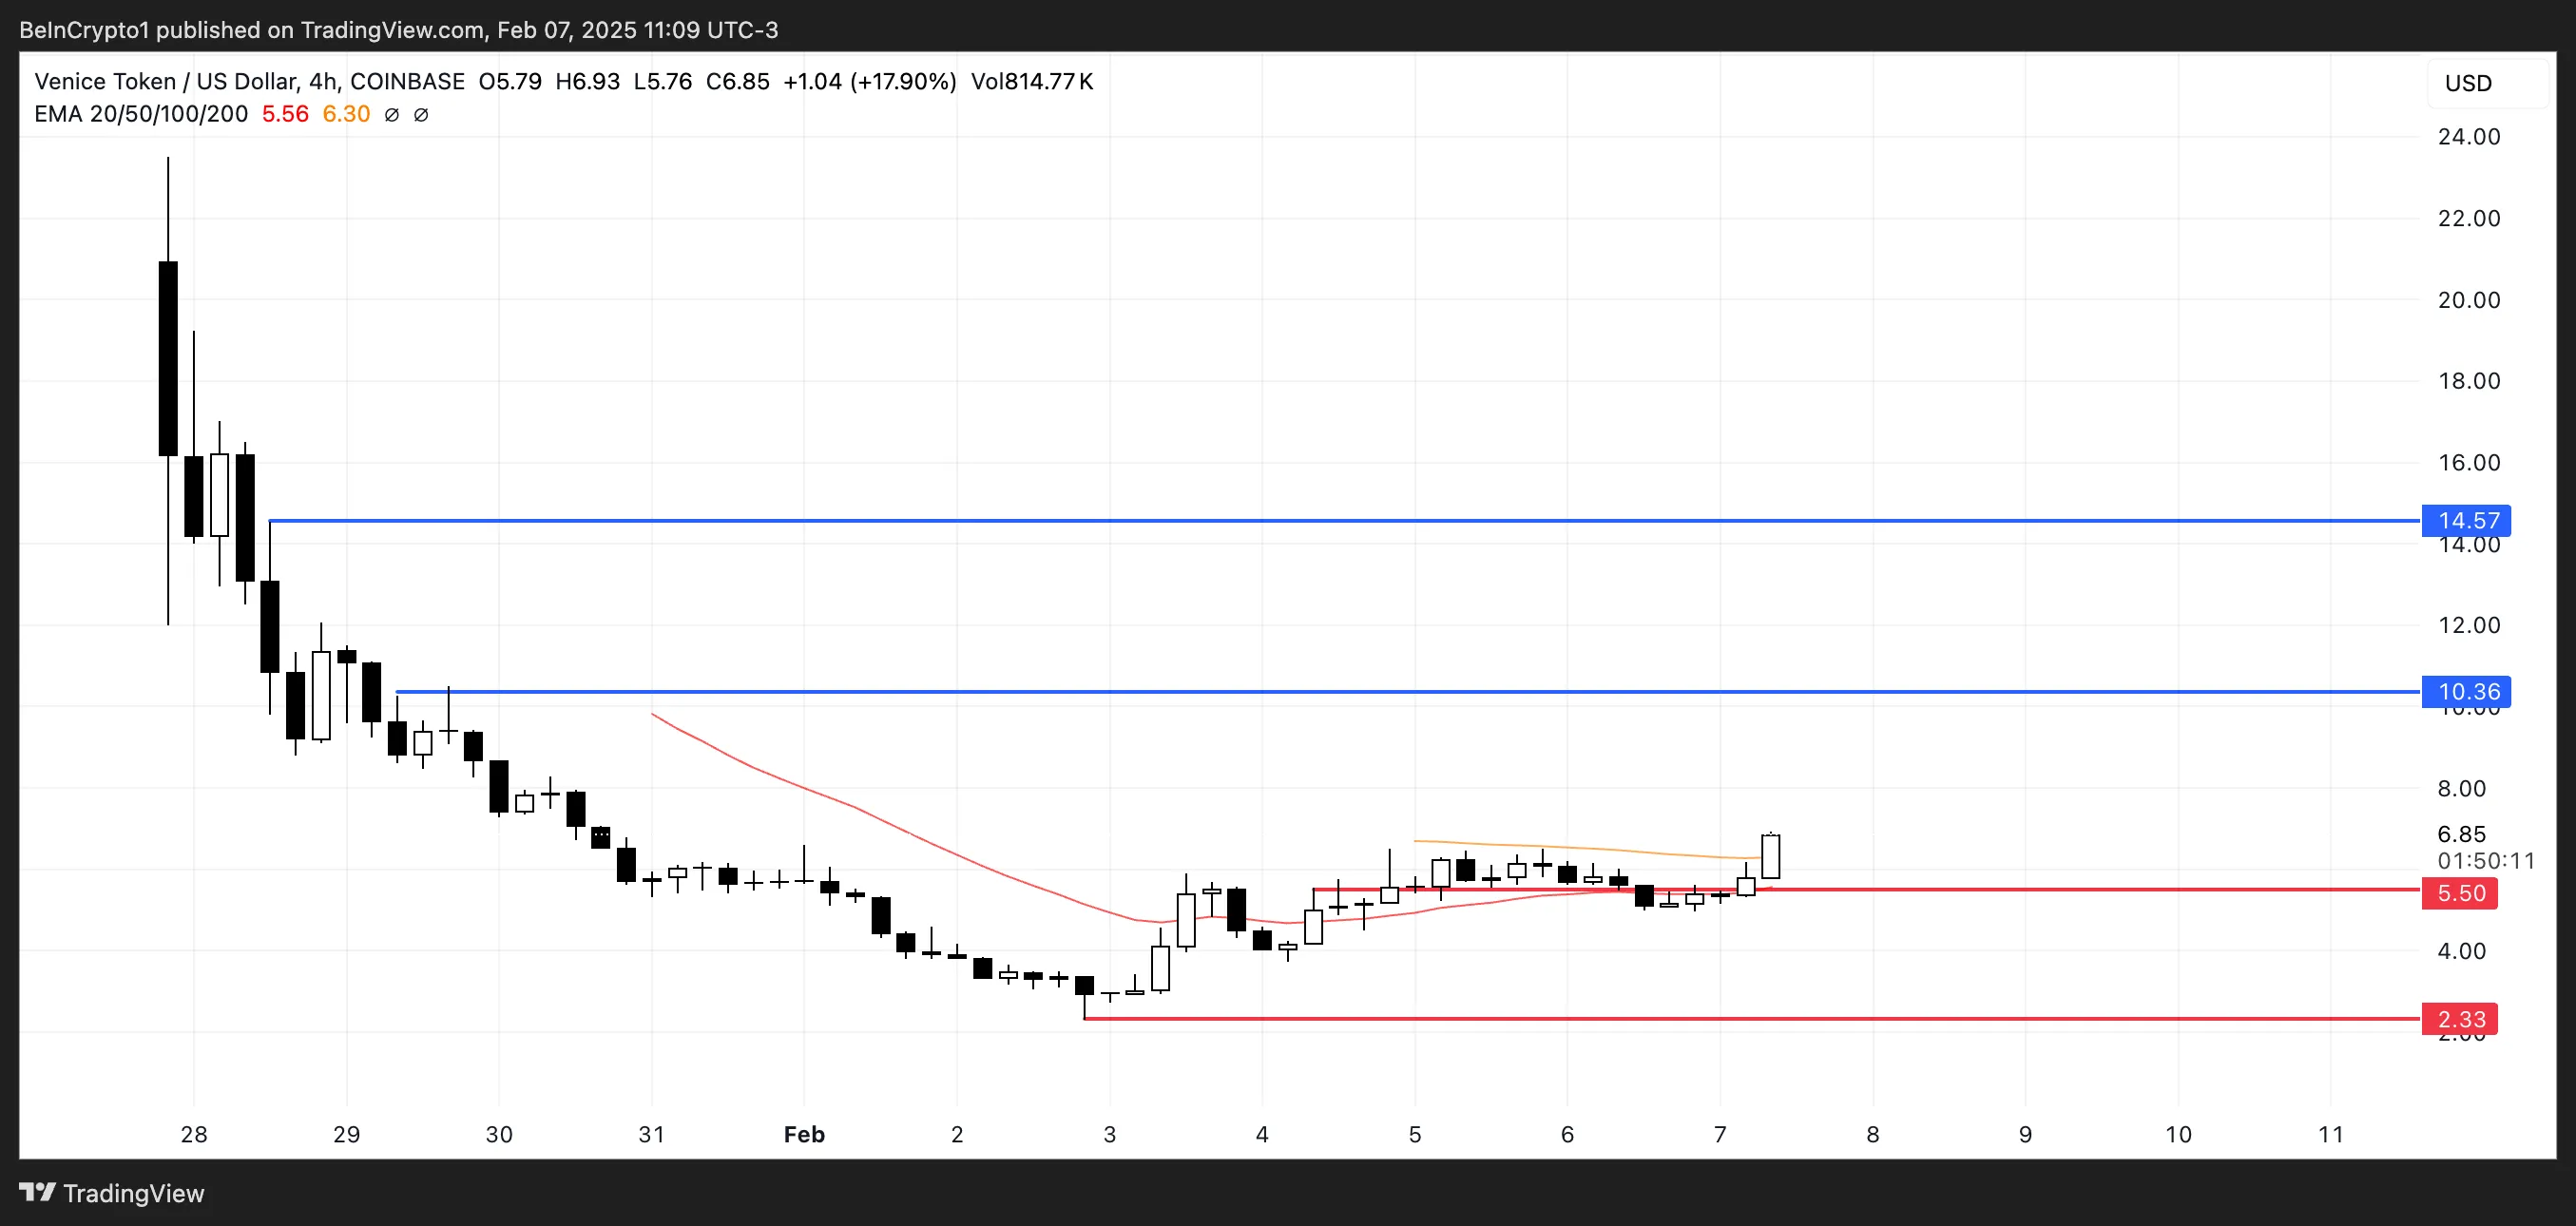
VVV is among the few artificial intelligence tokens posting gains this week, climbing approximately 8% over the past seven days despite recently hitting all-time lows.
If bullish momentum continues, VVV could soon challenge the $10.36 level, with a breakout potentially driving the price toward $14.57, its highest mark since January 28.
However, concerns about transparency have weighed on market sentiment. Some users on X (formerly Twitter) have alleged that the project’s team started selling VVV just hours after its Coinbase listing.
If selling pressure escalates, the token could retest support at $5.50, with a deeper drop to $2.33 possible if bearish momentum persists.
Virtuals Protocol (VIRTUAL)
VIRTUAL was once the leading artificial intelligence crypto, but it has faced heavy losses. Its market cap has dropped 44% in the last seven days to $813 million.
The token is struggling due to the broader correction in the AI sector and also because the crypto AI agents market has seen declining engagement and stagnation in new project launches.
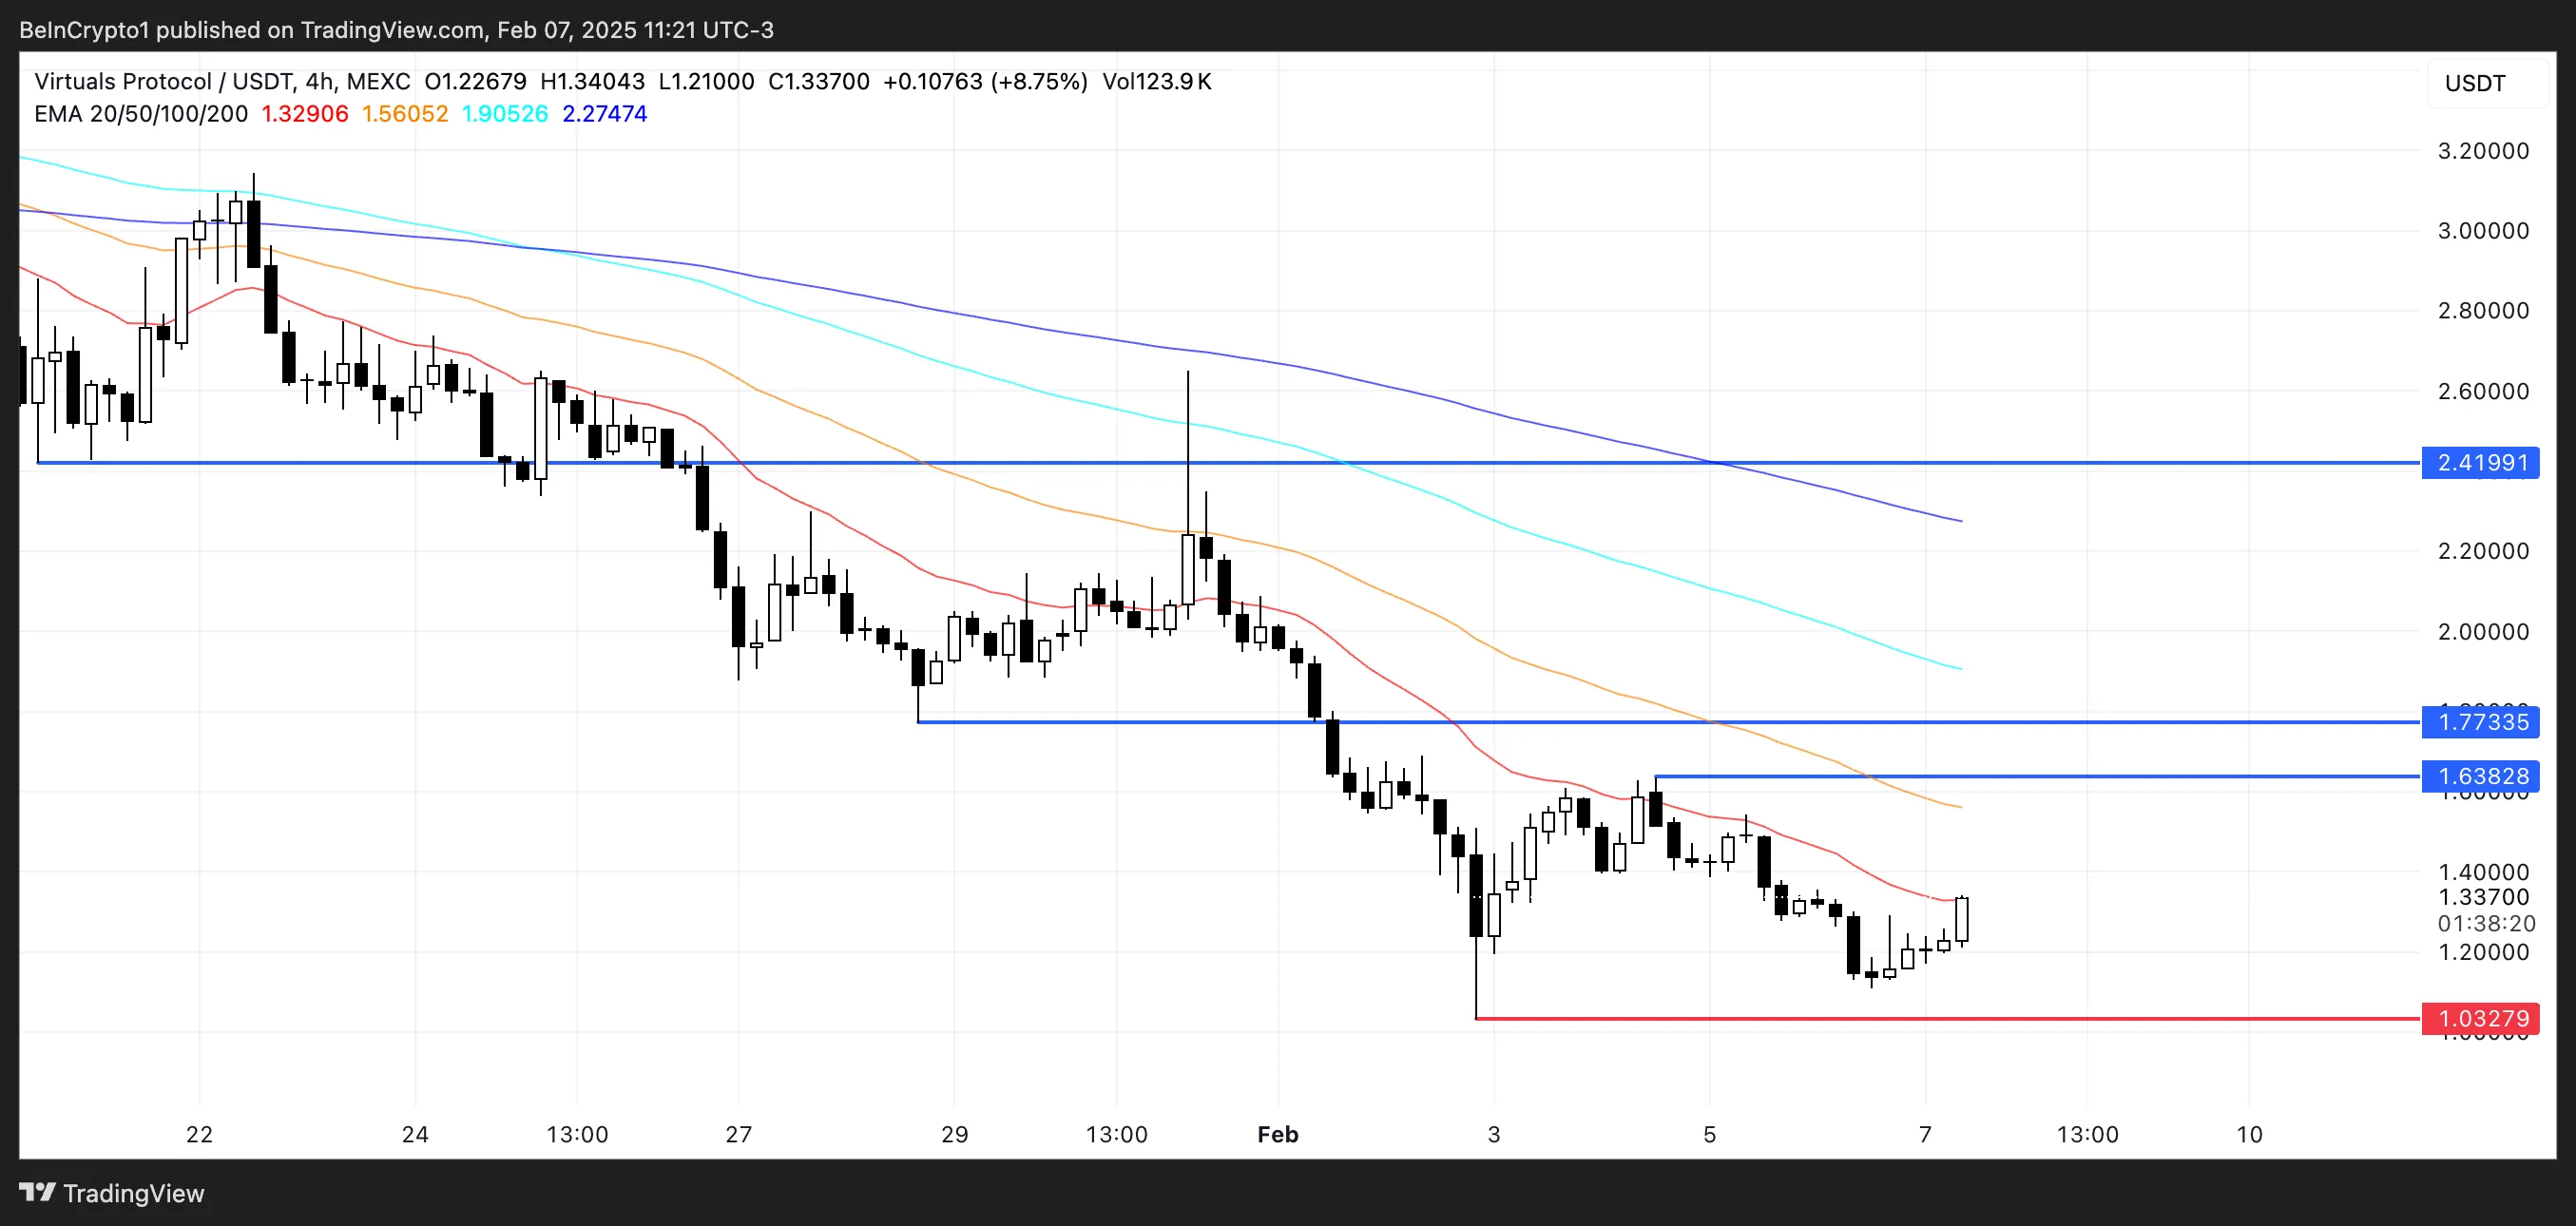
However, if the hype surrounding crypto AI agents returns, VIRTUAL could regain momentum and test resistance levels at $1.63 and $1.77, especially if its expansion to Solana brings more attention and new agents.
A breakout above these key levels, combined with renewed market excitement, could push VIRTUAL toward $2.41, its highest price in weeks.
On the other hand, if the correction deepens, the token risks falling further, with downside targets extending as low as $1.03.
Disclaimer
In line with the Trust Project guidelines, this price analysis article is for informational purposes only and should not be considered financial or investment advice. BeInCrypto is committed to accurate, unbiased reporting, but market conditions are subject to change without notice. Always conduct your own research and consult with a professional before making any financial decisions. Please note that our Terms and Conditions, Privacy Policy, and Disclaimers have been updated.

Solana (SOL) price has seen strong corrections over the past week, dropping 17% and falling below the $100 billion market cap. The Ichimoku Cloud chart indicates that bearish momentum remains dominant, with SOL trading below key trend indicators and reflecting downside pressure.
Meanwhile, the Directional Movement Index (DMI) suggests that the strength of the current downtrend is still intact, though selling pressure appears to be weakening. With technical indicators showing mixed signals, SOL’s next move will depend on whether it can regain momentum or continue its decline toward lower support levels.
SOL Ichimoku Cloud Show the Bearish Momentum Is Still Here
The Ichimoku Cloud chart for Solana shows a predominantly bearish setup. The price is trading below the cloud, and the cloud itself is shaded red, indicating continued downside pressure.
The Kijun-sen (red line) remains above the price, reinforcing the bearish bias, while the Tenkan-sen (blue line) is also positioned below the cloud, suggesting that short-term momentum is still weak.
Additionally, the Senkou Span A (green cloud boundary) is trending below Senkou Span B (red cloud boundary), signaling that the broader trend remains downward. The fact that the price is below both the conversion and base lines further confirms that bears are in control.
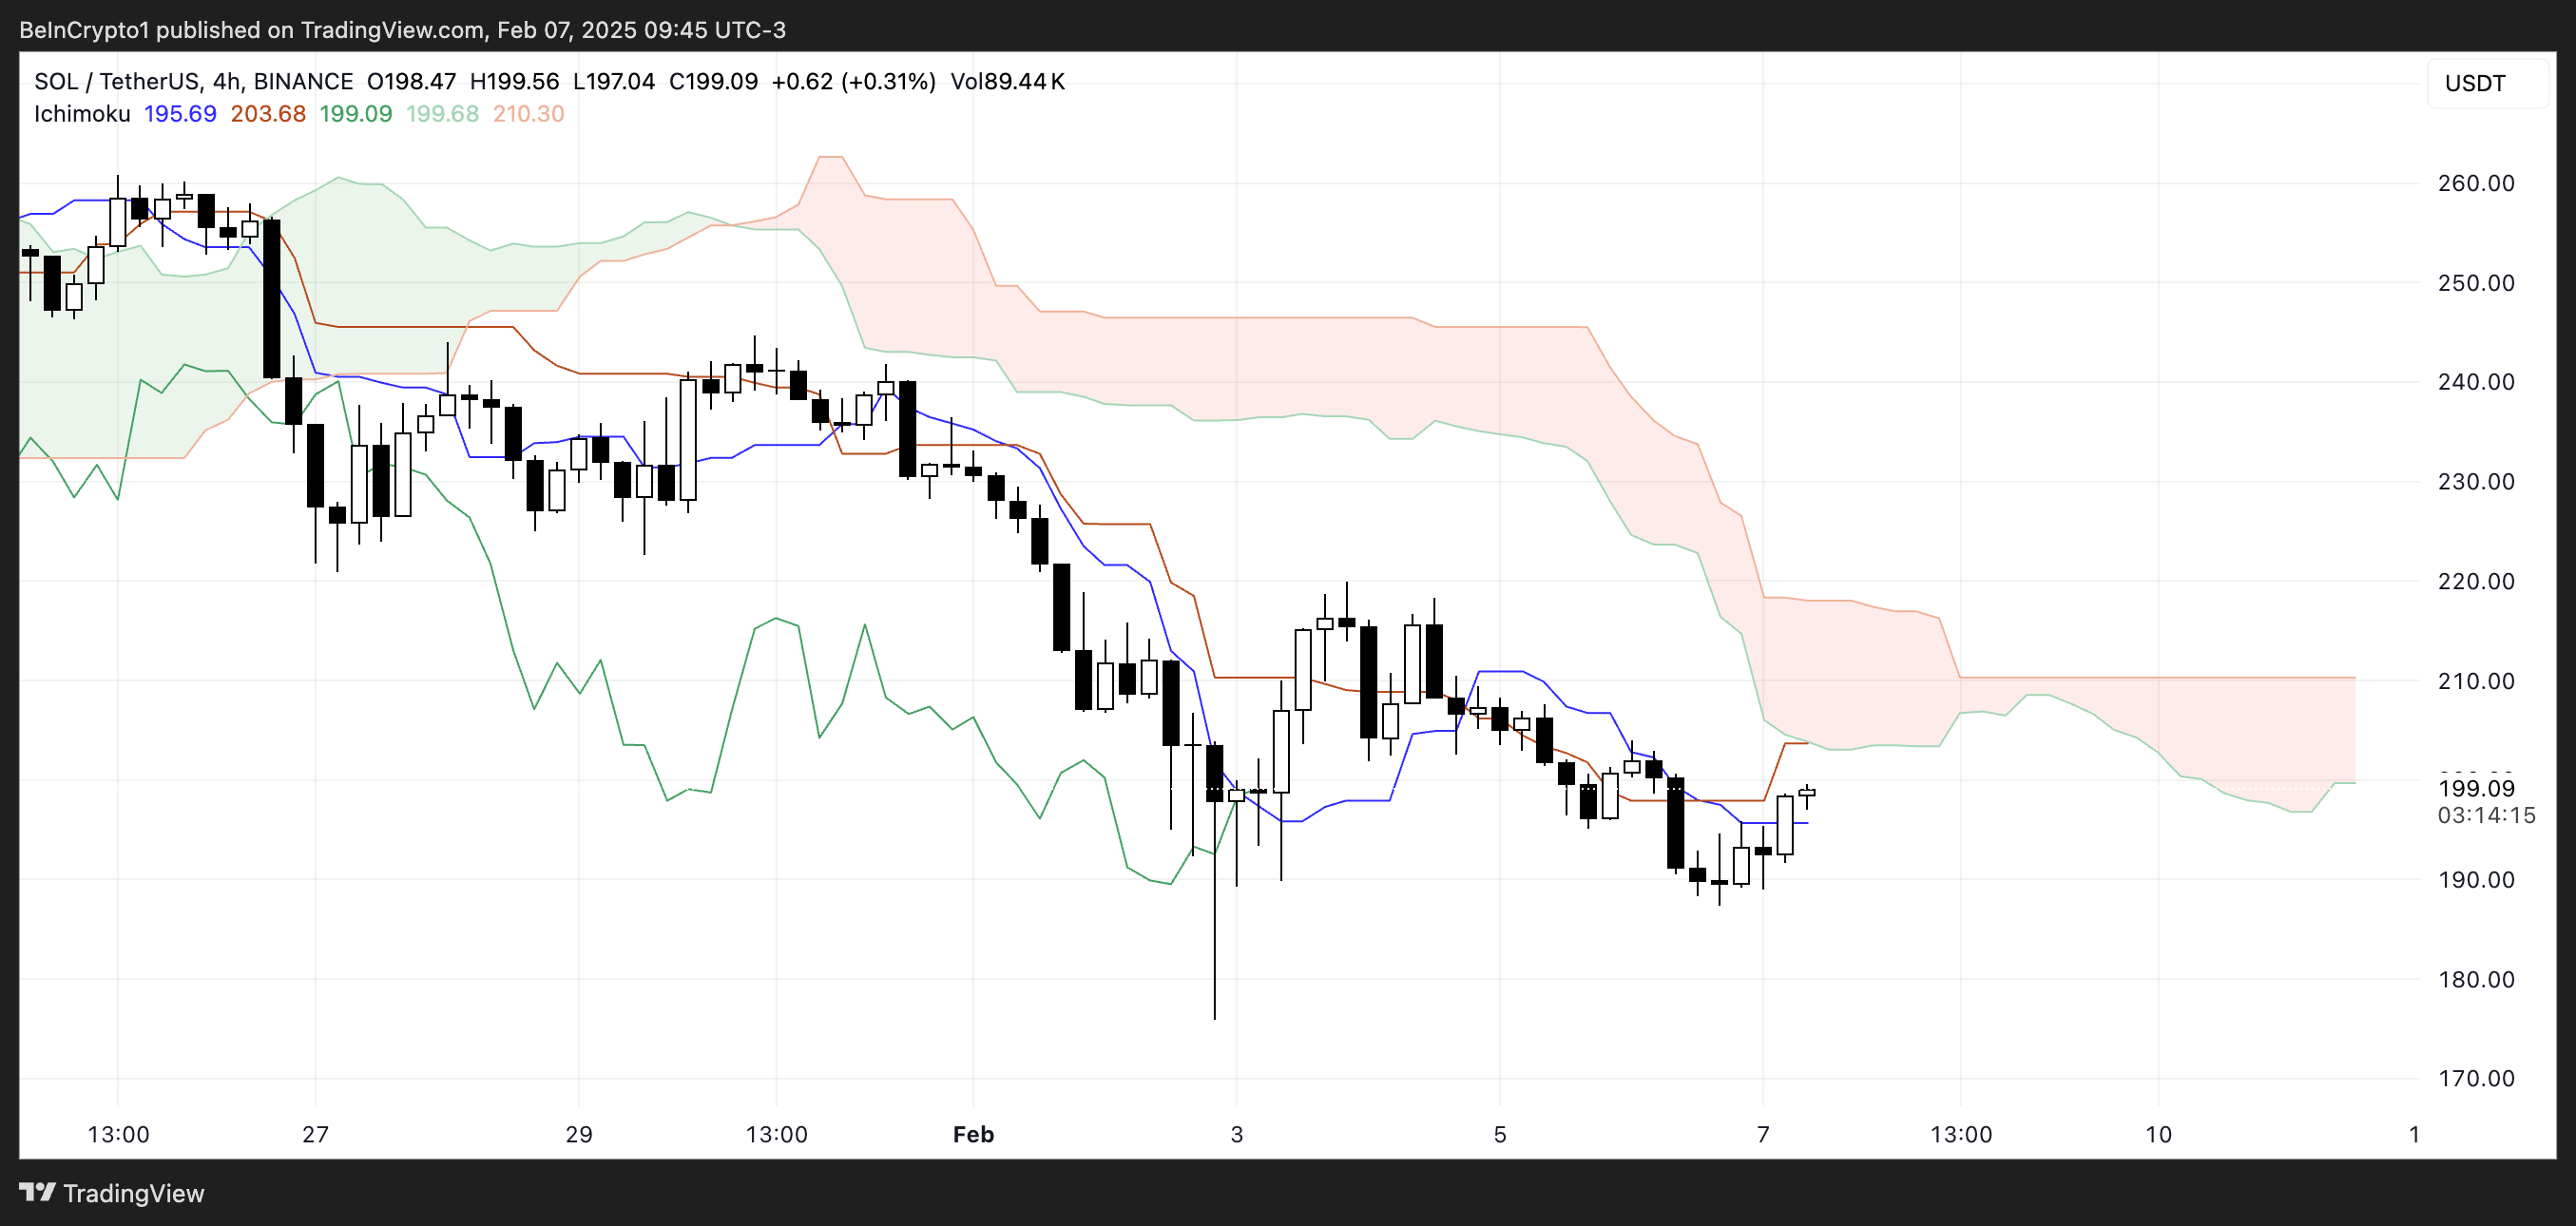
However, there are signs of potential stabilization, as SOL has recently attempted to push higher and is testing the Tenkan-sen. If the price can sustain momentum above this level, it may indicate an early shift in sentiment.
The Lagging Span (green line) is still below the price action, meaning that no clear bullish confirmation is present yet.
To establish a trend reversal, SOL would need to break above the cloud, which remains a key resistance zone. Until then, the prevailing Ichimoku structure suggests that the market is still in a corrective phase, with the cloud acting as a dynamic barrier to further upside movement.
Solana DMI Shows the Downtrend Could Be Easing
Solana Directional Movement Index (DMI) chart indicates that the Average Directional Index (ADX) is currently at 33.3 and has remained between 30 and 35 for the past four days. The ADX measures trend strength, with values above 25 generally indicating a strong trend and values below 20 suggesting weak or range-bound price action.
A reading between 30 and 35, as seen in SOL’s case, confirms that the ongoing trend – whether bullish or bearish – is holding firm.
However, the direction of the trend is determined by the movement of the +DI and -DI lines, which represent buying and selling pressure, respectively.
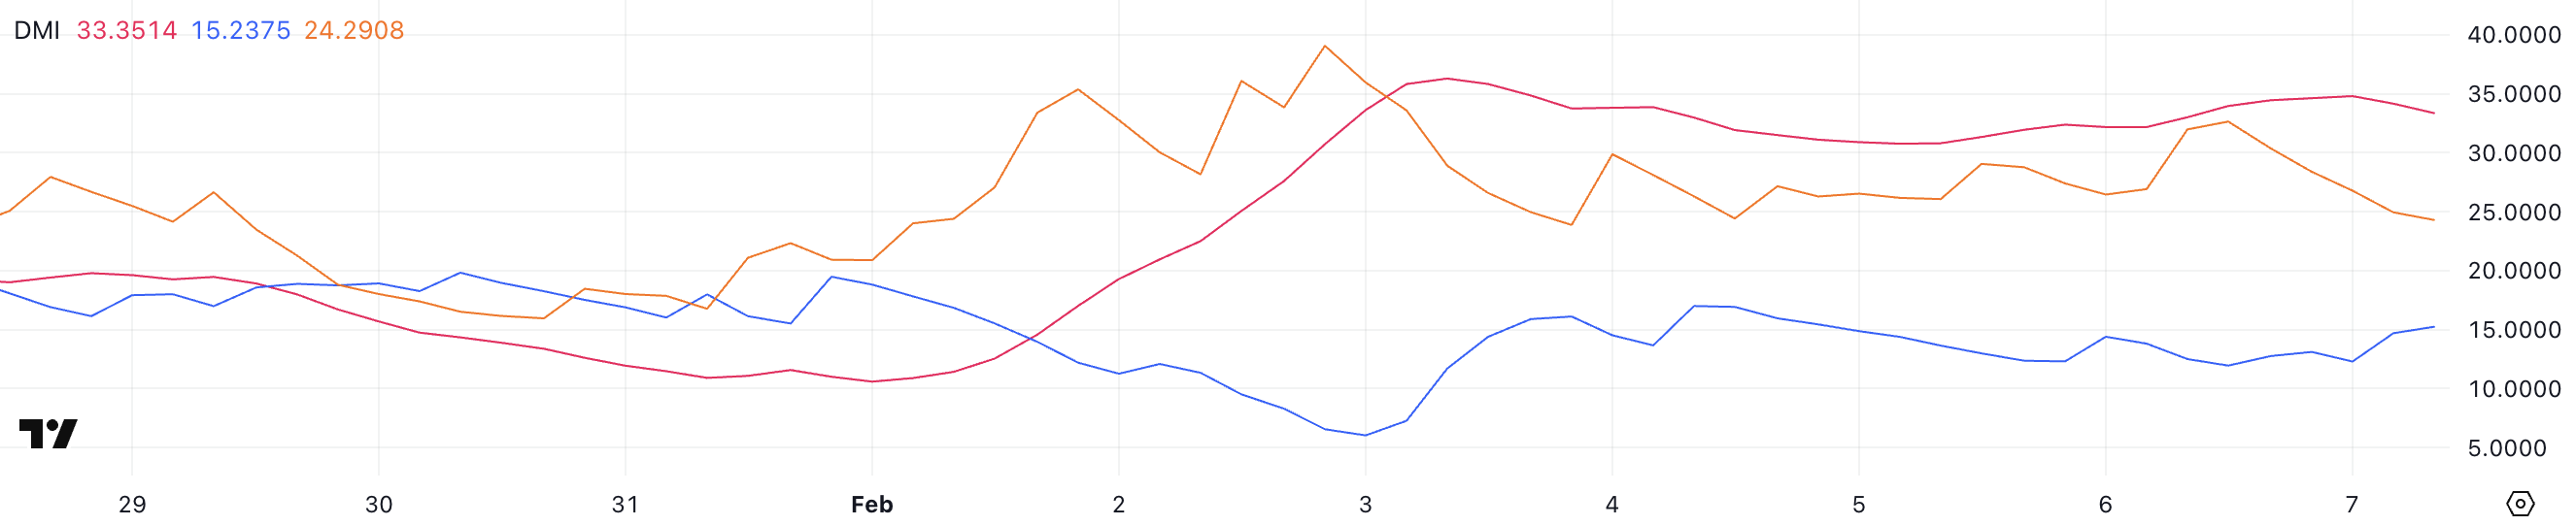
Currently, Solana +DI stands at 15.2 and has been stable around this level for the last three days, suggesting weak bullish momentum.
Meanwhile, -DI has dropped to 24.2 after being as high as 32.6 just a day ago, indicating that selling pressure is easing. While SOL remains in a downtrend, the declining -DI suggests that bearish momentum may be weakening.
If the +DI starts rising while -DI continues to drop, it could signal a potential trend reversal. However, as long as the ADX stays elevated and the -DI remains above the +DI, the downtrend remains dominant. SOL could still face further downside pressure before any meaningful recovery occurs.
SOL Price Prediction: Will Solana Break Above $220 Soon?
In recent days, Solana price has been hovering near the $200 level, consolidating within a tight range as market participants assess its next move.
If bullish momentum returns, SOL could test the $211 resistance level in the near term. A successful breakout above this zone could open the door for further gains, with $223 as the next key target.
Should buying pressure strengthen, SOL price could even rally toward $244, marking a potential 22% upside from current levels. However, for this scenario to play out, Solana needs sustained demand and a shift in momentum to overcome the recent bearish trend.
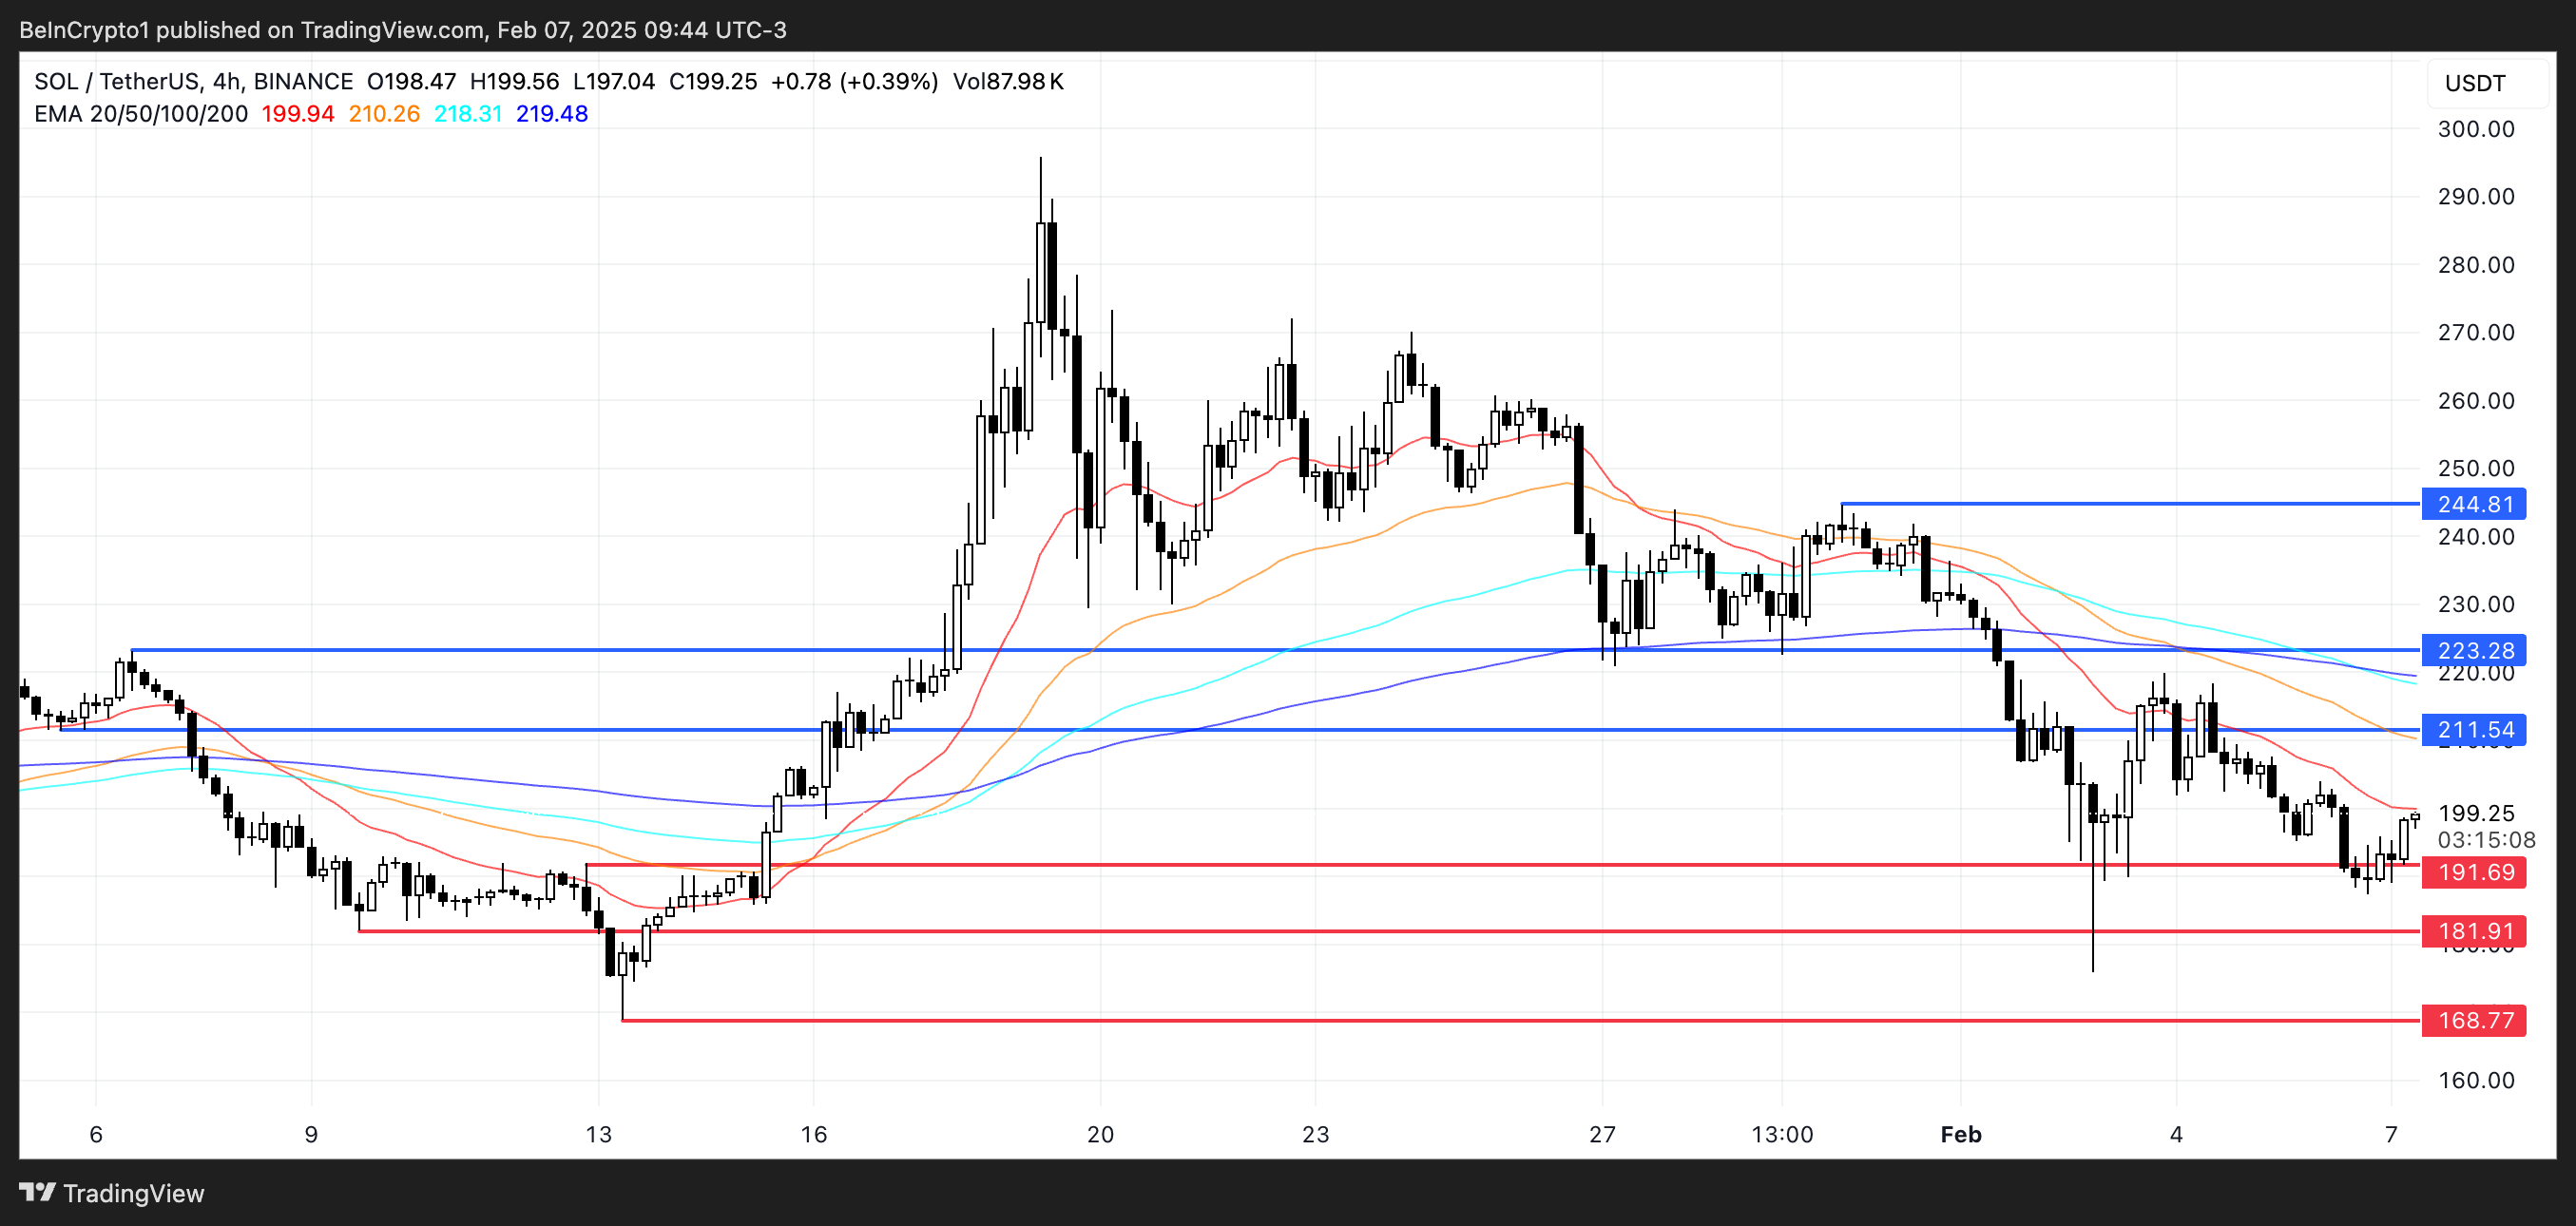
On the downside, if the current downtrend persists and selling pressure intensifies, SOL could soon retest the $191 support level.
A breakdown below this critical level may accelerate losses, potentially sending the price toward $181 or even as low as $168, representing a 15% further correction.
Disclaimer
In line with the Trust Project guidelines, this price analysis article is for informational purposes only and should not be considered financial or investment advice. BeInCrypto is committed to accurate, unbiased reporting, but market conditions are subject to change without notice. Always conduct your own research and consult with a professional before making any financial decisions. Please note that our Terms and Conditions, Privacy Policy, and Disclaimers have been updated.

BTC Touches $95K Low, Altcoins Show Mixed Actions

Nigeria’s EFCC Takes Down Crypto Crime Operation

Crypto Analyst Says Dogecoin Price Could Reach $20 This Cycle With Over 306x Surge
Top AI Coins To Watch In February: SNAI, VVV, VIRTUAL

SOL Price Drops 17% in a Week, Struggles Near $200

Tornado Cash Co-Founder Alexey Pertsev Released From Prison

2.52 Million Altcoins Are Ruining Crypto’s Future

Animoca Brands Valuation Tanks 75% In Two Years, Here’s Why

Crypto exchange BingX hacked for $43 million

Are The Big Players Losing Interest?

Hong Kong’s Securities Association Tips Authorities On Crypto Self-Regulation

Coinbase cbBTC Set to go Live on Solana
2.52 Million Altcoins Are Ruining Crypto’s Future
Animoca Brands Valuation Tanks 75% In Two Years, Here’s Why
Crypto exchange BingX hacked for $43 million
Are The Big Players Losing Interest?
Hong Kong’s Securities Association Tips Authorities On Crypto Self-Regulation
Coinbase cbBTC Set to go Live on Solana
-

 Ethereum11 hours ago
BlackRock ทุ่ม 280 ล้านดอลลาร์กว้านซื้อ Ethereum
-

 Market17 hours ago
Meme Coins to Altcoins with Real-World Value
-

 Market22 hours ago
XRP Price Weakens Gradually: Can It Find Support?
-

 Bitcoin21 hours ago
Utah Pushes Digital Asset Reserve Bill to Senate Approval
-

 Market21 hours ago
SEC Recognizes Grayscale’s Solana and Litecoin ETF Filings
-

 Market20 hours ago
BNB Price Poised to Rally—If It Can Overcome This Hurdle
-
 Altcoin20 hours ago
Can Fartcoin Price Rally To $1.4 Or A Crash To $0.35 Looms? Here’s All
-
 Altcoin18 hours ago
Berachain (BERA) Price Rockets 630% Amid Major Binance Support, What’s Next?