
Market
PEPE Price Crashes 50%; Death Cross and an Opportunity next

PEPE has suffered a sharp downturn, dropping nearly 50% over the past month and reaching its lowest price in three months. Investors have faced significant losses as bearish sentiment grips the meme coin market.
While the possibility of further correction remains, an emerging technical pattern could also signal a buying opportunity for long-term holders.
PEPE Is Facing a Bearish Cycle
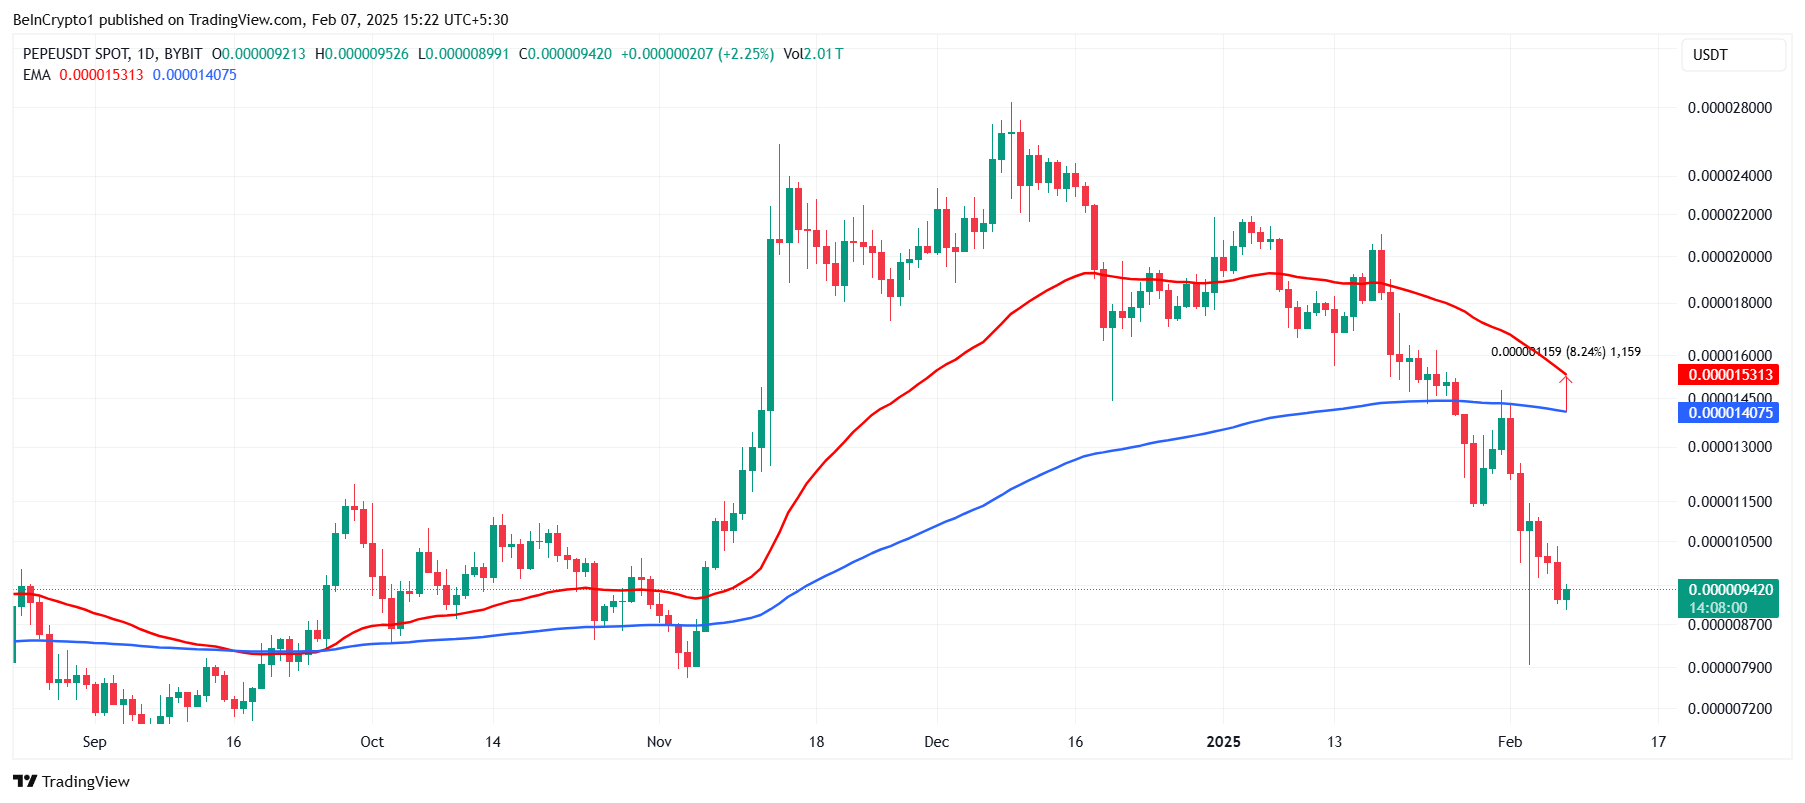
The exponential moving averages (EMAs) indicate growing bearish pressure, with the 200-day EMA approaching a crossover above the 50-day EMA. This event, known as a Death Cross, is typically a strong bearish signal.
If the crossover occurs, selling momentum could intensify, further dragging PEPE’s price lower.
Currently, the 200-day EMA is just 8% away from completing the Death Cross formation. If bearish conditions persist, PEPE could struggle to recover in the short term. This technical pattern often leads to extended downtrends across various assets.
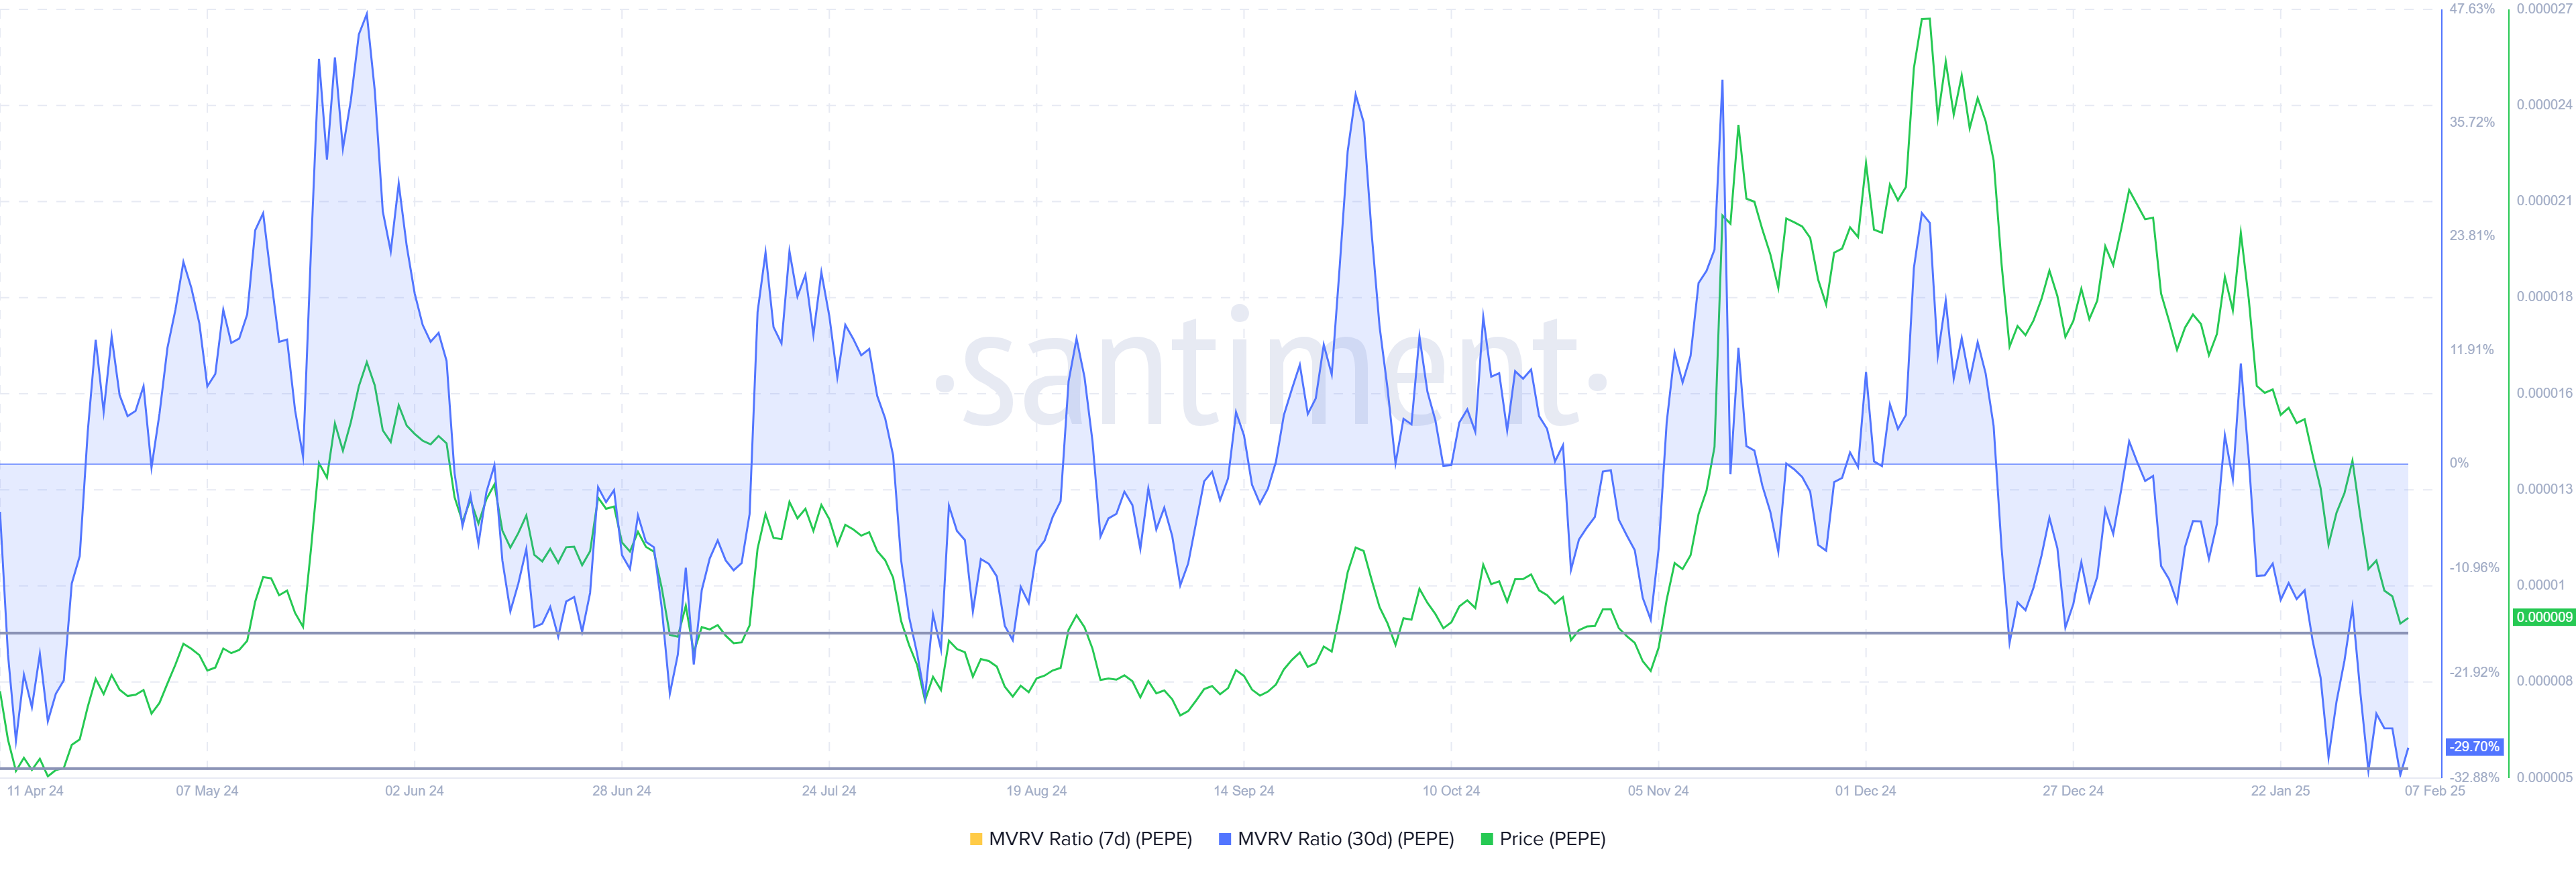
Despite bearish signals, PEPE’s Market Value to Realized Value (MVRV) ratio suggests a possible shift in momentum. The MVRV ratio has reached -29%, placing PEPE within the “Opportunity Zone.”
Historically, when this metric drops between -17% and -30%, it indicates that selling pressure is nearing exhaustion.
A negative MVRV ratio suggests investors are holding unrealized losses, making them less likely to sell further. This can create an accumulation period where long-term holders start buying at discounted prices.
If this trend follows previous patterns, PEPE price could be setting up for a potential recovery.
PEPE Price Prediction: Recovering The Losses
PEPE is currently trading at $0.00000941, slipping below the critical support level of $0.00001000. This marks a three-month low for the meme coin, making it one of the worst-performing assets of the month. The sustained selling pressure has made it difficult for PEPE to regain upward momentum.
The looming Death Cross raises concerns about further declines, potentially pushing PEPE below the $0.00000839 support level. A drop below this threshold would likely trigger additional selling, worsening investor losses.
If bearish momentum remains dominant, PEPE could see prolonged consolidation at lower price levels.
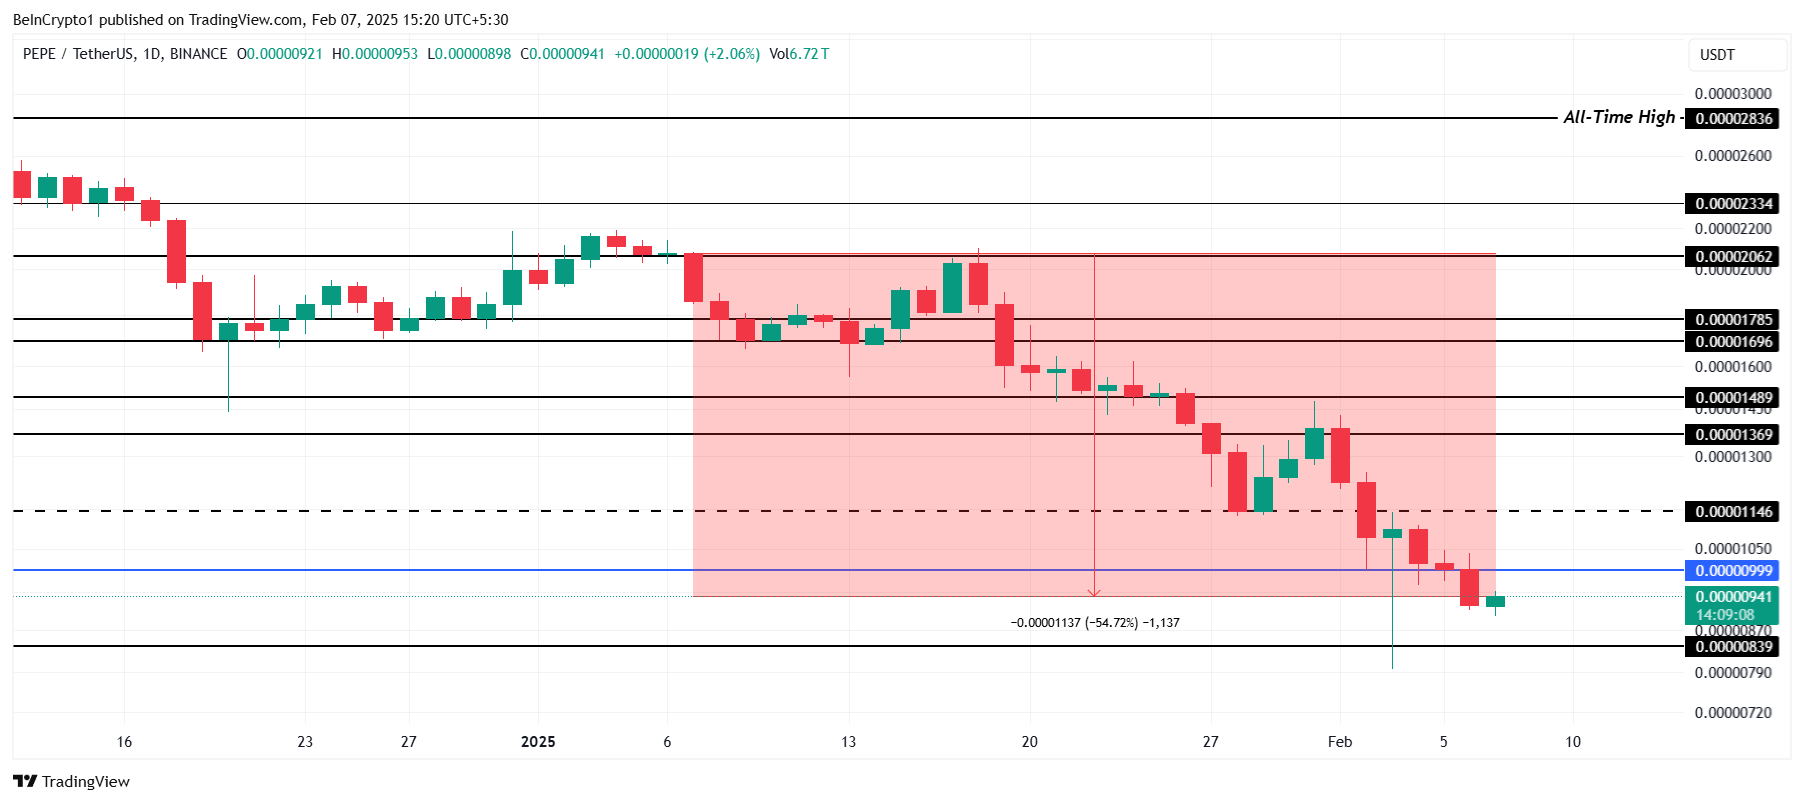
However, a reversal remains possible if PEPE can reclaim $0.00001000 as support. If the meme coin flips $0.00001146 into support, it would invalidate the bearish outlook and shift momentum toward recovery.
Disclaimer
In line with the Trust Project guidelines, this price analysis article is for informational purposes only and should not be considered financial or investment advice. BeInCrypto is committed to accurate, unbiased reporting, but market conditions are subject to change without notice. Always conduct your own research and consult with a professional before making any financial decisions. Please note that our Terms and Conditions, Privacy Policy, and Disclaimers have been updated.


Solana (SOL) price has seen strong corrections over the past week, dropping 17% and falling below the $100 billion market cap. The Ichimoku Cloud chart indicates that bearish momentum remains dominant, with SOL trading below key trend indicators and reflecting downside pressure.
Meanwhile, the Directional Movement Index (DMI) suggests that the strength of the current downtrend is still intact, though selling pressure appears to be weakening. With technical indicators showing mixed signals, SOL’s next move will depend on whether it can regain momentum or continue its decline toward lower support levels.
SOL Ichimoku Cloud Show the Bearish Momentum Is Still Here
The Ichimoku Cloud chart for Solana shows a predominantly bearish setup. The price is trading below the cloud, and the cloud itself is shaded red, indicating continued downside pressure.
The Kijun-sen (red line) remains above the price, reinforcing the bearish bias, while the Tenkan-sen (blue line) is also positioned below the cloud, suggesting that short-term momentum is still weak.
Additionally, the Senkou Span A (green cloud boundary) is trending below Senkou Span B (red cloud boundary), signaling that the broader trend remains downward. The fact that the price is below both the conversion and base lines further confirms that bears are in control.
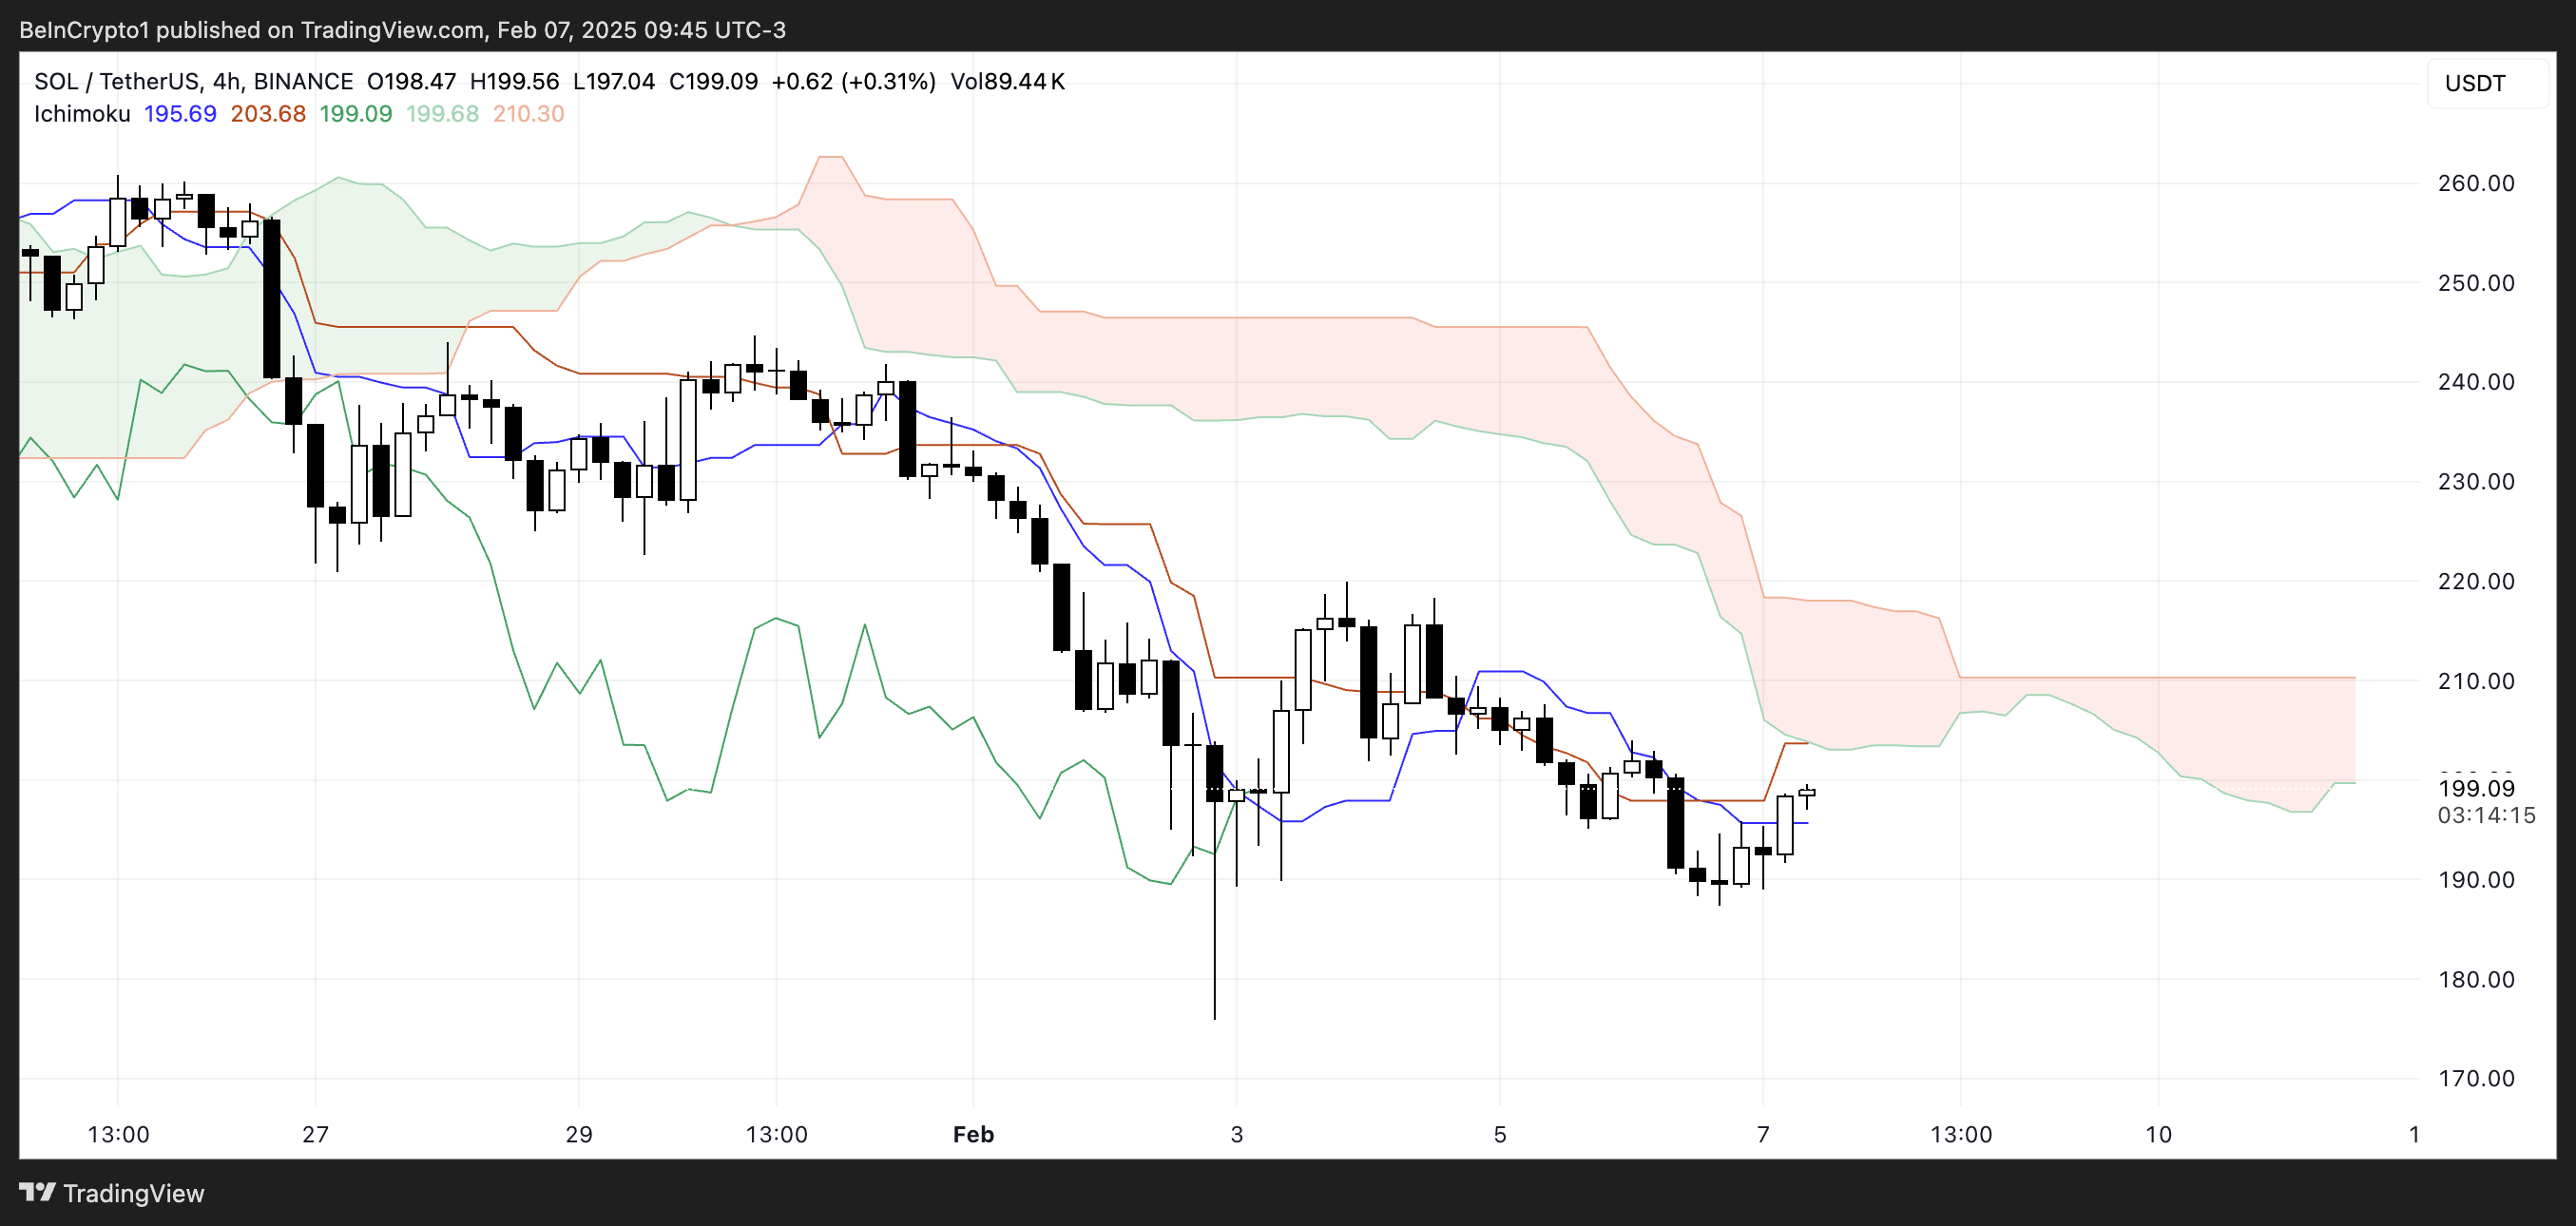
However, there are signs of potential stabilization, as SOL has recently attempted to push higher and is testing the Tenkan-sen. If the price can sustain momentum above this level, it may indicate an early shift in sentiment.
The Lagging Span (green line) is still below the price action, meaning that no clear bullish confirmation is present yet.
To establish a trend reversal, SOL would need to break above the cloud, which remains a key resistance zone. Until then, the prevailing Ichimoku structure suggests that the market is still in a corrective phase, with the cloud acting as a dynamic barrier to further upside movement.
Solana DMI Shows the Downtrend Could Be Easing
Solana Directional Movement Index (DMI) chart indicates that the Average Directional Index (ADX) is currently at 33.3 and has remained between 30 and 35 for the past four days. The ADX measures trend strength, with values above 25 generally indicating a strong trend and values below 20 suggesting weak or range-bound price action.
A reading between 30 and 35, as seen in SOL’s case, confirms that the ongoing trend – whether bullish or bearish – is holding firm.
However, the direction of the trend is determined by the movement of the +DI and -DI lines, which represent buying and selling pressure, respectively.
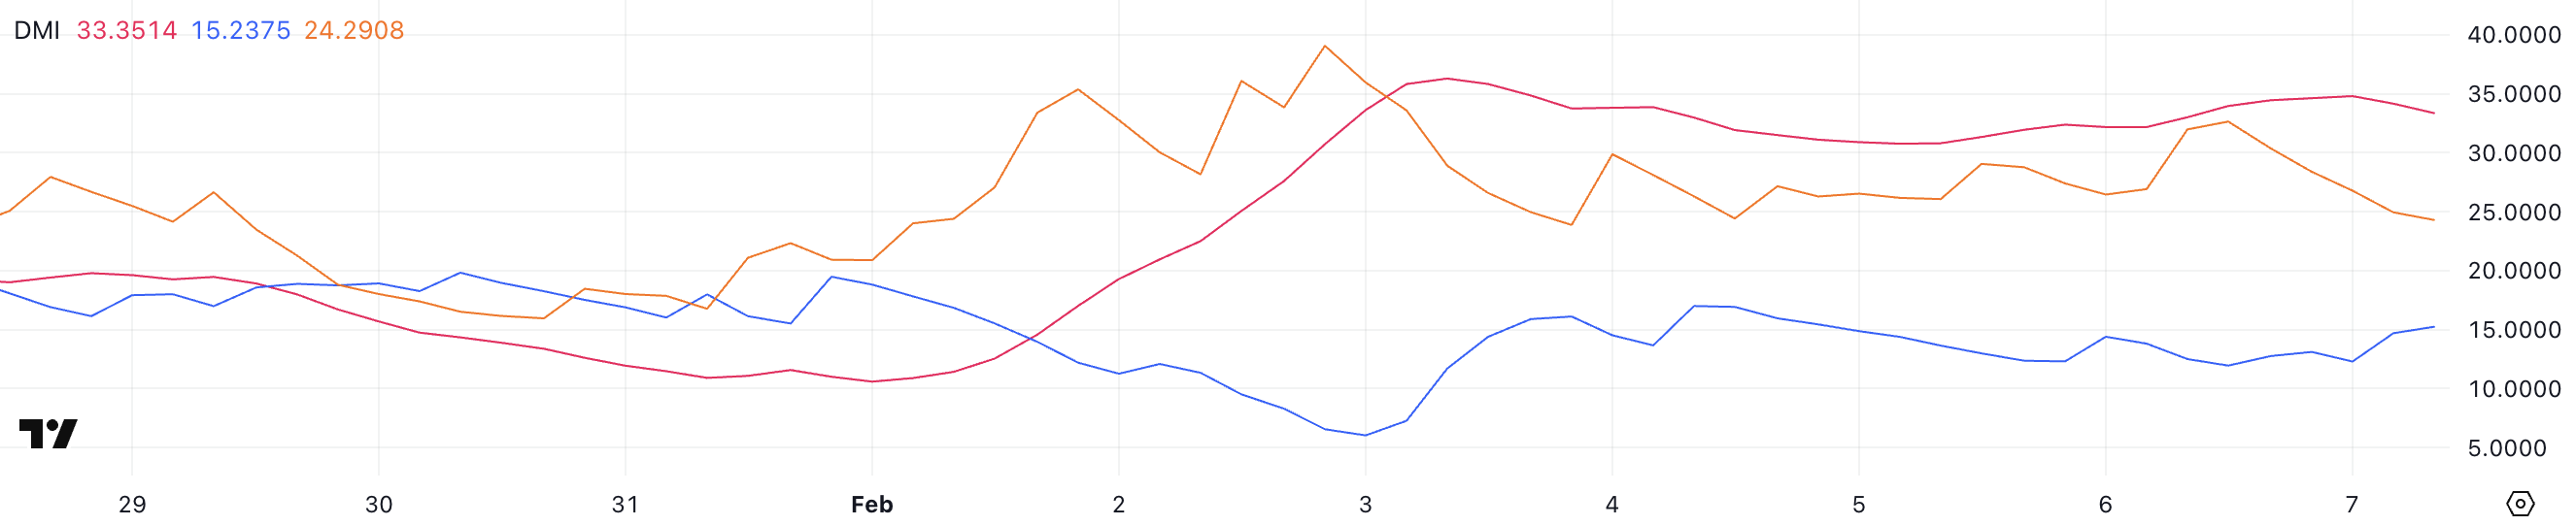
Currently, Solana +DI stands at 15.2 and has been stable around this level for the last three days, suggesting weak bullish momentum.
Meanwhile, -DI has dropped to 24.2 after being as high as 32.6 just a day ago, indicating that selling pressure is easing. While SOL remains in a downtrend, the declining -DI suggests that bearish momentum may be weakening.
If the +DI starts rising while -DI continues to drop, it could signal a potential trend reversal. However, as long as the ADX stays elevated and the -DI remains above the +DI, the downtrend remains dominant. SOL could still face further downside pressure before any meaningful recovery occurs.
SOL Price Prediction: Will Solana Break Above $220 Soon?
In recent days, Solana price has been hovering near the $200 level, consolidating within a tight range as market participants assess its next move.
If bullish momentum returns, SOL could test the $211 resistance level in the near term. A successful breakout above this zone could open the door for further gains, with $223 as the next key target.
Should buying pressure strengthen, SOL price could even rally toward $244, marking a potential 22% upside from current levels. However, for this scenario to play out, Solana needs sustained demand and a shift in momentum to overcome the recent bearish trend.
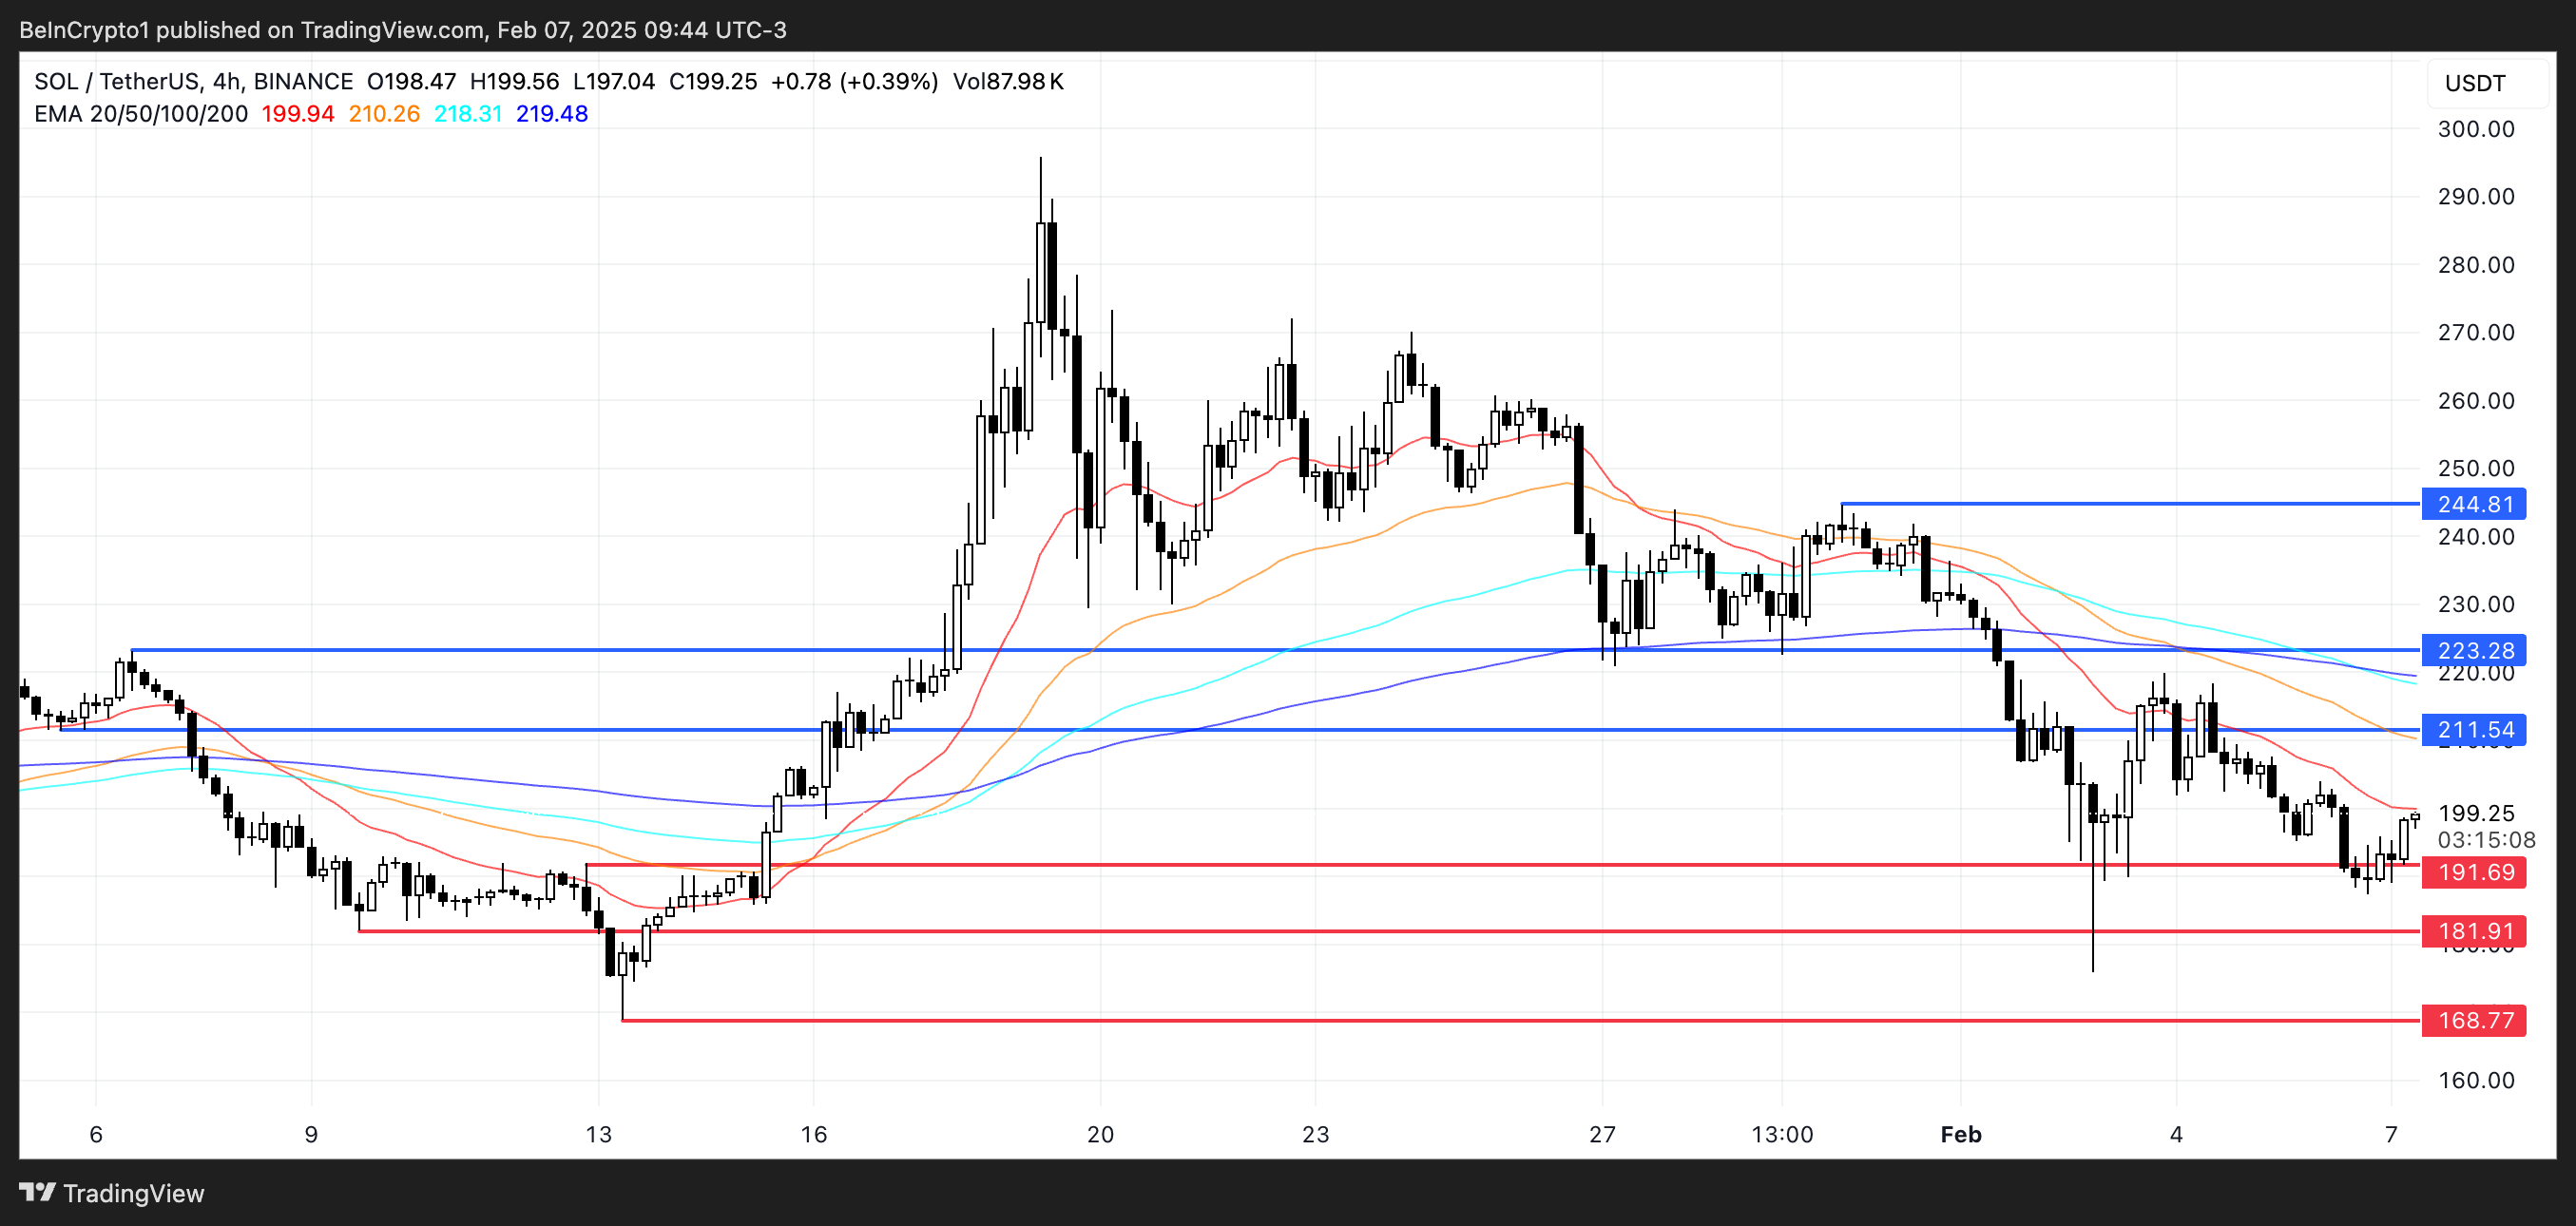
On the downside, if the current downtrend persists and selling pressure intensifies, SOL could soon retest the $191 support level.
A breakdown below this critical level may accelerate losses, potentially sending the price toward $181 or even as low as $168, representing a 15% further correction.
Disclaimer
In line with the Trust Project guidelines, this price analysis article is for informational purposes only and should not be considered financial or investment advice. BeInCrypto is committed to accurate, unbiased reporting, but market conditions are subject to change without notice. Always conduct your own research and consult with a professional before making any financial decisions. Please note that our Terms and Conditions, Privacy Policy, and Disclaimers have been updated.

Nearly nine months after his conviction, Tornado Cash co-founder Alexey Pertsev was released from Dutch prison today. He will remain under house arrest until his appeal is fully processed.
Although US sanctions against Tornado Cash were recently lifted, these wins are only a small bright spot in a long case. Criminal activity on the platform increased last year, which may hurt Pertsev in the appeals process.
Tornado Cash’s Pertsev Takes a Small Win
Alexey Pertsev, co-founder of cryptocurrency tumbler Tornado Cash, has been through quite an ordeal. Pertsev was convicted of money laundering last May in a controversial ruling for the crypto space.
Pertsev maintained an open-source platform that criminals used, which led to his arrest despite the lack of any direct involvement. However, he was released today.
“Freedom is priceless, but my freedom cost a lot of money. My house arrest was only possible thanks to the work of lawyers, who were paid from your donations. My fight is not over yet, and for a final and confident victory, I still need your help,” Pertsev claimed via social media.
Pertsev’s struggle and the Tornado Cash case have won support from the community. Paradigm pledged $1.25 million for co-founder Roman Storm’s own legal battle, and Vitalik Buterin also donated to the project’s developers.
Pertsev is still under house arrest pending an appeal, and he’s been seeking donations for his legal fund since August.
“I would like to thank everyone, especially Vitalik Buterin and Stefan George, for your incredible generosity to my defense. Your support inspires me to move forward, and I’m forever grateful. While the legal battle is far from over, I’m hopeful 2025 brings positive developments,” Pertsev wrote.
However, Pertsev’s release is just one piece of recent good news for Tornado Cash. Although US lawmakers banned the platform back in 2022, an appeals court overturned the sanctions last November.
Another District Court upheld this ruling in January, causing its TORN token to surge in value.
Still, Tornado Cash has its opponents, and Pertsev may face an uphill battle if he wants to remain free. Last year, the platform saw a resurgence in criminal activity as hackers used it to launder $50 million in one month.
For now, Pertsev can return to his home, and Tornado Cash has seen a slight reprieve from economic sanctions. Regardless of how well his appeal goes from here, developments like this can inspire hope and endurance when the community approaches a long fight.
Disclaimer
In adherence to the Trust Project guidelines, BeInCrypto is committed to unbiased, transparent reporting. This news article aims to provide accurate, timely information. However, readers are advised to verify facts independently and consult with a professional before making any decisions based on this content. Please note that our Terms and Conditions, Privacy Policy, and Disclaimers have been updated.

XRP price has dropped 22% in the past week, with technical indicators showing both bearish pressure and signs of potential stabilization. The RSI remains neutral after a sharp rebound from oversold levels earlier this month, while the number of whales has stabilized after a brief surge.
Meanwhile, XRP’s Exponential Moving Averages (EMAs) have formed a bearish death cross, suggesting that downside risks remain unless a reversal takes shape. Adding to the broader market narrative, XRP ETFs are now eyeing SEC approval following Cboe’s 19b-4 filing, which could play a key role in shaping future price action.
XRP RSI Is Still Neutral, Following The Same Pattern Since February 3
XRP Relative Strength Index (RSI) has surged from 35.2 to 44.6 in just a few hours, reflecting a shift in momentum after recent weakness. This increase suggests growing buying interest, though XRP remains within a neutral range.
RSI is a widely used momentum indicator that oscillates between 0 and 100. It helps traders gauge whether an asset is overbought or oversold.
Typically, an RSI above 70 indicates overbought conditions, where prices may be due for a correction, while an RSI below 30 signals oversold territory, often a potential buying opportunity. Values between 30 and 70 are considered neutral, meaning the market is neither in a strong bullish nor bearish phase.
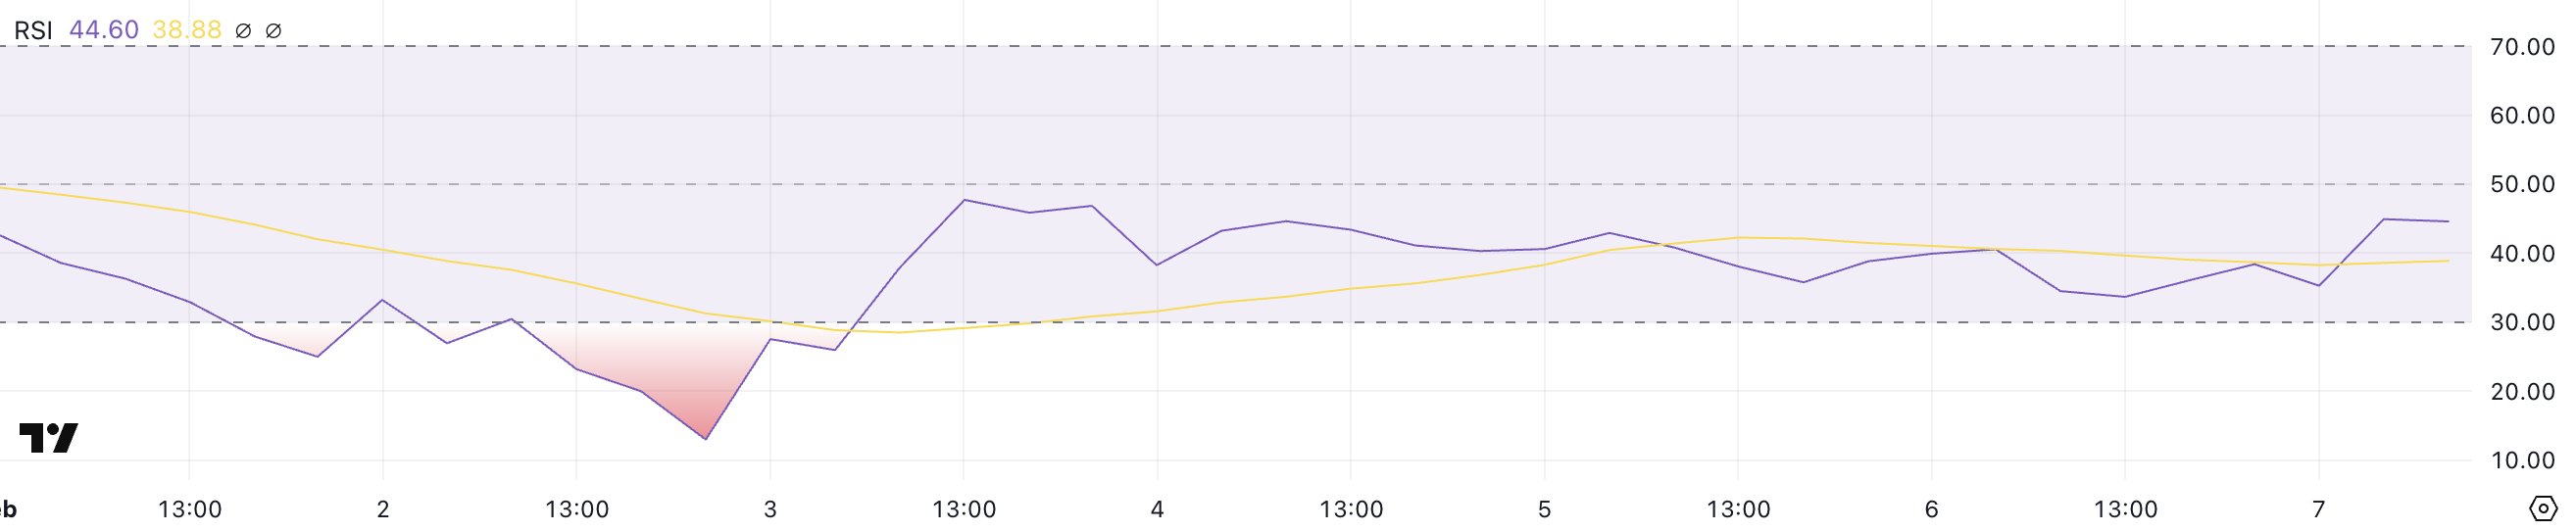
Since February 3, XRP RSI has remained in neutral territory after hitting extreme lows of around 13 on February 2. This rebound suggests that the intense selling pressure that drove XRP to oversold levels has subsided, allowing price stabilization.
With the RSI now at 44.6, momentum is gradually shifting toward the upper end of the neutral range.
While this is not yet a clear bullish signal, it indicates increasing demand, which could lead to XRP testing resistance levels if buying pressure continues. A sustained push above 50 would be a stronger confirmation of bullish momentum, potentially opening the door for further upside in price action.
XRP Whales Are Slowly Declining After Surging 6 Days Ago
The number of XRP whales – addresses holding between 1,000,000 and 10,000,000 XRP – currently stands at 2,130. This figure surged from 2,081 to 2,136 between February 1 and February 2, indicating a sharp accumulation phase before slowly declining.
Tracking these large holders is crucial as they often have the ability to influence market trends due to the sheer volume of XRP they control.
When whale activity increases, it can signal growing confidence among high-net-worth investors, while a decline may indicate profit-taking or a shift in sentiment.
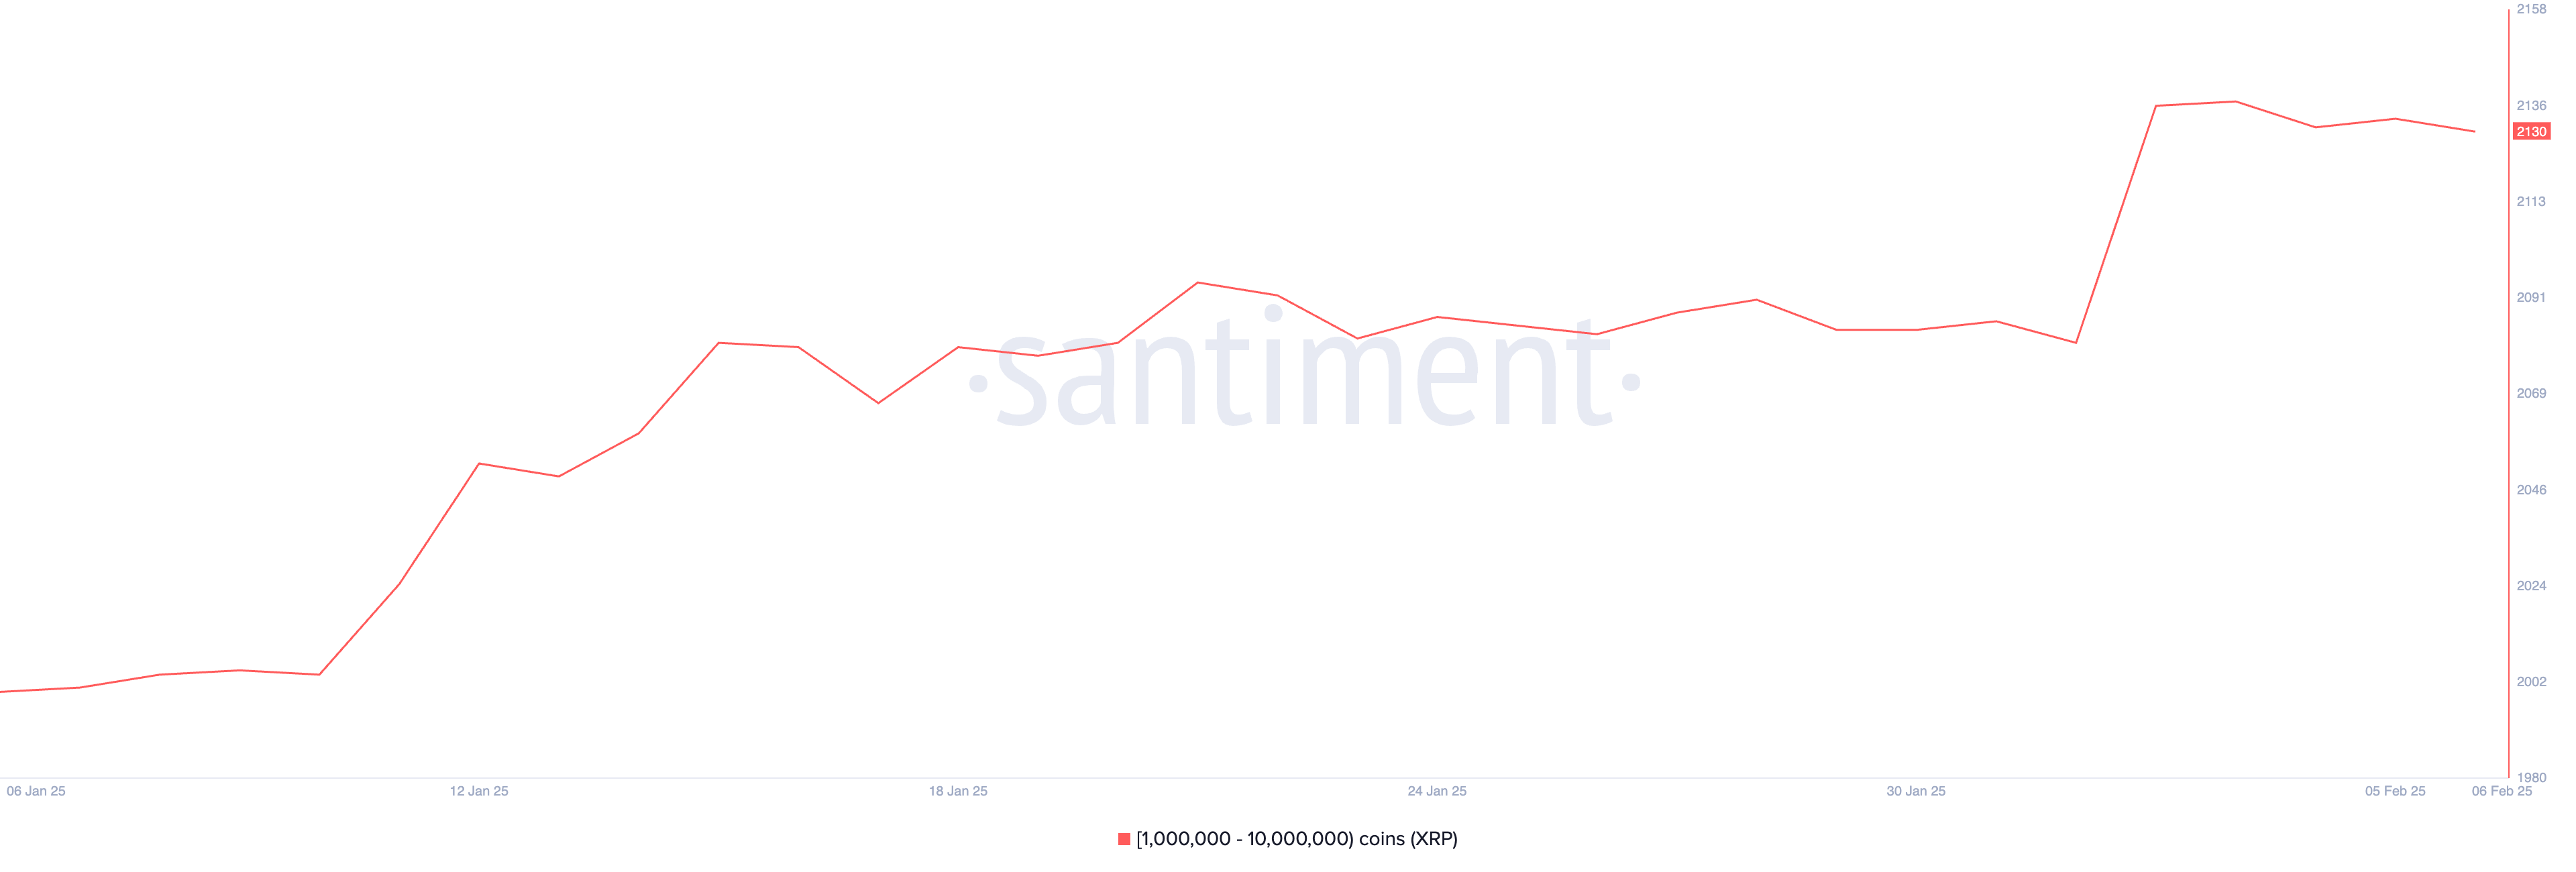
With the current number of XRP whales stabilizing at 2,130 after a brief surge, the market appears to be in a consolidation phase. If the number of whales continues to drop, it could suggest that some large holders are offloading their positions, potentially leading to short-term price weakness.
However, if the decline stabilizes or reverses into another accumulation phase, it could indicate renewed confidence in XRP’s prospects. A sustained increase in whale addresses would be a bullish signal.
This suggests that institutional or large-scale investors see long-term value in XRP and are positioned for potential future upside.
XRP Price Prediction: Will XRP Trade Above $3 In February?
XRP’s Exponential Moving Average (EMA) lines indicate a bearish setup, as a new death cross formed two days ago. This occurs when short-term EMAs cross below long-term EMAs, signaling sustained downward momentum.
Over the past seven days, XRP price has declined by 22%, reinforcing the negative sentiment.
If the bearish trend persists, key support levels to watch are at $2.32, with further downside potential to $2.20 and even $1.99 if selling pressure intensifies.
The continued positioning of short-term EMAs below long-term EMAs suggests that bears still have control, and a failure to hold critical support levels could lead to further downside exploration.
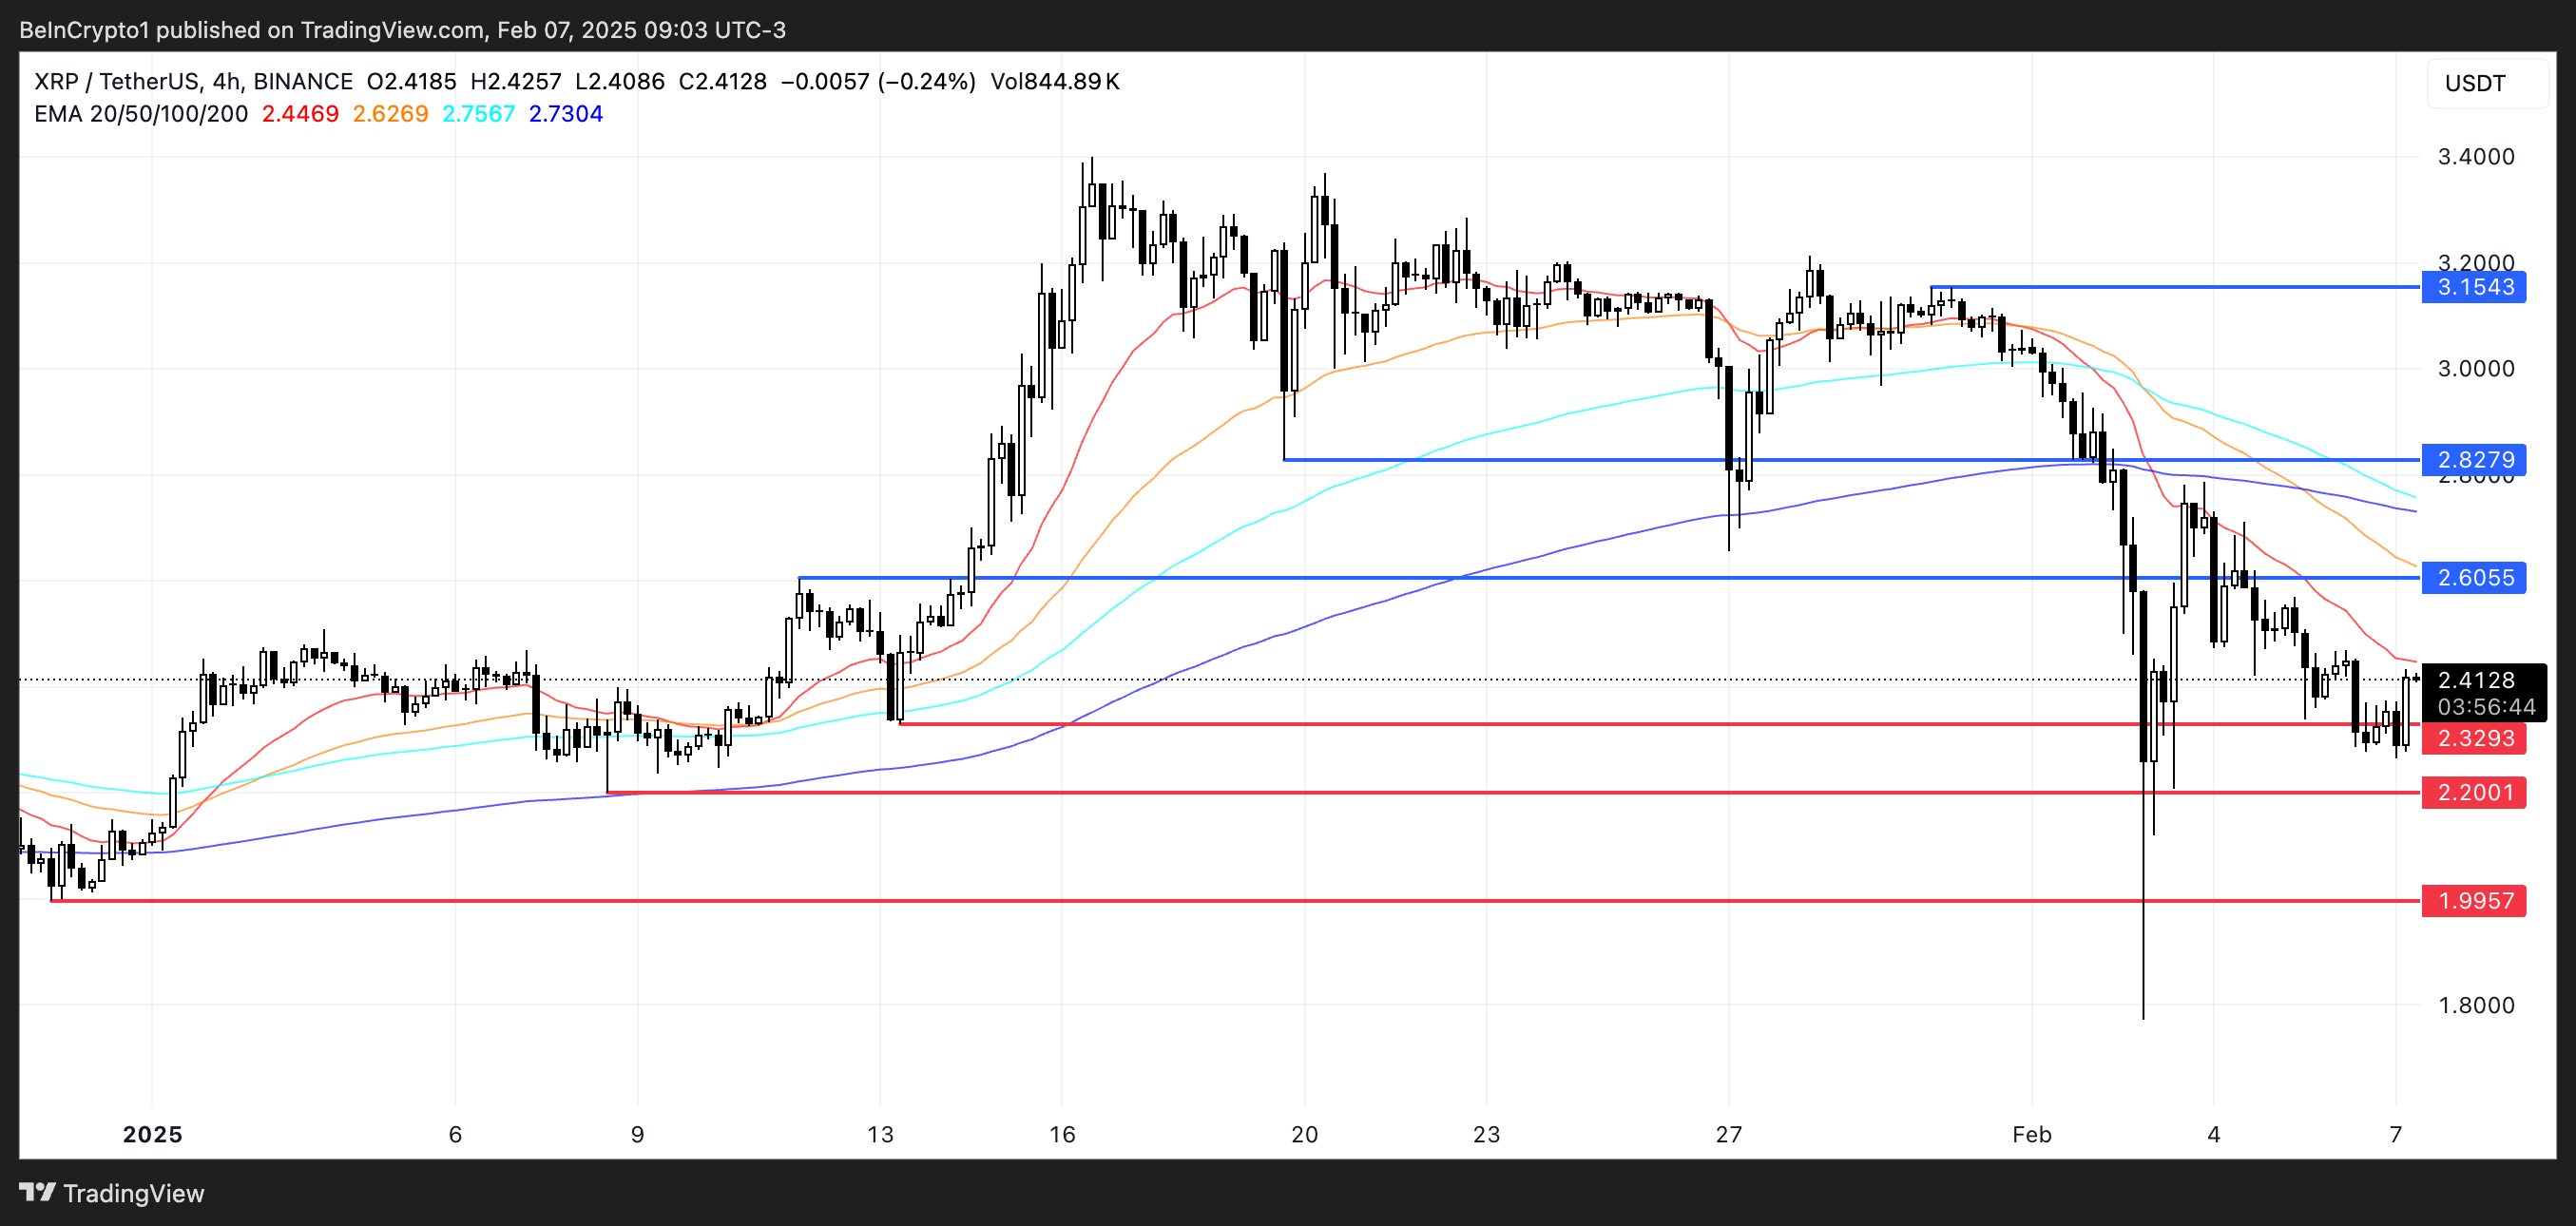
However, a trend reversal could shift momentum in XRP’s favor, with the first resistance level at $2.60. If buyers regain strength and push XRP beyond this mark, the next targets lie at $2.82 and potentially above $3.
Should XRP price recover the bullish momentum seen in previous months, potentially driven by the SEC’s approval of the XRP ETF, it could extend gains toward $3.15, a level that would indicate renewed confidence in its uptrend.
Disclaimer
In line with the Trust Project guidelines, this price analysis article is for informational purposes only and should not be considered financial or investment advice. BeInCrypto is committed to accurate, unbiased reporting, but market conditions are subject to change without notice. Always conduct your own research and consult with a professional before making any financial decisions. Please note that our Terms and Conditions, Privacy Policy, and Disclaimers have been updated.

SOL Price Drops 17% in a Week, Struggles Near $200

Tornado Cash Co-Founder Alexey Pertsev Released From Prison

XRP Price Holds Steady as Whale Activity Declines

Ethereum Is Consolidating After The Flush Last Weekend – The Calm Before A Big Move?

Ripple Vs. SEC Lawsuit: XRP Price Balks At The Latest Developments

ETH Price Stuck Below $3,000 as Bearish Pressure Persists

2.52 Million Altcoins Are Ruining Crypto’s Future

Animoca Brands Valuation Tanks 75% In Two Years, Here’s Why

Crypto exchange BingX hacked for $43 million

Are The Big Players Losing Interest?

Hong Kong’s Securities Association Tips Authorities On Crypto Self-Regulation

Coinbase cbBTC Set to go Live on Solana
2.52 Million Altcoins Are Ruining Crypto’s Future
Animoca Brands Valuation Tanks 75% In Two Years, Here’s Why
Crypto exchange BingX hacked for $43 million
Are The Big Players Losing Interest?
Hong Kong’s Securities Association Tips Authorities On Crypto Self-Regulation
Coinbase cbBTC Set to go Live on Solana
-

 Market20 hours ago
XRP Price Weakens Gradually: Can It Find Support?
-
 Altcoin18 hours ago
Can Fartcoin Price Rally To $1.4 Or A Crash To $0.35 Looms? Here’s All
-
 Altcoin16 hours ago
Berachain (BERA) Price Rockets 630% Amid Major Binance Support, What’s Next?
-

 Market15 hours ago
Meme Coins to Altcoins with Real-World Value
-

 Ethereum9 hours ago
BlackRock ทุ่ม 280 ล้านดอลลาร์กว้านซื้อ Ethereum
-

 Market14 hours ago
Bitcoin Price Attempts a Comeback: Can the Recovery Hold?
-
 Altcoin20 hours ago
When Will Altcoins Selling Stop? Is This Final Dump Before Pump?
-

 Bitcoin19 hours ago
Utah Pushes Digital Asset Reserve Bill to Senate Approval