
Market
DOGE, SPX, FARTCOIN Face 58% Crash

Meme coins took a hit this week as bearish market conditions dragged even Bitcoin down to $95,700. With altcoins extending their downtrend, investor losses continued to mount.
BeInCrypto analyzed three meme coins that once stood out as top performers but are now undergoing significant corrections.
Dogecoin (DOGE)
Dogecoin, the largest meme coin, experienced a sharp 25% decline this week, reaching a two-and-a-half-month low of $0.248. The price fell through the critical support of $0.268, signaling increased bearish pressure. With investor sentiment weakening, DOGE faces the risk of extended downside unless buyers step in.
The next key support for Dogecoin is at $0.220, a level that could determine its short-term trajectory. If the price reaches this support, investors may begin selling off their holdings to minimize losses.
Increased liquidation pressure could push DOGE lower, further extending its downtrend and amplifying market-wide concerns.
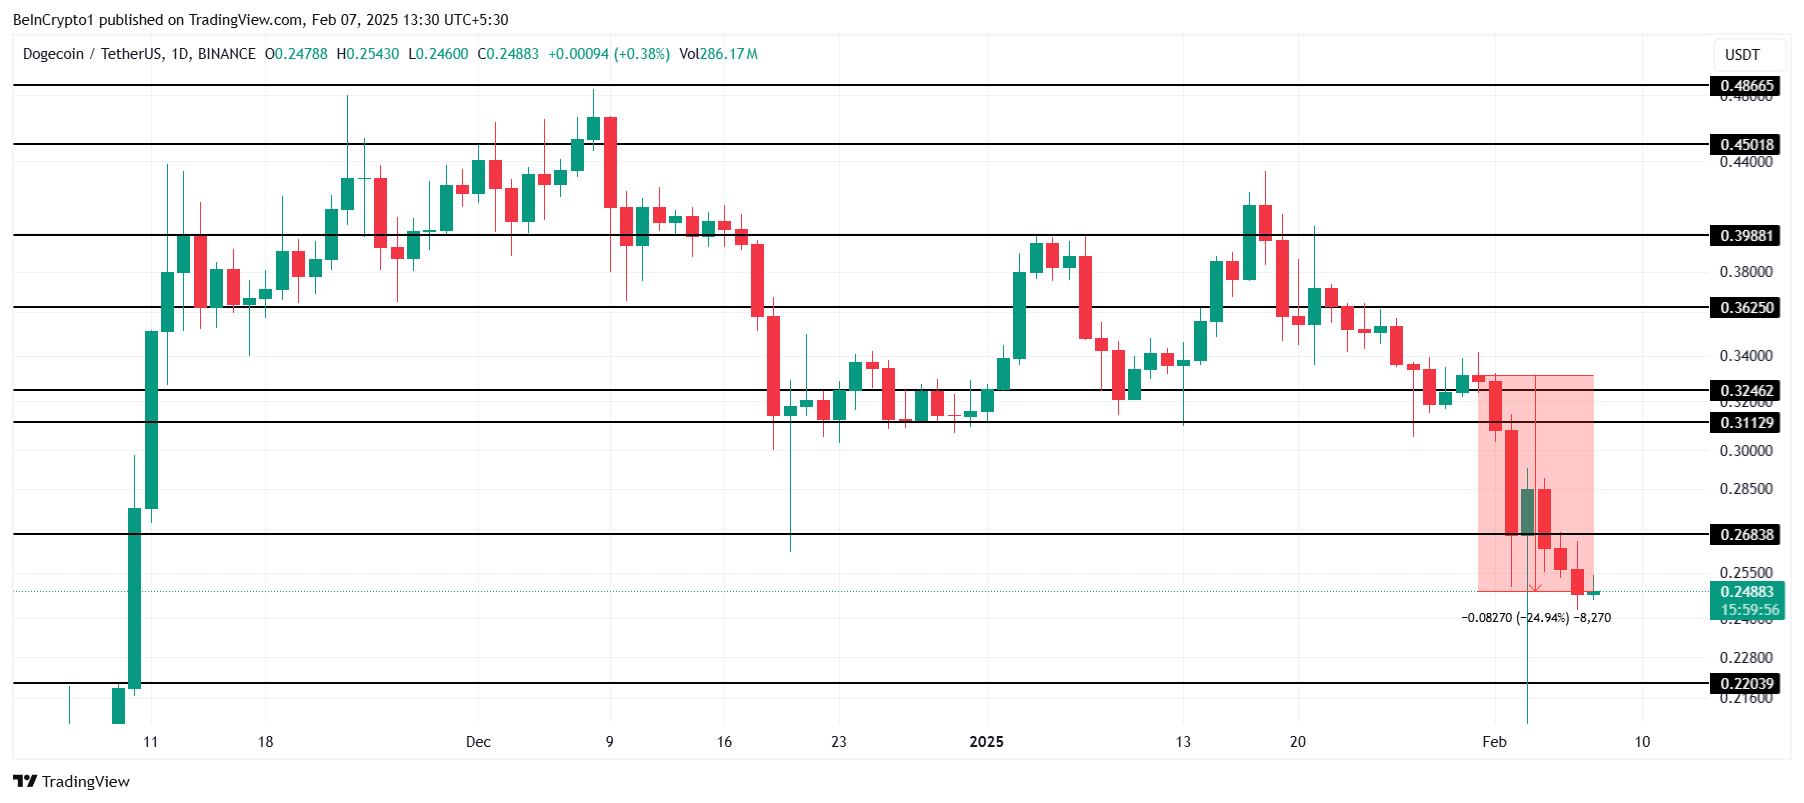
A reversal remains possible if Dogecoin manages to reclaim the $0.268 support level. Flipping this resistance into support could fuel a recovery, allowing DOGE to aim for $0.311 and beyond. This would invalidate the bearish outlook and restore investor confidence.
SPX6900 (SPX)
SPX suffered a significant correction, declining 50% over the past week to trade at $0.642 at the time of writing. The steep drop has put the meme coin under intense selling pressure, raising concerns among investors. Despite the decline, SPX continues to hold above a key support level.
Currently maintaining support at $0.568, SPX remains vulnerable to consolidation within a narrow range. Historically, the meme coin has struggled to break above $0.759, delaying any meaningful recovery. If price action remains subdued, SPX could continue fluctuating between these levels, making a strong rebound less likely in the short term.
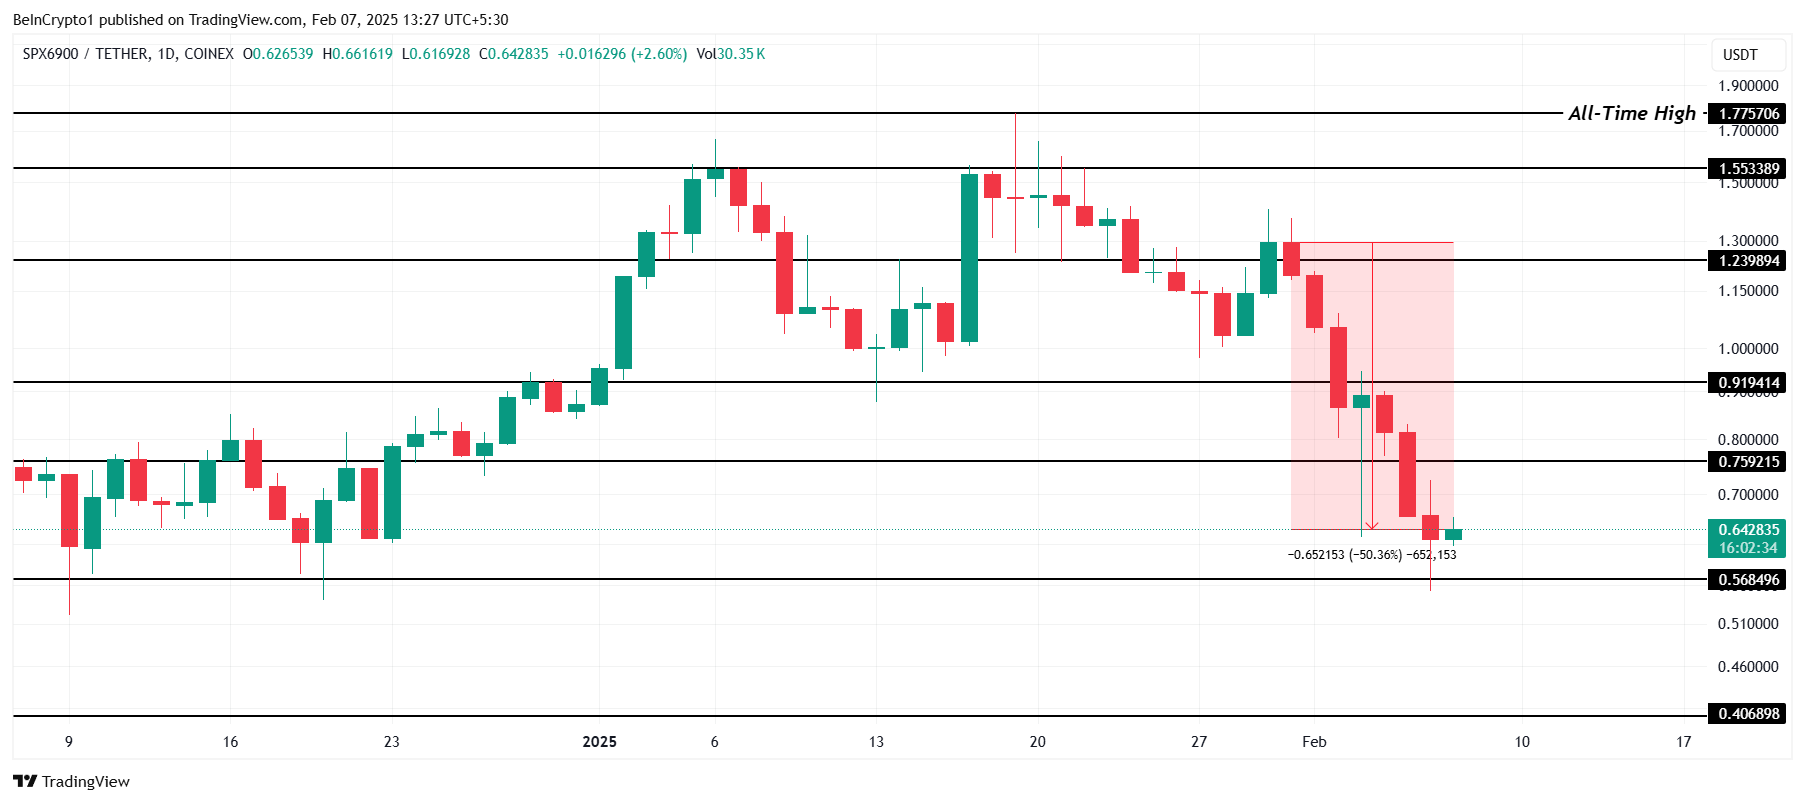
A bullish reversal could occur if SPX flips the $0.759 resistance into support. This shift would signal renewed buying interest, allowing the meme coin to push toward $0.91. A breakout above this level would invalidate the bearish outlook.
Fartcoin (FARTCOIN)
FARTCOIN experienced a steep 58% decline this week, trading at $0.468 at the time of writing. This sharp drop positioned it as one of the worst-performing meme coins. The downturn intensified as FARTCOIN fell below the critical $0.600 support level, increasing selling pressure and dampening investor sentiment in the market.
The next key level for FARTCOIN is $0.377, where a bounce could help stabilize the price. However, weak momentum raises concerns about continued consolidation below $0.600. Without significant buying pressure, the meme coin could struggle to regain lost ground, leading to prolonged stagnation in its price movement.
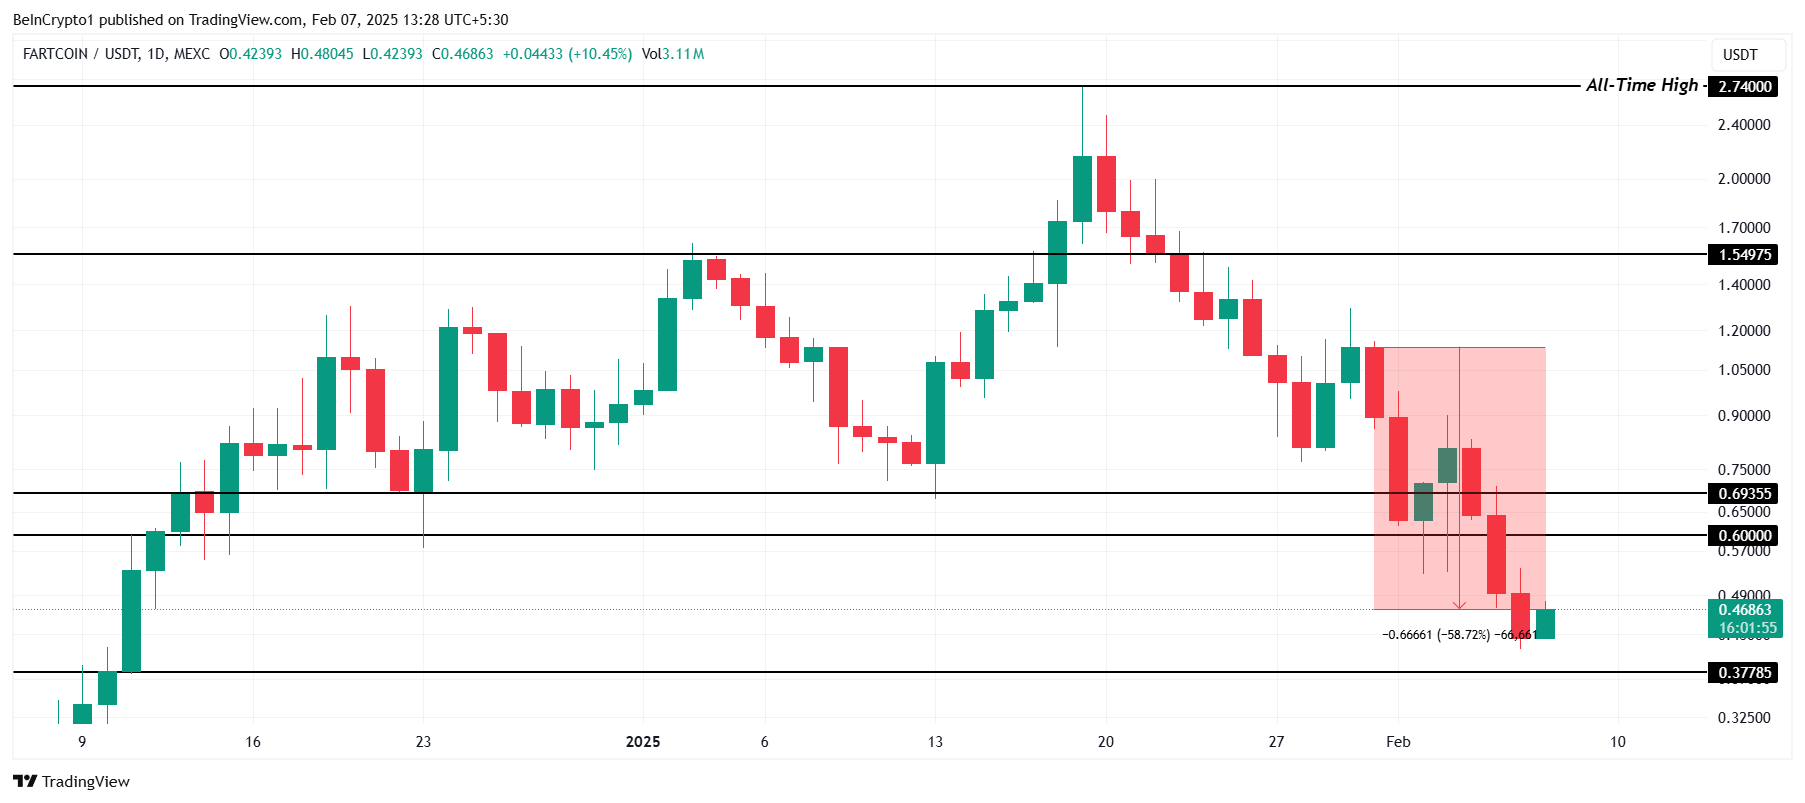
A potential recovery remains possible if FARTCOIN reclaims the $0.600 support level. Flipping this barrier into support could pave the way for an upward push toward $0.693. A breakout above this resistance would invalidate the bearish outlook, potentially restoring investor confidence and fueling a broader recovery in the meme coin’s price.
Disclaimer
In line with the Trust Project guidelines, this price analysis article is for informational purposes only and should not be considered financial or investment advice. BeInCrypto is committed to accurate, unbiased reporting, but market conditions are subject to change without notice. Always conduct your own research and consult with a professional before making any financial decisions. Please note that our Terms and Conditions, Privacy Policy, and Disclaimers have been updated.


Reason to trust
![]()
Strict editorial policy that focuses on accuracy, relevance, and impartiality
Created by industry experts and meticulously reviewed
The highest standards in reporting and publishing
Strict editorial policy that focuses on accuracy, relevance, and impartiality
Morbi pretium leo et nisl aliquam mollis. Quisque arcu lorem, ultricies quis pellentesque nec, ullamcorper eu odio.
The XRP price could be staging a parabolic rally to new all-time highs of $110. While an analyst shares a technical analysis to back this ambitious target, Bollinger Bands creator John Bollinger declares XRP to be a market leader in the crypto space.
Analyst Predicts New XRP Price Target To $110
In a rather lengthy X (formerly Twitter) post, market expert Egrag Crypto went deep into his analysis for the XRP price, basing his predictions on its Elliott Wave structure. The crypto analyst confidently forecasted that XRP was heading towards a new $110 ATH. This bullish target would represent a whopping 3,974% increase from its current market value.
Related Reading
Firstly, Egrag Crypto outlines XRP’s five-wave structure, underscoring that each wave could push the cryptocurrency to a new target. The analyst reveals that XRP is currently in Wave 2 of its Elliott Wave structure and is closely approaching Wave 3, which is expected to trigger the most explosive increase.
In Wave 1, XRP saw an impressive 733% increase to new highs. However, in its current Wave 2, Egrag Crypto highlights that its 2017 fractal appears more profound. With the formation of a Double Bottom pattern, the analyst has predicted a potential price breakdown for the cryptocurrency.
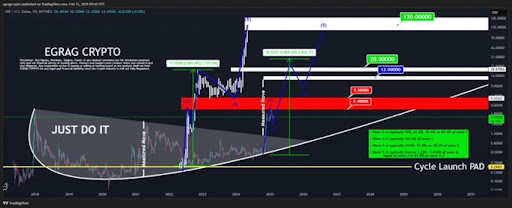
Egrag Crypto further forecasts that Wave 3 will trigger a reversal and cause the price to skyrocket by 1,185%. This massive price increase would effectively place the XRP price at a potential target between $22 and $24. For a more conservative target, the analyst estimates a surge of around $22 to $24.
For Wave 4, Egrag Crypto predicts another major retracement similar to Wave 2. However, this time, the analyst believes XRP could decline by either 14.6%, 23.6%, or 38.2% from Wave 3’s price high. This correction would mark a 65% drop from Wave 3’s peak, bringing the cryptocurrency’s price down to $8. He also highlights a worse-case bearish scenario where XRP crashes as low as $3.4.
Notably, Egrag Crypto shares three potential bullish targets for Wave 5, the final part of the Elliott Wave Structure. He forecasts that the altcoin could surge between $32 to $48, $60 to $70, or $95 to $110. The analyst has based his optimistic forecast on past cycle trends, where 2017 saw a major price rally for XRP.
Bollinger Bands Creator Says The Asset To Become Leader
In other news, Bollinger, the creator of the renowned Bollinger Band technical analysis tool, has highlighted XRP in his latest post, questioning whether it could take a leading role in the crypto market. The technical analyst asserts that Ripple has held up better than other primary crypto vehicles.
Considering its legal battles with the US SEC and present regulatory challenges, Ripple continues to remain resilient, aiming to gain clarity during the final stages of the five-year-long lawsuit. Meanwhile, the XRP price, which is currently trading at $2.4, has experienced a recent uptick, increasing by almost 4% in the last day, according to CoinMarketCap.
Featured image from Adobe Stock, chart from Tradingview.com

- US Bitcoin ETFs collectively manage $115 billion in assets
- Since mid-February, Bitcoin ETFs have witnessed total outflows of nearly $5 billion
- Bitcoin’s decline continues as selling pressure intensifies
Even as Bitcoin’s price has tumbled 25% since the start of 2025, a staggering 95% of investors in US spot Bitcoin ETFs have held firm, resisting the urge to sell.
Despite market volatility and macroeconomic uncertainties, Bloomberg data suggests that the overwhelming majority of ETF holders remain unfazed, showcasing strong conviction in Bitcoin’s long-term potential.
Bitcoin ETFs show resilience
Bloomberg ETF strategist James Seyffart reported that inflows into Bitcoin ETFs have slightly declined to $35 billion, down from their $40 billion peak.
However, this still represents over 95% of investor capital remaining in ETFs, even as Bitcoin’s price struggles.
Institutional investors, including Goldman Sachs, continue to maintain significant exposure, with more than $1.5 billion invested in Bitcoin ETFs.
As of now, US Bitcoin ETFs collectively manage $115 billion in assets, underscoring the staying power of both retail and institutional investors despite the crypto market downturn.
Bitcoin ETF outflows persist
Since mid-February, Bitcoin ETFs have witnessed total outflows of nearly $5 billion.
On March 13 alone, outflows reached $135 million, according to Farside Investors.
However, BlackRock’s iShares Bitcoin Trust (IBIT) remains an exception, attracting net inflows of $45.7 million amid the broader sell-off.
Bitcoin price faces pressure
Bitcoin’s decline continues as selling pressure intensifies due to macroeconomic concerns, including the Trump administration’s ongoing tariff battle.
While BTC briefly surged above $84,000 following the release of US CPI data on Wednesday, it failed to hold above key resistance levels.
At press time, Bitcoin is trading at $81,953, down 1.56% on the day, with daily trading volume dropping 22% to under $30 billion.
According to Coinglass data, 24-hour liquidations have spiked to $75 million, with $52 million in long positions being wiped out.
CryptoQuant CEO Ki Young Ju noted that Bitcoin demand appears “stuck” at current levels but emphasized that it is still “too early to call it a bear market.”
Long-term Bitcoin holders continue accumulating
Despite Bitcoin ETF outflows, on-chain data reveals that long-term holders are accumulating more BTC.
Crypto analyst Ali Martinez reported that these investors have added over 131,000 BTC to their wallets in the past month alone, signaling confidence in Bitcoin’s long-term trajectory.
With Bitcoin’s price volatility and ETF outflows persisting, the coming weeks could be crucial in determining whether investors’ diamond hands will hold firm or if selling pressure will intensify.

Reason to trust
![]()
Strict editorial policy that focuses on accuracy, relevance, and impartiality
Created by industry experts and meticulously reviewed
The highest standards in reporting and publishing
Strict editorial policy that focuses on accuracy, relevance, and impartiality
Morbi pretium leo et nisl aliquam mollis. Quisque arcu lorem, ultricies quis pellentesque nec, ullamcorper eu odio.
Bitcoin price started a recovery wave above the $80,500 zone. BTC is now rising and might aim for a move above the $84,000 and $85,000 levels.
- Bitcoin started a decent recovery wave above the $81,000 zone.
- The price is trading above $81,500 and the 100 hourly Simple moving average.
- There was a break below a short-term bullish trend line with support at $83,000 on the hourly chart of the BTC/USD pair (data feed from Kraken).
- The pair could start another increase if it clears the $82,500 and $84,000 levels.
Bitcoin Price Eyes Steady Increase
Bitcoin price remained stable above the $78,000 level. BTC formed a base and recently started a recovery wave above the $80,500 resistance level.
The bulls pushed the price above the $82,000 resistance level. However, the bears were active near the $84,000 resistance zone. A high was formed at $84,200 and the price corrected some gains. There was a move below the $83,000 level.
The price dipped below the 50% Fib retracement level of the upward move from the $76,818 swing low to the $84,200 high. Besides, there was a break below a short-term bullish trend line with support at $83,000 on the hourly chart of the BTC/USD pair.
Bitcoin price is now trading above $81,200 and the 100 hourly Simple moving average. On the upside, immediate resistance is near the $82,450 level. The first key resistance is near the $84,000 level. The next key resistance could be $85,000.

A close above the $85,000 resistance might send the price further higher. In the stated case, the price could rise and test the $86,500 resistance level. Any more gains might send the price toward the $88,000 level or even $96,200.
Another Drop In BTC?
If Bitcoin fails to rise above the $82,450 resistance zone, it could start a fresh decline. Immediate support on the downside is near the $80,500 level. The first major support is near the $79,600 level or the 61.8% Fib retracement level of the upward move from the $76,818 swing low to the $84,200 high.
The next support is now near the $78,500 zone. Any more losses might send the price toward the $77,000 support in the near term. The main support sits at $76,500.
Technical indicators:
Hourly MACD – The MACD is now gaining pace in the bullish zone.
Hourly RSI (Relative Strength Index) – The RSI for BTC/USD is now above the 50 level.
Major Support Levels – $80,500, followed by $79,600.
Major Resistance Levels – $82,450 and $84,000.
Analyst Sets $100 As “Realistic” Target For XRP Price In This Bull Run

XRP Price To $110? Bollinger Bands Creator Reveals Why It Will Become A Market Leader

21Shares To Liquidate Bitcoin and Ethereum Futures ETFs, Here’s All
21Shares To Liquidate Bitcoin and Ethereum Futures ETFs, Here’s All

Will Ethereum Price Hit $5,000 If Pectra Goes Live on Mainnet?

Can Cardano Price Reach $1 As Whales Gobble 130 Million ADA?


-
 Altcoin18 hours ago
BTC Regains $84K; ETH, XRP, SOL Pump
-
 Altcoin14 hours ago
Shiba Inu Price Jumps Amid Massive 535M SHIB Token Burn, 20% Gains Ahead?
-

 Ethereum23 hours ago
Ethereum Consolidates Since ‘The Big Dump’ – Local Trend Reversal Or Continuation?
-

 Ethereum15 hours ago
Ethereum FUD Spikes After 13% Price Drop: Bottom Signal?
-
 Altcoin15 hours ago
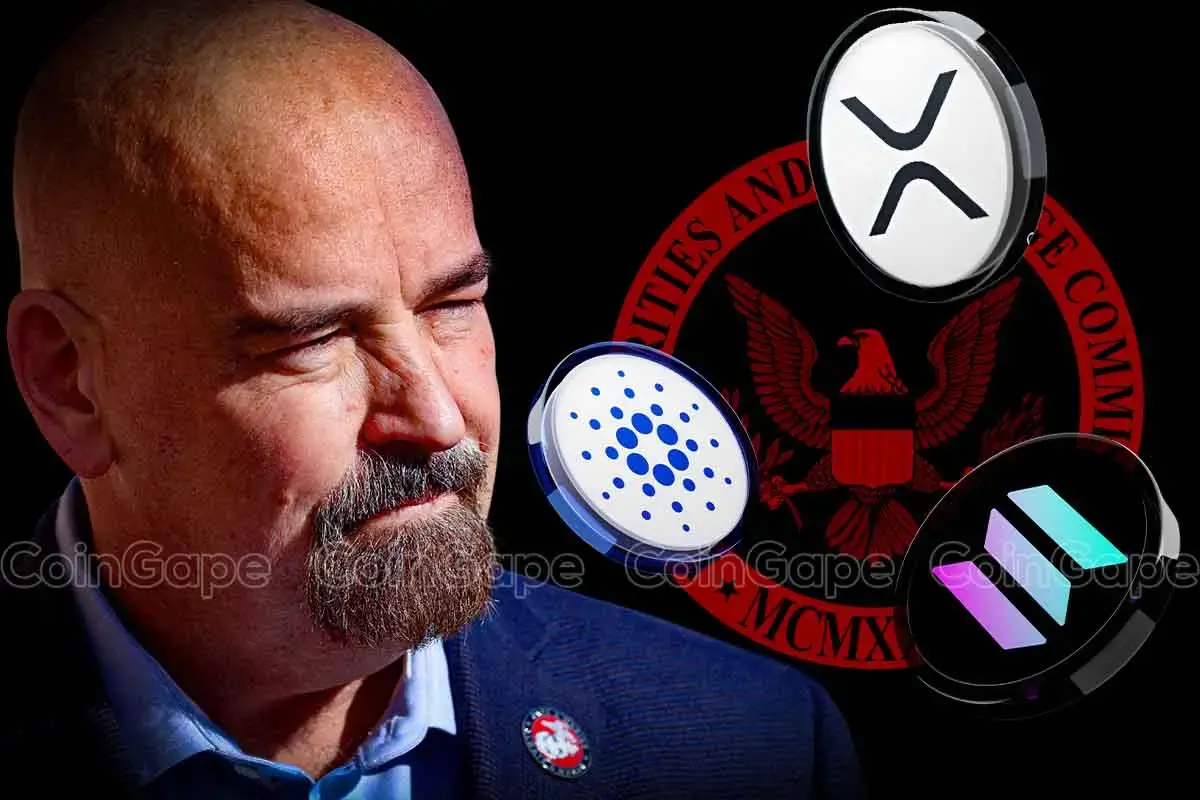
US SEC Remains Silent on XRP, SOL, & ADA Roles, Clarifies John Deaton
-

 Ethereum13 hours ago
Why Up-Only For 217 Days Is Possible
-

 Ethereum11 hours ago
Ethereum Struggles Below $2K as Bitcoin Recovers—Will ETH Catch Up?
-

 Altcoin11 hours ago
Dogecoin Price Registers Deviation From Macro Channel, Analyst Sets $6 Target
 Arabic
 Chinese (Simplified)
 Dutch
Dutch English
 French
 German
 Italian
 Portuguese
 Russian
 Spanish
 Vietnamese