
Market
Berachain (BERA) Price Falls 50% Post Launch to New Lows

Berachain’s native token, BERA, has had an underwhelming start, struggling to gain traction amid weak market conditions. The token’s launch followed the debut of Berachain’s Layer 1 proof-of-liquidity blockchain on Thursday.
Along with it came an airdrop of 55.75 million BERA, which peaked at a valuation of $1 billion before experiencing a sharp decline.
Berachain Is Losing Traction
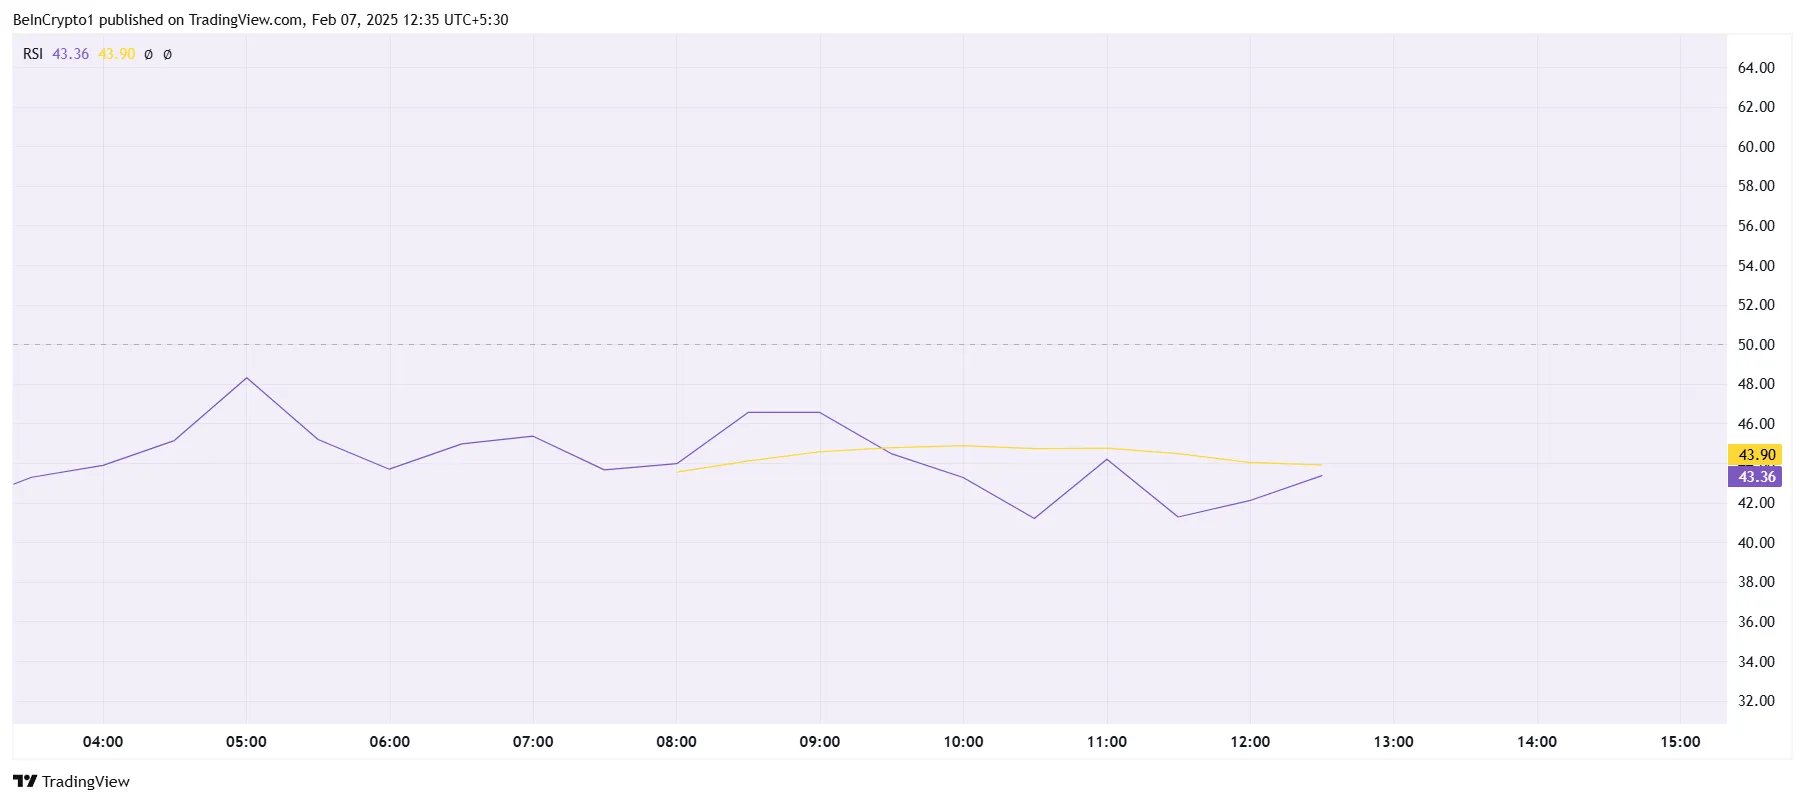
The Relative Strength Index (RSI indicates that bearish momentum is currently in control, with the indicator struggling below the neutral 50.0 mark. This suggests that selling pressure outweighs buying interest, limiting any immediate recovery potential. Traders remain cautious, further contributing to BERA’s sluggish performance in the early trading phase.
Given the lack of strong bullish momentum, short-term price growth appears uncertain. If RSI remains below the neutral level, BERA could continue to face resistance in establishing a meaningful uptrend. Without a shift in market sentiment, the token may remain under pressure, extending its current consolidation phase.
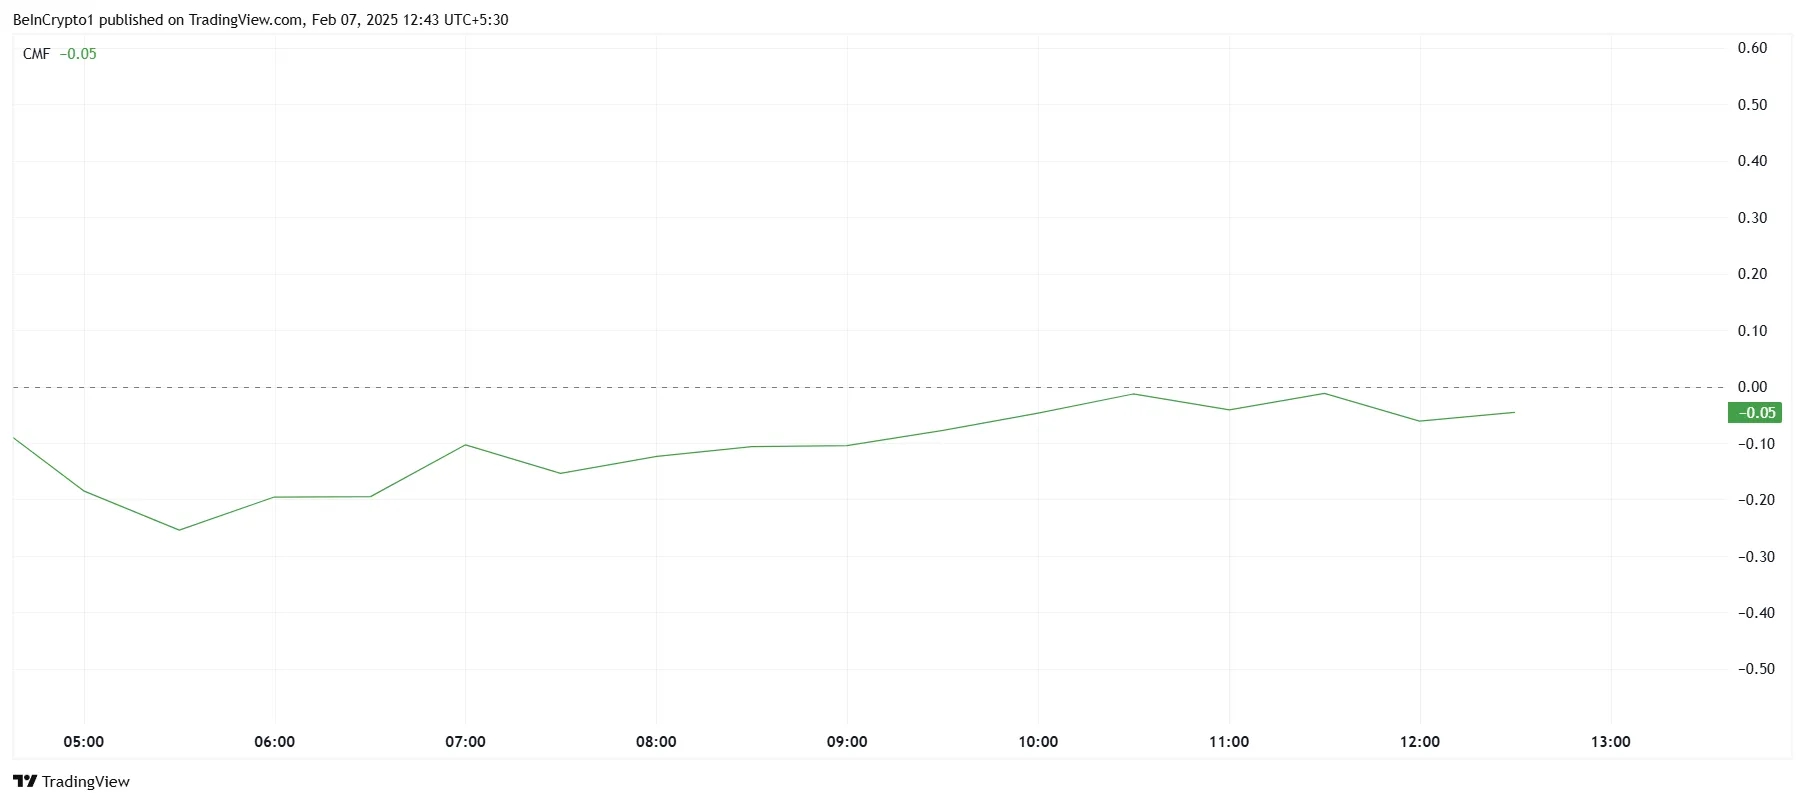
The broader market outlook for BERA remains uncertain, as reflected in the Chaikin Money Flow (CMF) indicator, which is currently below the zero line. This signals weak capital inflows into the token, suggesting investors are hesitant to commit funds. The uncertainty surrounding Berachain’s long-term viability may be a contributing factor.
Skepticism regarding newly launched projects often results in cautious trading behavior, as seen with BERA. If investor confidence does not improve, the token may struggle to attract significant inflows. Without an increase in buying pressure, the price could remain subdued, further limiting its ability to recover from the initial decline.
BERA Price Prediction: Breaking Out
BERA is currently trading at $7.61, consolidating between $8.72 and $7.07 over the past 12 hours. The limited movement within this range highlights the impact of bearish sentiment and weak investor interest. Until a breakout occurs, price action is likely to remain subdued.
The altcoin has already experienced a sharp 50% decline during its intra-day low and its current all-time low and is now down by 45% from its peak. Such a steep drop on the first day raises concerns about its immediate outlook. If selling pressure continues, BERA could extend its losses, potentially testing the $5.00 support level.
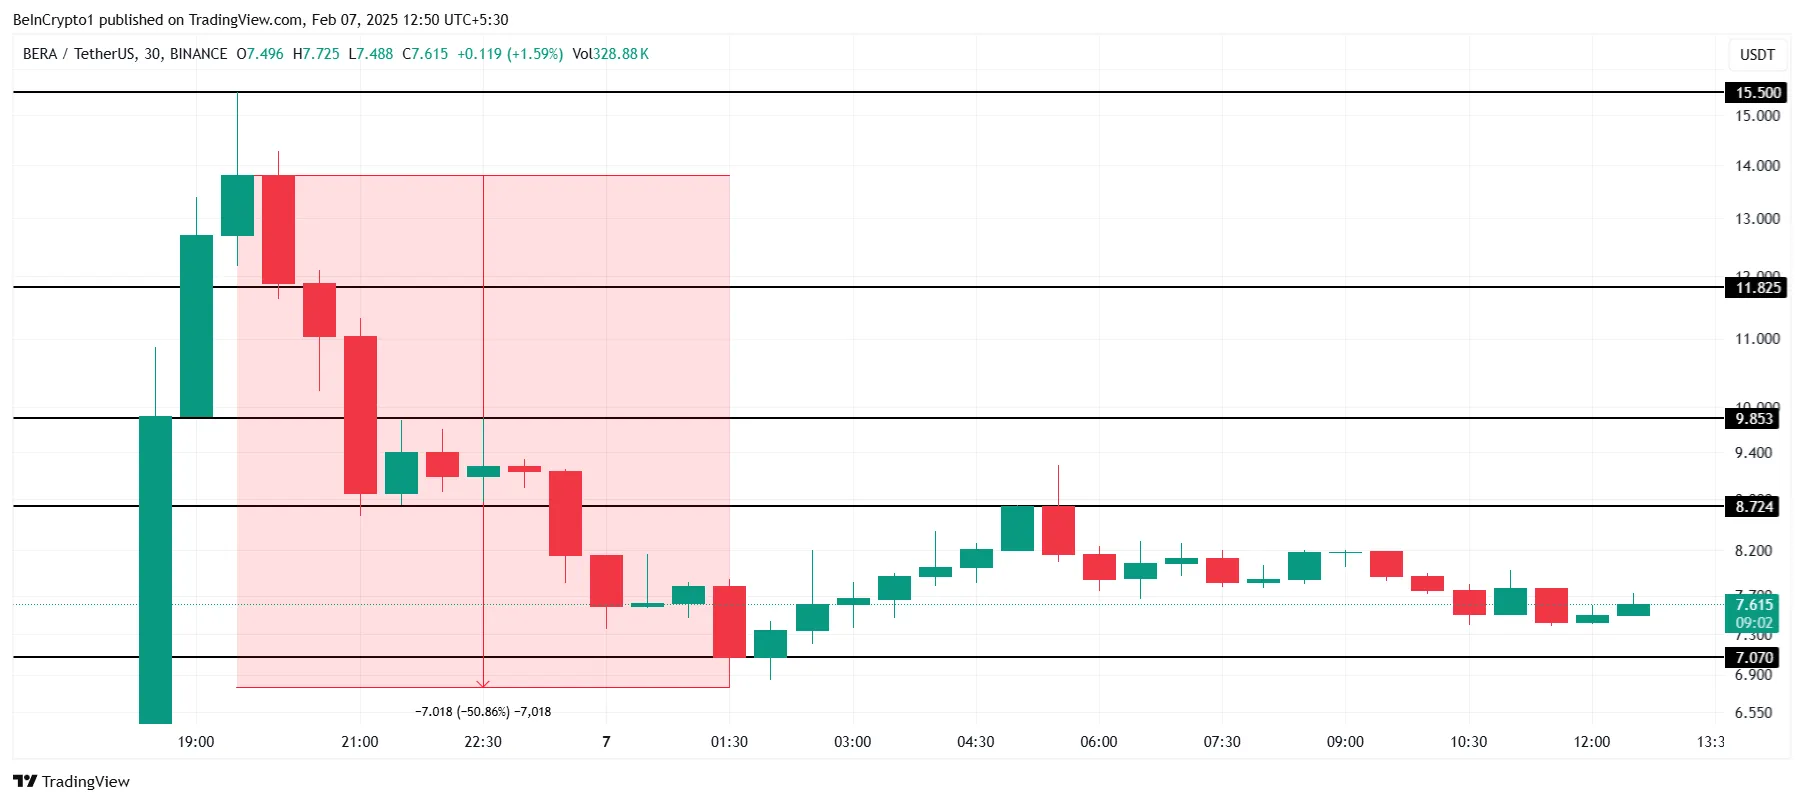
However, a potential turnaround remains possible if the altcoin can reclaim $8.72 as a support level. A successful flip of this resistance could spark renewed interest, leading to a rally toward $9.85. This move would invalidate the bearish outlook and set the stage for further recovery.
Disclaimer
In line with the Trust Project guidelines, this price analysis article is for informational purposes only and should not be considered financial or investment advice. BeInCrypto is committed to accurate, unbiased reporting, but market conditions are subject to change without notice. Always conduct your own research and consult with a professional before making any financial decisions. Please note that our Terms and Conditions, Privacy Policy, and Disclaimers have been updated.


Cardano price started a fresh decline below the $0.75 zone. ADA is correcting some losses and might face resistance near the $0.750 level.
- ADA price started a recovery wave from the $0.650 zone.
- The price is trading below $0.750 and the 100-hourly simple moving average.
- There is a short-term bearish trend line forming with resistance at $0.720 on the hourly chart of the ADA/USD pair (data source from Kraken).
- The pair could start another increase if it clears the $0.750 resistance zone.
Cardano Price Climbs Higher
In the past few days, Cardano saw a bearish wave below the $0.80 level, like Bitcoin and Ethereum. ADA declined below the $0.750 and $0.70 support levels.
Finally, it tested the $0.650 zone. A low was formed at $0.6495 and the price recently started a recovery wave. The price climbed above the $0.680 and $0.70 level. The price tested the 50% Fib retracement level of the downward move from the $0.8169 swing high to the $0.6495 low.
There was a short-term bearish trend line forming with resistance at $0.720 on the hourly chart of the ADA/USD pair. Cardano price is now trading below $0.80 and the 100-hourly simple moving average.
On the upside, the price might face resistance near the $0.750 zone and the 61.8% Fib retracement level of the downward move from the $0.8169 swing high to the $0.6495 low. The first resistance is near $0.7750. The next key resistance might be $0.80.

If there is a close above the $0.80 resistance, the price could start a strong rally. In the stated case, the price could rise toward the $0.950 region. Any more gains might call for a move toward $1.00 in the near term.
Another Decline in ADA?
If Cardano’s price fails to climb above the $0.750 resistance level, it could start another decline. Immediate support on the downside is near the $0.7150 level.
The next major support is near the $0.6880 level. A downside break below the $0.6880 level could open the doors for a test of $0.650. The next major support is near the $0.6320 level where the bulls might emerge.
Technical Indicators
Hourly MACD – The MACD for ADA/USD is losing momentum in the bullish zone.
Hourly RSI (Relative Strength Index) – The RSI for ADA/USD is now below the 50 level.
Major Support Levels – $0.7150 and $0.6880.
Major Resistance Levels – $0.7500 and $0.7750.

KAS has emerged as the market’s top gainer in the past 24 hours. Its price has surged by 15% after hitting a two-year low during Tuesday’s trading session.
The rebound comes amid a broader resurgence in crypto market activity, with increased trading volumes and rising open interest signaling renewed investor confidence.
KAS Rally Backed by Rising Demand
A corresponding uptick in trading volume has accompanied KAS’ double-digit gains. During the review period, the coin’s daily trading volume totaled $189 million, rising by over 95%.
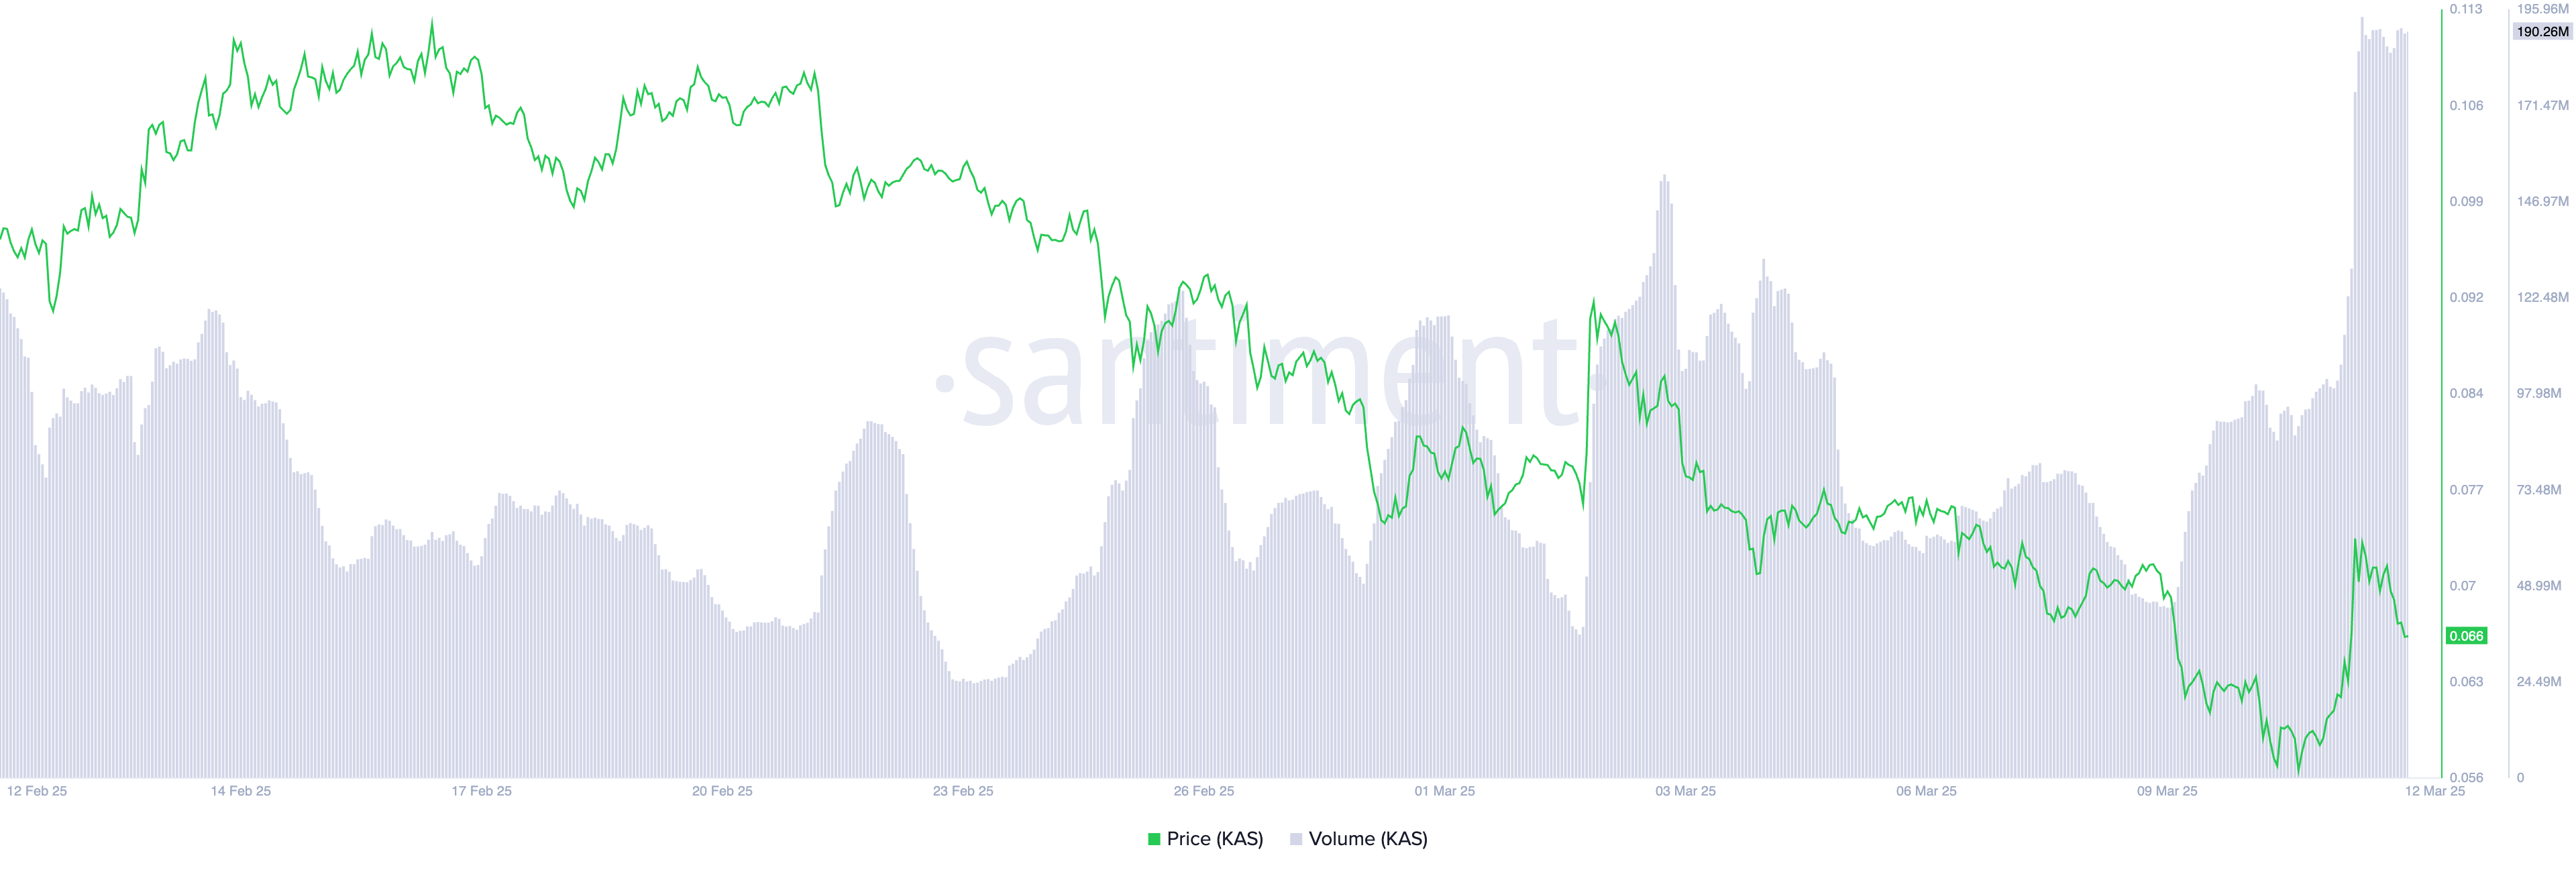
When an asset’s trading volume rallies alongside its price, it indicates strong market participation and increased investor interest. Higher volume confirms that KAS’ price increase is backed by real demand, not speculative trades.
Also, the coin’s rising open interest reflects this. At press time, this is at $64 million, climbing 7% over the past day.
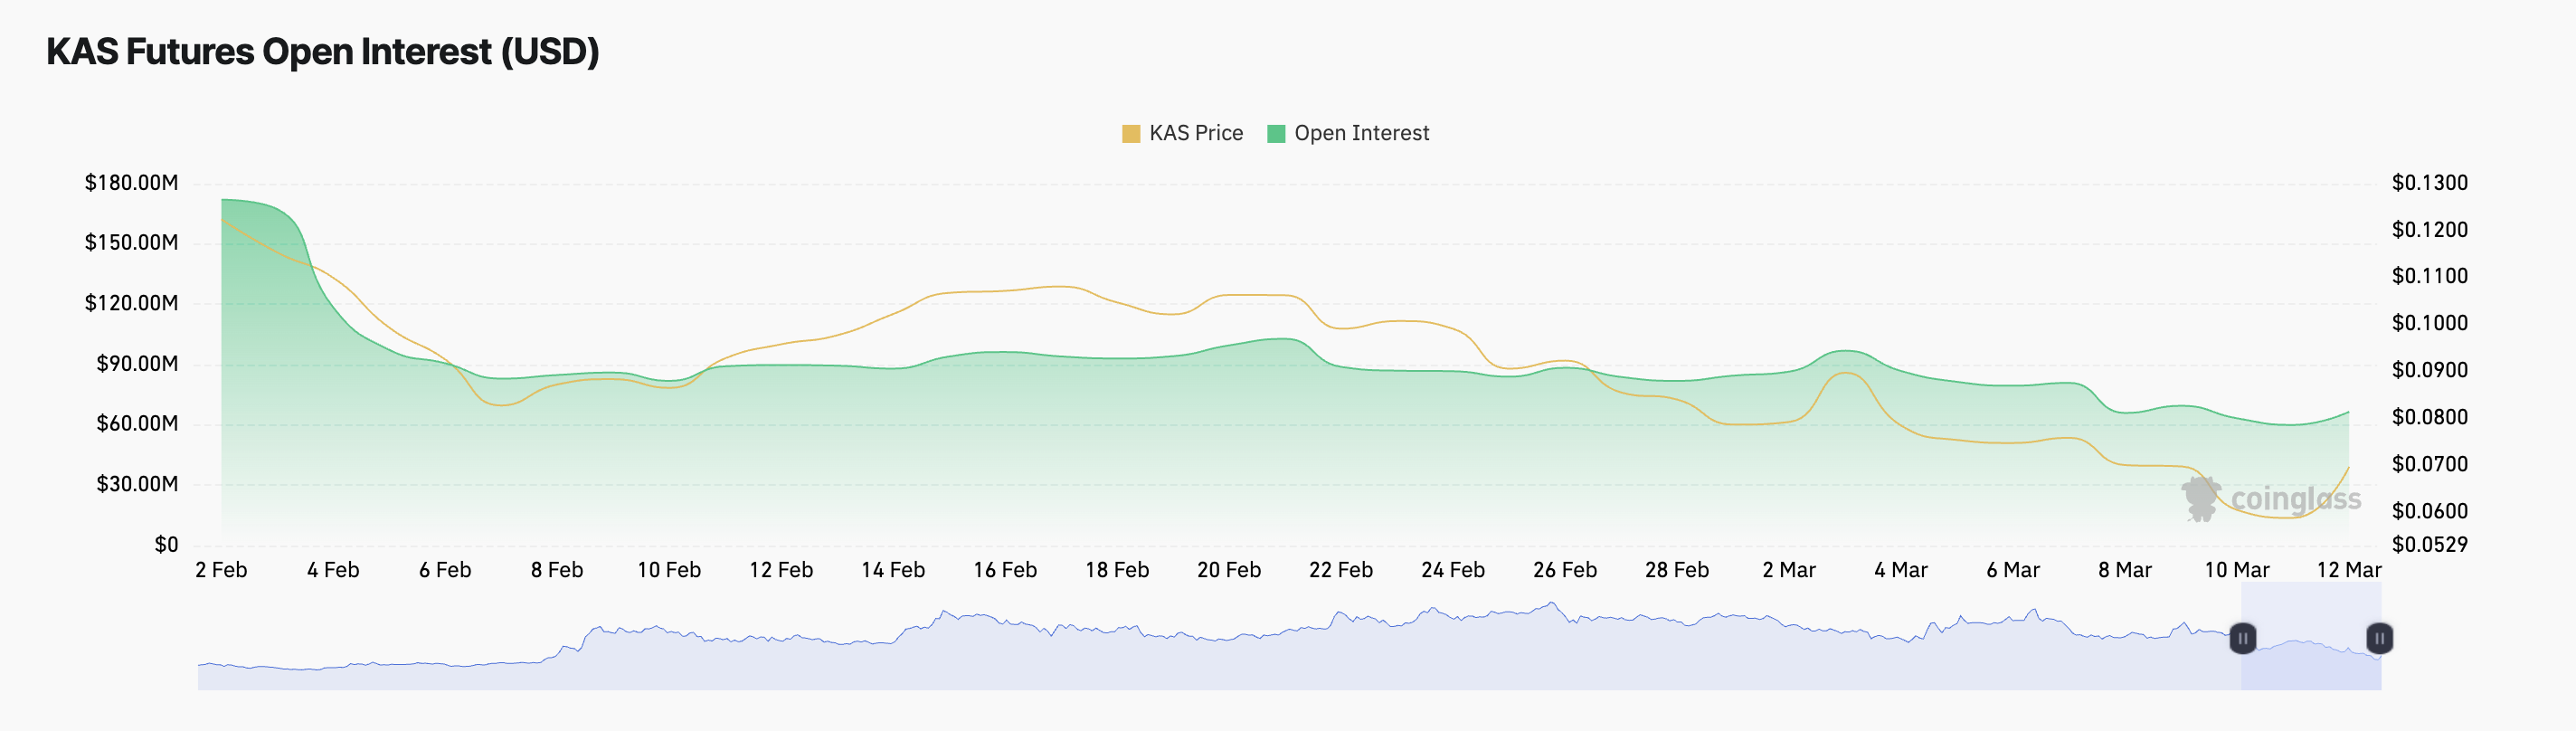
Open interest refers to the total number of outstanding derivative contracts that have not been settled. As it climbs, it suggests increased market participation and fresh capital entering KAS positions. This signals growing confidence in the asset’s price trend and hints at a sustained uptrend if it continues.
Moreover, the coin’s funding rate has flipped from negative to positive, highlighting the bullish shift in sentiment toward KAS. At press time, this stands at 0.0013%.
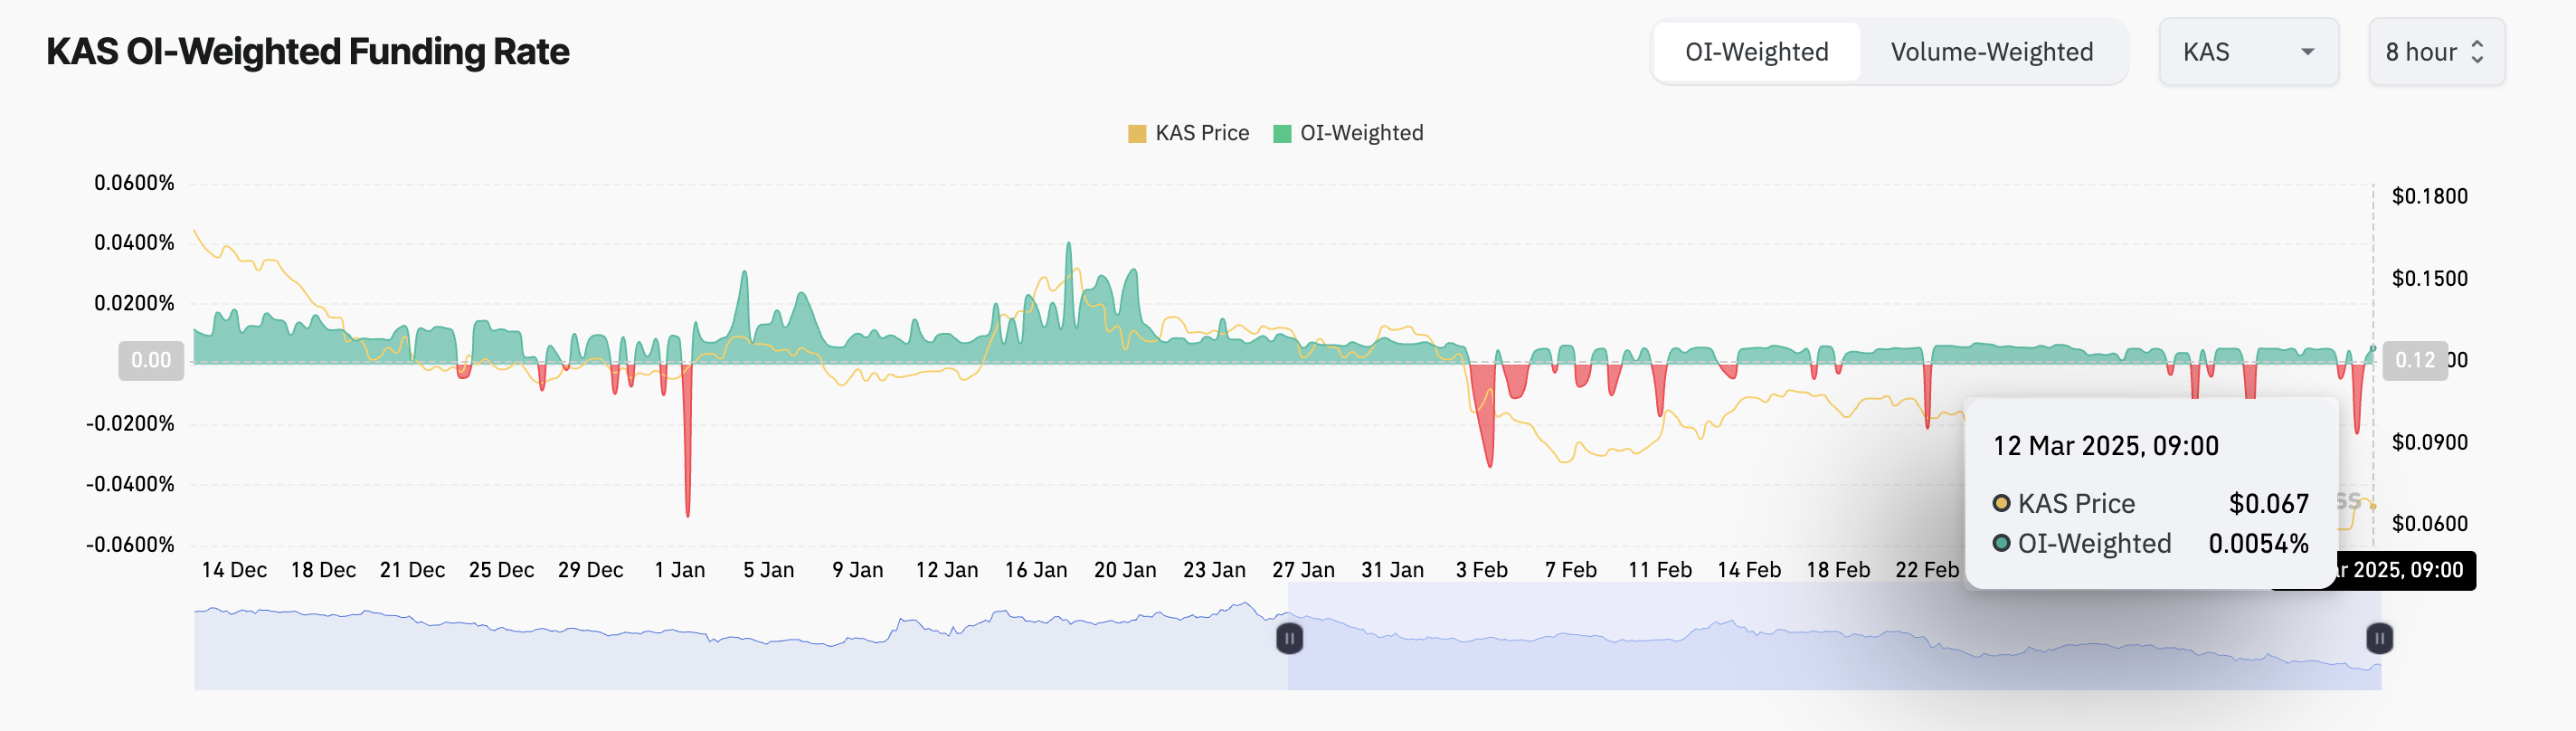
The funding rate is the periodic fee exchanged between long and short traders in perpetual futures contracts to keep the contract price aligned with the spot price. When its value is positive, it means long traders are paying short traders. This trend indicates that the market sentiment is bullish, and traders are willing to pay a premium to maintain their long positions.
Kaspa (KAS) Tests Critical Support at $0.065—Breakout or Breakdown Ahead?
KAS currently trades at $0.066, bouncing off the support formed at $0.065. It could continue its uptrend if this price zone is established as a strong support floor. In that case, KAS could exchange hands at $0.081 in the near term.
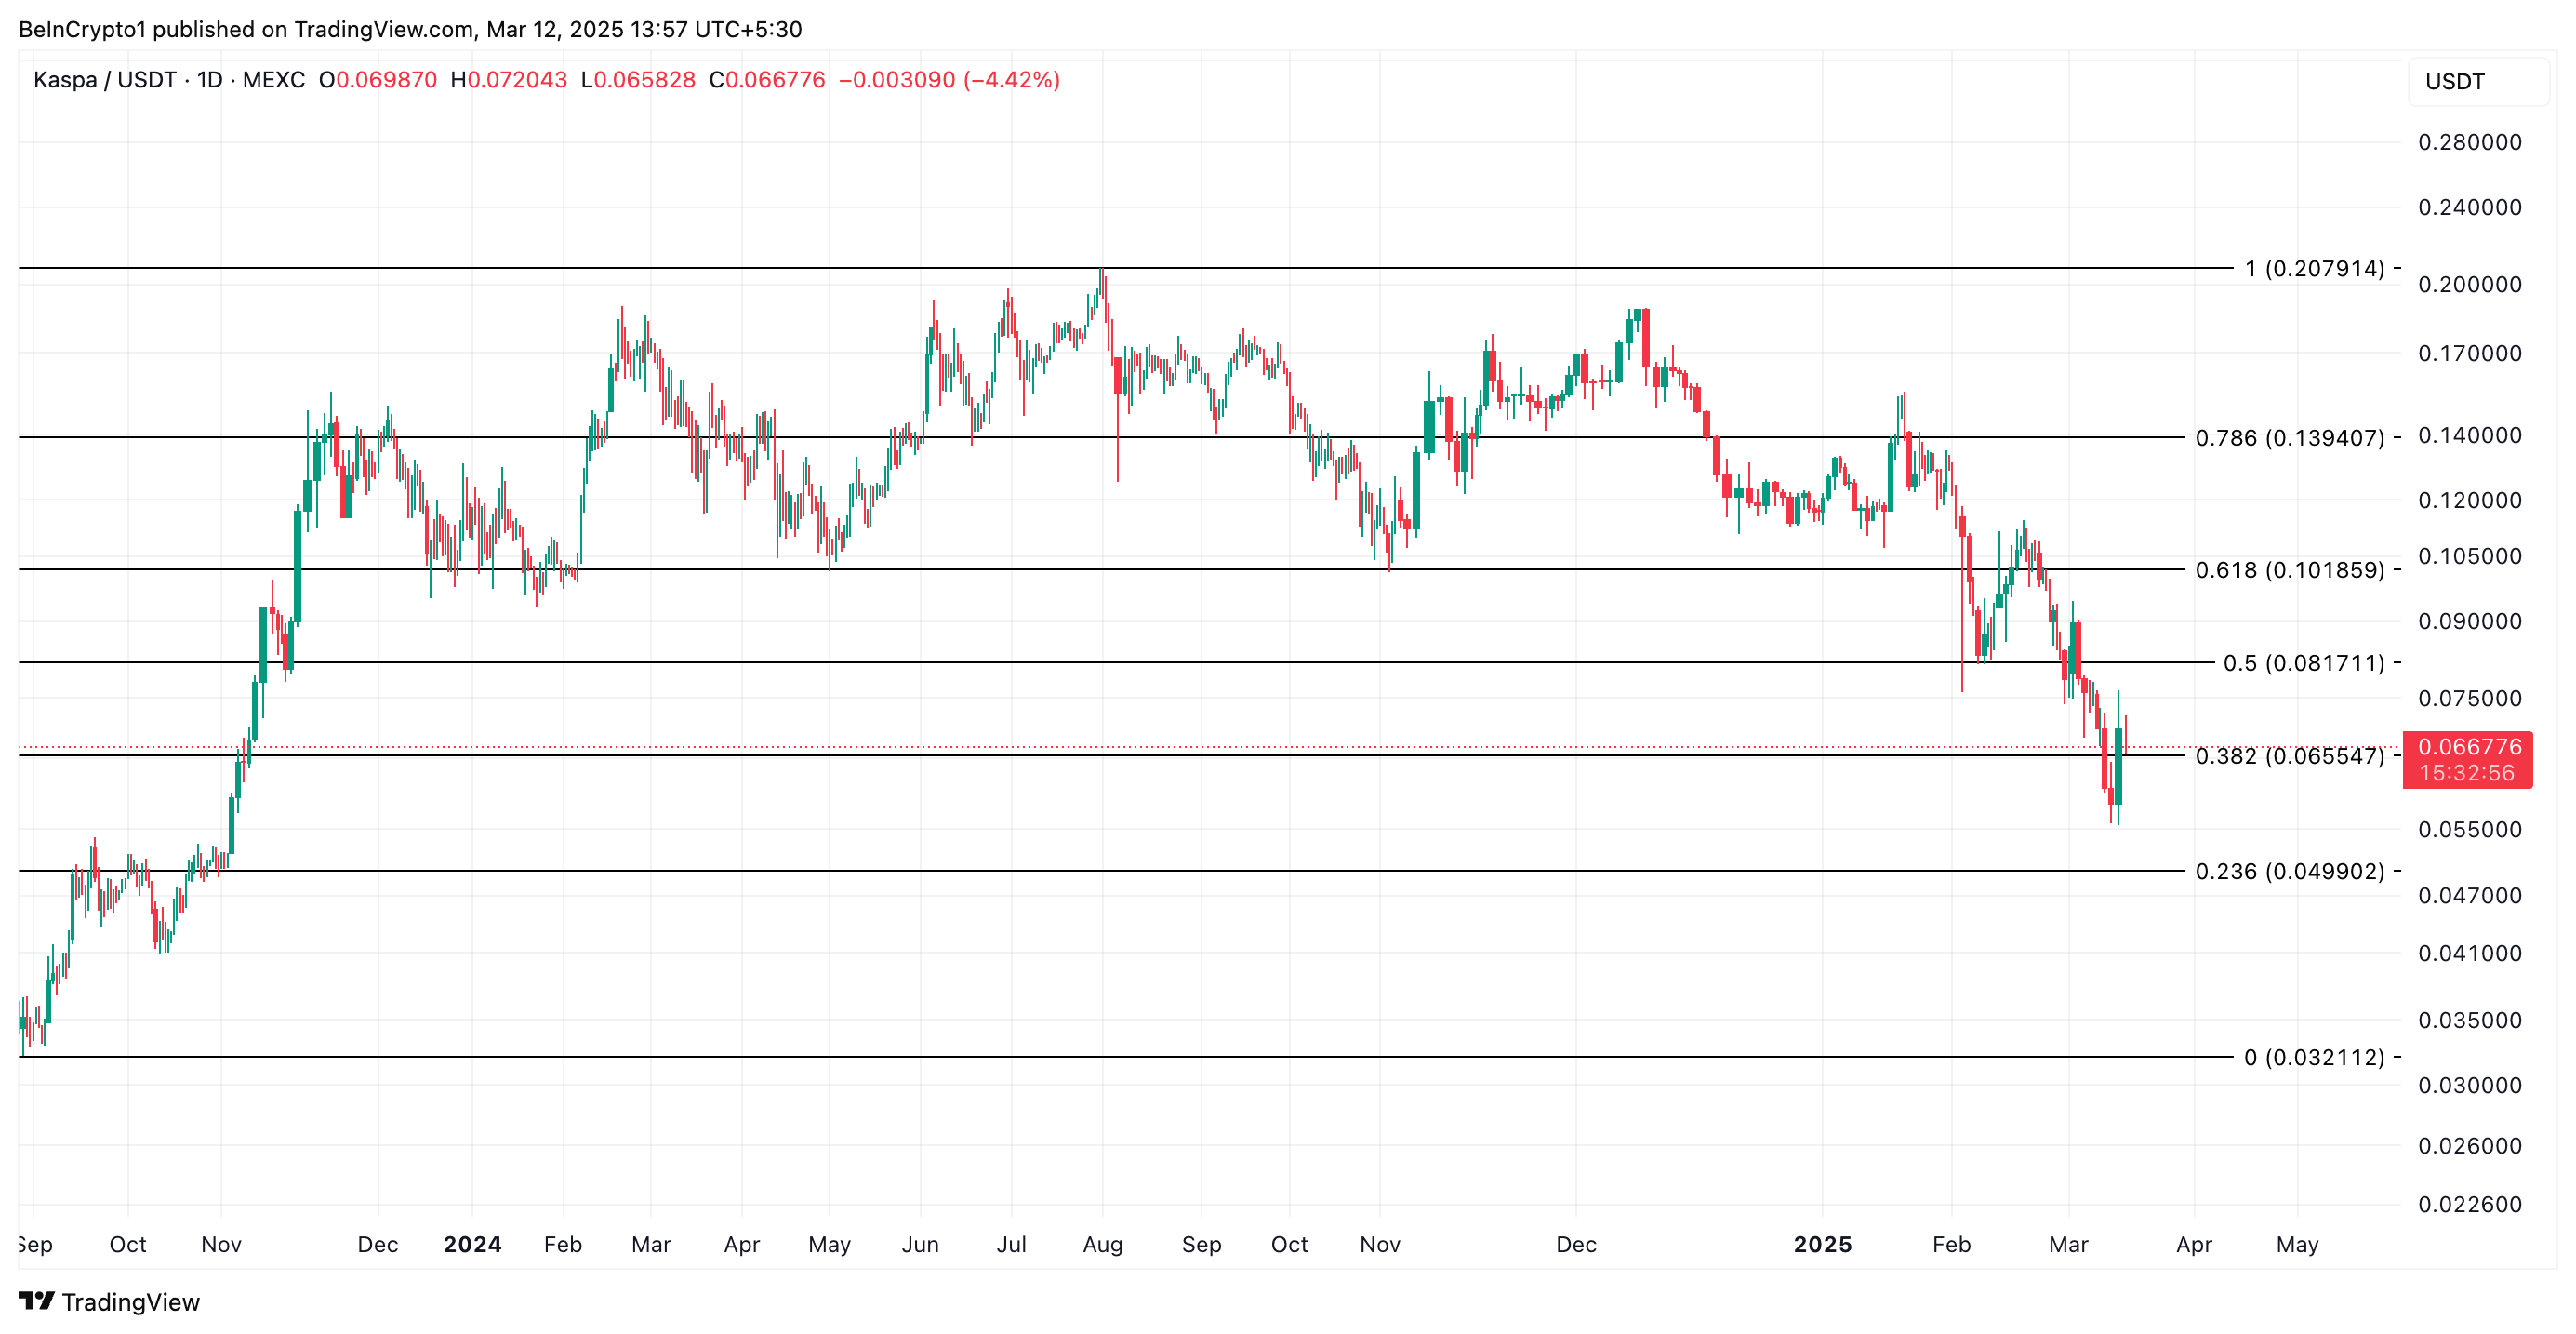
On the other hand, if selling pressure gains momentum, KAS could shed its recent gains and fall below the $0.065 support toward $0.049.
Disclaimer
In line with the Trust Project guidelines, this price analysis article is for informational purposes only and should not be considered financial or investment advice. BeInCrypto is committed to accurate, unbiased reporting, but market conditions are subject to change without notice. Always conduct your own research and consult with a professional before making any financial decisions. Please note that our Terms and Conditions, Privacy Policy, and Disclaimers have been updated.
Aayush Jindal, a luminary in the world of financial markets, whose expertise spans over 15 illustrious years in the realms of Forex and cryptocurrency trading. Renowned for his unparalleled proficiency in providing technical analysis, Aayush is a trusted advisor and senior market expert to investors worldwide, guiding them through the intricate landscapes of modern finance with his keen insights and astute chart analysis.
From a young age, Aayush exhibited a natural aptitude for deciphering complex systems and unraveling patterns. Fueled by an insatiable curiosity for understanding market dynamics, he embarked on a journey that would lead him to become one of the foremost authorities in the fields of Forex and crypto trading. With a meticulous eye for detail and an unwavering commitment to excellence, Aayush honed his craft over the years, mastering the art of technical analysis and chart interpretation.
As a software engineer, Aayush harnesses the power of technology to optimize trading strategies and develop innovative solutions for navigating the volatile waters of financial markets. His background in software engineering has equipped him with a unique skill set, enabling him to leverage cutting-edge tools and algorithms to gain a competitive edge in an ever-evolving landscape.
In addition to his roles in finance and technology, Aayush serves as the director of a prestigious IT company, where he spearheads initiatives aimed at driving digital innovation and transformation. Under his visionary leadership, the company has flourished, cementing its position as a leader in the tech industry and paving the way for groundbreaking advancements in software development and IT solutions.
Despite his demanding professional commitments, Aayush is a firm believer in the importance of work-life balance. An avid traveler and adventurer, he finds solace in exploring new destinations, immersing himself in different cultures, and forging lasting memories along the way. Whether he’s trekking through the Himalayas, diving in the azure waters of the Maldives, or experiencing the vibrant energy of bustling metropolises, Aayush embraces every opportunity to broaden his horizons and create unforgettable experiences.
Aayush’s journey to success is marked by a relentless pursuit of excellence and a steadfast commitment to continuous learning and growth. His academic achievements are a testament to his dedication and passion for excellence, having completed his software engineering with honors and excelling in every department.
At his core, Aayush is driven by a profound passion for analyzing markets and uncovering profitable opportunities amidst volatility. Whether he’s poring over price charts, identifying key support and resistance levels, or providing insightful analysis to his clients and followers, Aayush’s unwavering dedication to his craft sets him apart as a true industry leader and a beacon of inspiration to aspiring traders around the globe.
In a world where uncertainty reigns supreme, Aayush Jindal stands as a guiding light, illuminating the path to financial success with his unparalleled expertise, unwavering integrity, and boundless enthusiasm for the markets.

Cardano Struggles to Climb—ADA Faces Strong Hurdles Ahead

Suspicious High-Leverage Trades on Hyperliquid Raise Red Flags

Binance Reveals Major Backing For These 5 Crypto, Prices To Rally?

KAS Surge Propels 15% Rally, Highlighting Investor Confidence

21Shares Reduces Fees for Bitcoin Ethereum Core ETP, Lists on Xetra

XRP Price Eyes Upside Break—Can Bulls Push Through Resistance?

2.52 Million Altcoins Are Ruining Crypto’s Future

Animoca Brands Valuation Tanks 75% In Two Years, Here’s Why

Crypto exchange BingX hacked for $43 million

Are The Big Players Losing Interest?

Hong Kong’s Securities Association Tips Authorities On Crypto Self-Regulation

Coinbase cbBTC Set to go Live on Solana
2.52 Million Altcoins Are Ruining Crypto’s Future
Animoca Brands Valuation Tanks 75% In Two Years, Here’s Why
Crypto exchange BingX hacked for $43 million
Are The Big Players Losing Interest?
Hong Kong’s Securities Association Tips Authorities On Crypto Self-Regulation
Coinbase cbBTC Set to go Live on Solana
-
 Altcoin22 hours ago
Wake-Up Call for Meme Coin Investors?
-
 Market21 hours ago
Bitcoin’s Potential Bottom: Expert Predictions
-
 Altcoin21 hours ago
Binance Unveils Key Update On CATI & These 5 Crypto, What’s Lies Ahead?
-
 Market23 hours ago
Arbitrum Buyback Plan Arrives Ahead of Major ARB Token Unlock
-

 Market19 hours ago
Ripple CTO and Robert Kiyosaki Advise Buying Bitcoin
-
 Market18 hours ago
Cardano Enters Opportunity Zone, But ADA Holders Are Skeptical
-
 Market22 hours ago
Analyst Says Only Buy XRP If It Reaches This Level
-

 Market20 hours ago
What It Means for Ethereum’s Reputation