
Market
TRUMP Price Falls Under $20 Even As Open Interest Falls 33%

The price of TRUMP has been on a steady decline, experiencing a brief pause last week. Despite this, the cryptocurrency has struggled to regain its footing.
Even though US President Donald Trump’s decisions have affected market sentiment, they have not provided the necessary momentum for the meme coin’s recovery.
TRUMP Investors Are Pulling Back
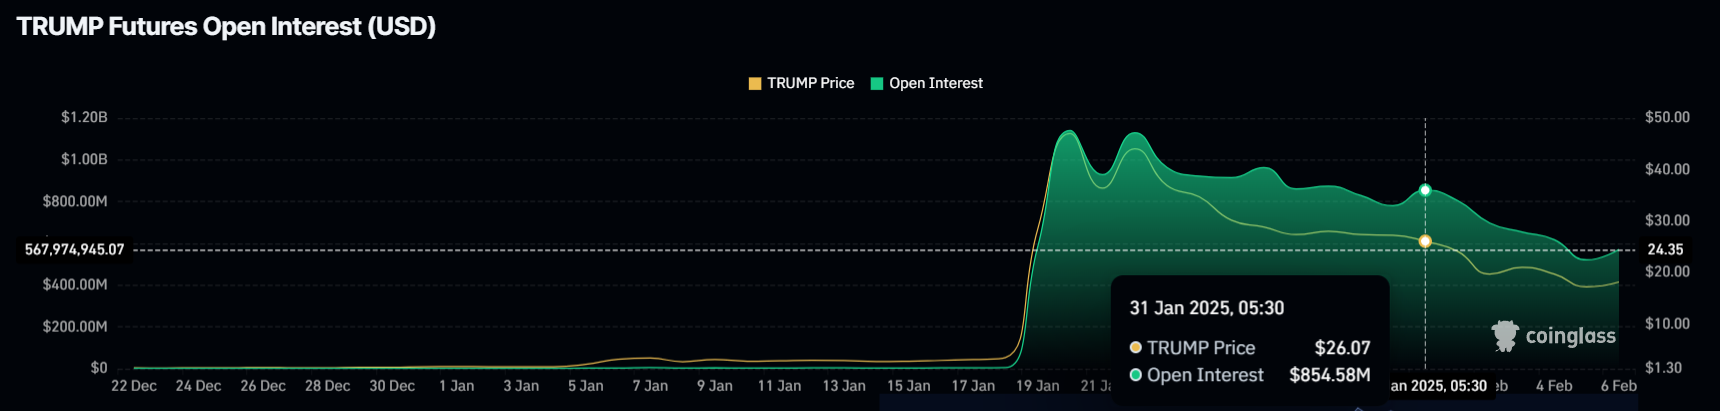
Open Interest in TRUMP has dropped by 33%, falling from $854 million to $567 million. This $287 million reduction signals waning confidence among traders. The significant withdrawal of capital indicates that many are exiting their positions, reducing liquidity and amplifying bearish pressure.
The declining Open Interest suggests that traders are growing impatient with TRUMP’s price action. Many investors are choosing to pull their money out rather than bet on a potential recovery.
This trend strengthens the bearish sentiment, making it harder for the asset to regain lost ground.
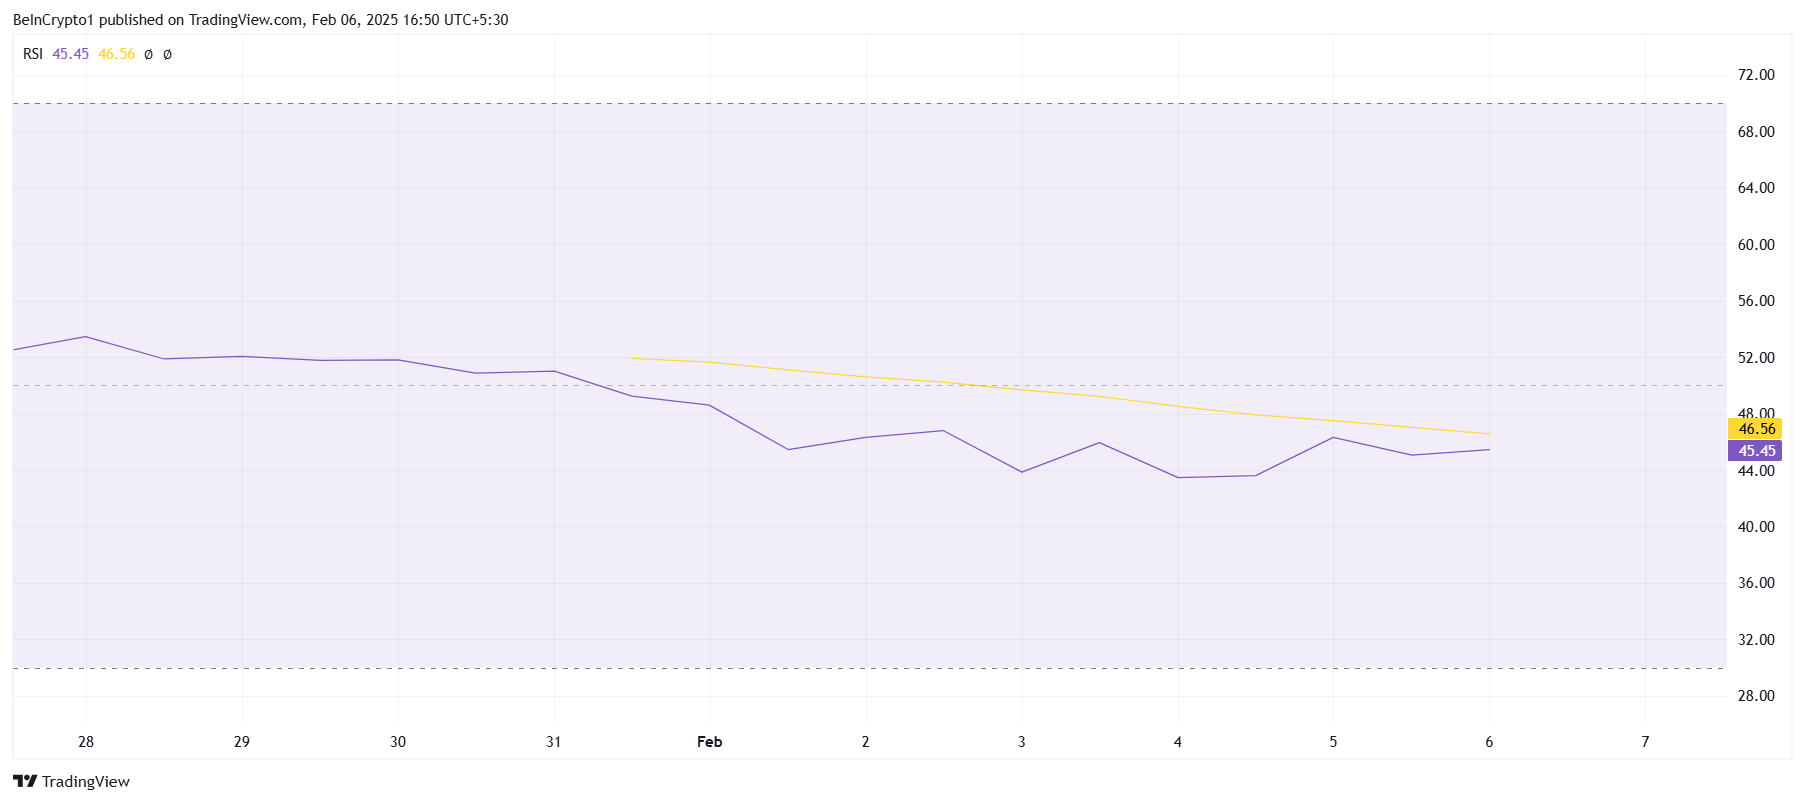
Technical indicators further reinforce the bearish outlook. The Relative Strength Index (RSI) is currently below the neutral 50.0 mark. This signals increasing bearish momentum, with sellers exerting more control over the price direction.
As long as the RSI remains under the neutral level, TRUMP could continue its downtrend. Without a surge in buying pressure, recovery may be difficult, and the cryptocurrency could face extended consolidation or further losses.
TRUMP Price Prediction: Reclaiming Support
TRUMP is currently trading at $18.40, struggling below the critical resistance of $19.58. However, it remains above its key support level of $16.00. The altcoin’s immediate goal is to reclaim $20.00 as a stable support level.
Given the prevailing bearish signals, a swift recovery remains uncertain. As long as TRUMP holds above $16.00, it may consolidate within the $16.00 to $19.58 range. Breaking past $19.58 will be crucial for any potential uptrend.
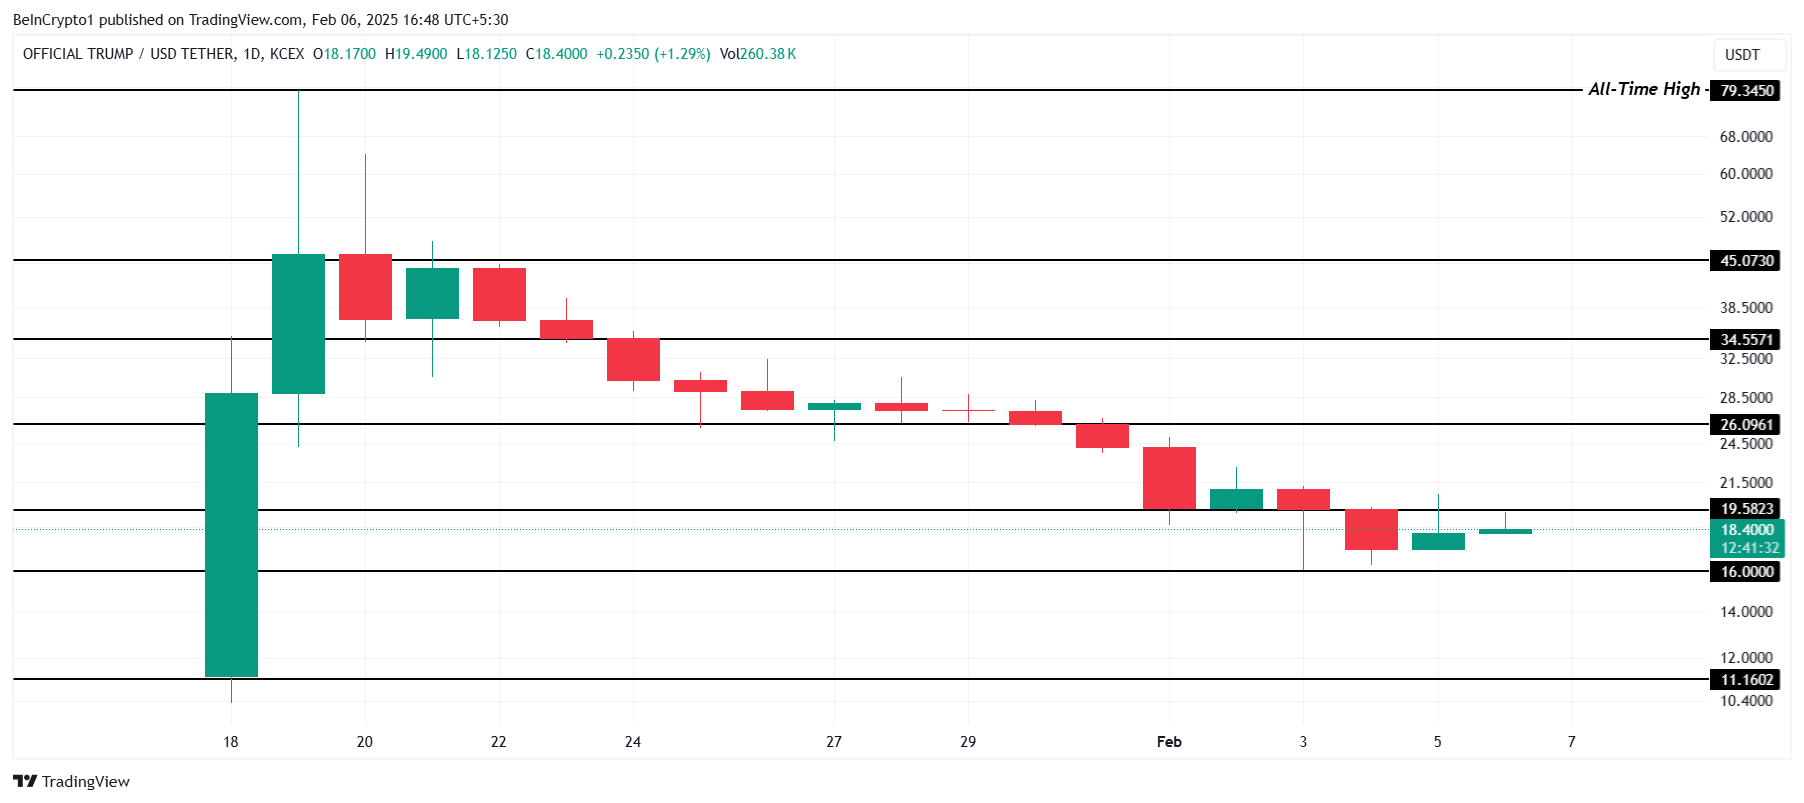
Flipping $19.58 into support would pave the way for a rally toward $20.00 and beyond. If this resistance level is breached, TRUMP could target $26.09, effectively invalidating the bearish thesis and reigniting bullish momentum.
Disclaimer
In line with the Trust Project guidelines, this price analysis article is for informational purposes only and should not be considered financial or investment advice. BeInCrypto is committed to accurate, unbiased reporting, but market conditions are subject to change without notice. Always conduct your own research and consult with a professional before making any financial decisions. Please note that our Terms and Conditions, Privacy Policy, and Disclaimers have been updated.


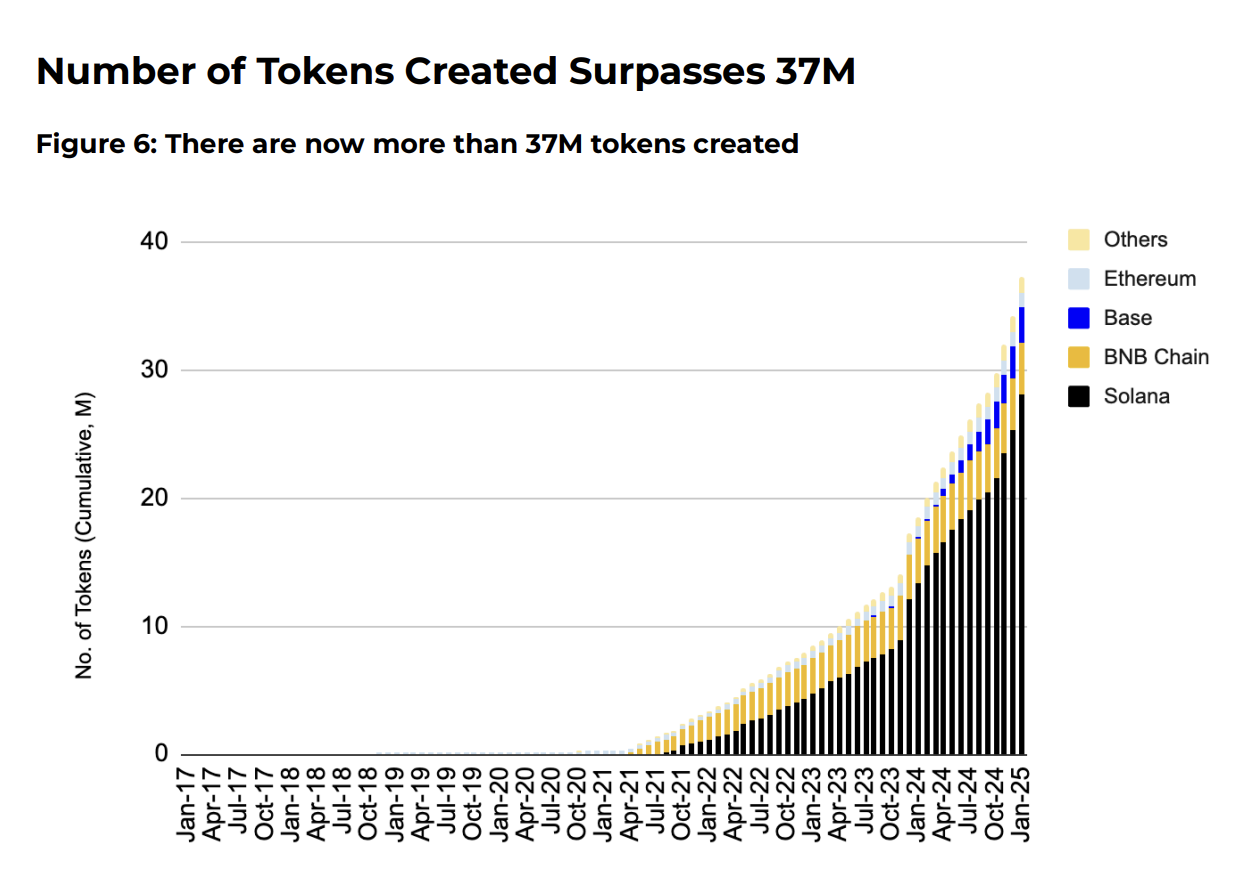
Binance released its latest monthly market insights report, detailing growth in meme coins and ETF filings. The total number of tokens in circulation has reached over 37 million, the majority launching on Solana. Also, there are 47 active ETF filings in the US.
January 2025 was a positive month for the crypto industry, with a peaking market and gains in several key areas. The biggest loser was in AI-related crypto projects, which took a hard beating from DeepSeek.
Binance Research: Meme Coins, ETFs, AI Tokens
Binance Research, a subsidiary of the largest crypto exchange, just released its newest Monthly Market Insights report. In it, Binance painted a positive picture, with the crypto market peaking at $3.76 trillion in January and growth areas like meme coins having a dramatic impact.
“The advent of token launchpads and the meme coin mania has led to the creation of over 37 million tokens, with projections exceeding 100 million by year-end. This growth has fragmented capital, making it harder for tokens to sustain prices and achieve high valuations,” the report claimed.
Binance Research has been studying the meme coin craze for several months, so it makes sense that it has a wealth of data on the subject.
Although meme coins are a growth area in the industry, the report raised a few concerns. Specifically, it concurred with the research suggesting that this tidal wave of projects is sapping energy from traditional altcoins.
Binance claimed that this meme coin influx “fuels speculation, reduces attention spans and discourages long-term holding,” asserting that most tokens have a negligible market cap.
Still, it did have positive downstream impacts, like rapid growth in Solana DEX volumes. Meme coins and AI agents helped the Solana-to-Ethereum DEX volume ratio surpass 300% in January.
Additionally, Binance’s report discussed political changes after Trump’s Inauguration. Since Gary Gensler resigned as SEC Chairman, the Commission immediately saw a rush of ETF applications.
Binance Research claimed that there are currently 47 active ETF applications in the US, covering 16 asset categories, including meme coins.
All in all, Binance reported that January was a positive month for the broader crypto industry. The only significant loser was in AI, as DeepSeek severely punished this niche market.
Regardless, the DeFAI sector did recover somewhat, ending the month with only a -10% return. Compared to initial losses, it could have been a lot worse.
Disclaimer
In adherence to the Trust Project guidelines, BeInCrypto is committed to unbiased, transparent reporting. This news article aims to provide accurate, timely information. However, readers are advised to verify facts independently and consult with a professional before making any decisions based on this content. Please note that our Terms and Conditions, Privacy Policy, and Disclaimers have been updated.

Crypto AI Agents have seen a sharp decline, with their total market cap dropping 13% in the last 24 hours to $6.42 billion. The sector’s biggest coins are struggling, with VIRTUAL, AI16Z, and FARTCOIN all posting significant losses over the past week.
Meanwhile, growth in new crypto AI agents has slowed dramatically, and engagement within the ecosystem has plummeted by 60% in just a few weeks. With both investor interest and market activity fading, the sector faces an uphill battle to regain momentum unless a strong catalyst reignites demand.
Crypto AI Agents Coins Market Cap Is Down
The crypto AI agents market has taken a significant hit, with its total market cap dropping 13% in the last 24 hours to $6.65 billion.
All of the top 10 crypto AI agents cryptos have posted losses over the past seven days, with FARTCOIN plummeting 61%, AI16Z down 59%, and the largest one, VIRTUAL, losing 40% of its value.
This broad sell-off highlights the ongoing weakness in the AI crypto sector, as investors continue to exit positions amid the correction, a movement that has been happening and intensifying since DeepSeek’s launch.
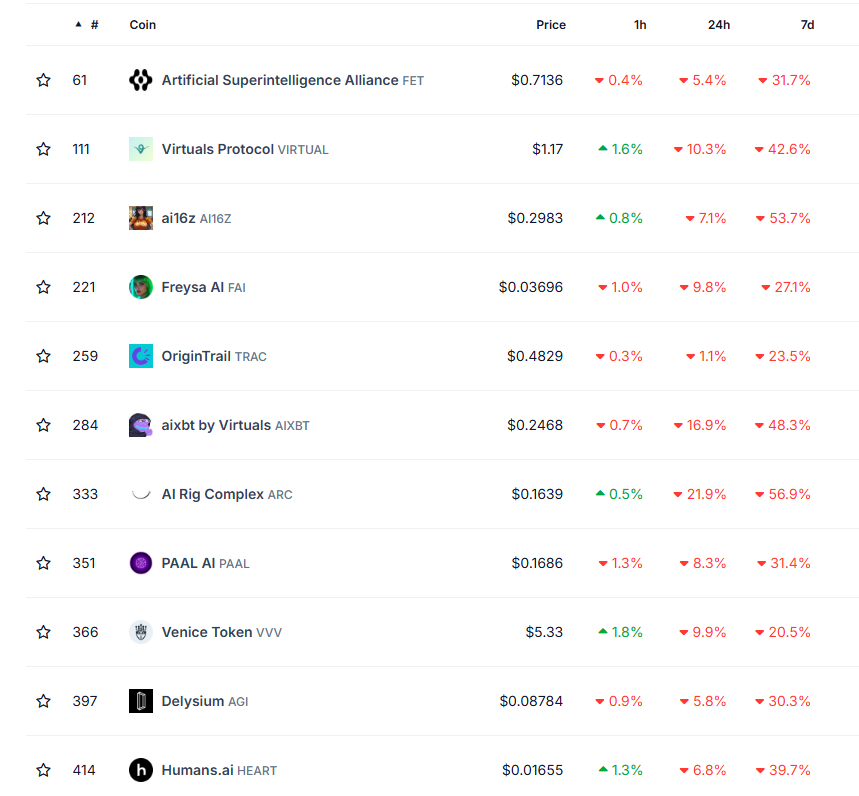
VIRTUAL, once the dominant artificial intelligence protocol, briefly surpassed major players like TAO, FET, and RENDER when its market cap peaked at $4.6 billion on January 1.
However, since then, it has faced a steep decline, with its valuation now sitting at just $811 million. With this downturn, only five crypto AI agents cryptos still hold a market cap above $300 million, and just 15 remain above the $100 million mark, showing how deep the correction has been across the sector.
Solana Is Still the Leader in Crypto AI Agents
Solana remains the most dominant chain in the crypto AI agents sector, with its AI-related coins holding a combined market cap of $3.2 billion.
However, this dominance has taken a hit, with the total value dropping 18.6% in the last 24 hours as the sector experiences a broad correction.
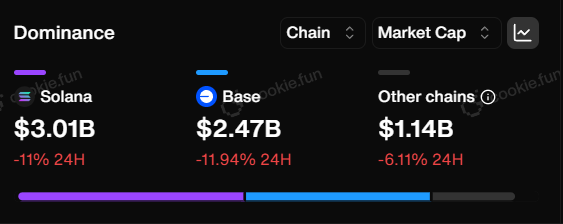
Base chain follows as the second-largest player, with its crypto AI agents coins collectively valued at $2.74 billion. Coins like VIRTUAL, TOSHI, FAI, and AIXBT have been key drivers of its growth in the sector.
Interestingly, Ethereum is notably absent from the top ranks, while other chains collectively account for just $1.19 billion in market cap.
Only two of the top 15 coins are outside of Solana and Base: ChainGPT (CGPT), which operates on BNB and currently holds a market cap of $118 million, and TURBO, which operates on Ethereum and has a market cap of $265 million.
Can Crypto AI Agents Regain Their Strong Momentum?
The growth of crypto AI agents has significantly slowed down after a surge in January. Between January 7 and January 24, their number increased from 1,250 to 1,387, marking an 11% rise.
However, since then, growth has nearly stalled, with only 13 new AI agents added, representing less than a 1% increase. This slowdown suggests that interest in launching new crypto AI agents are fading, potentially signaling a cooling phase in the sector.
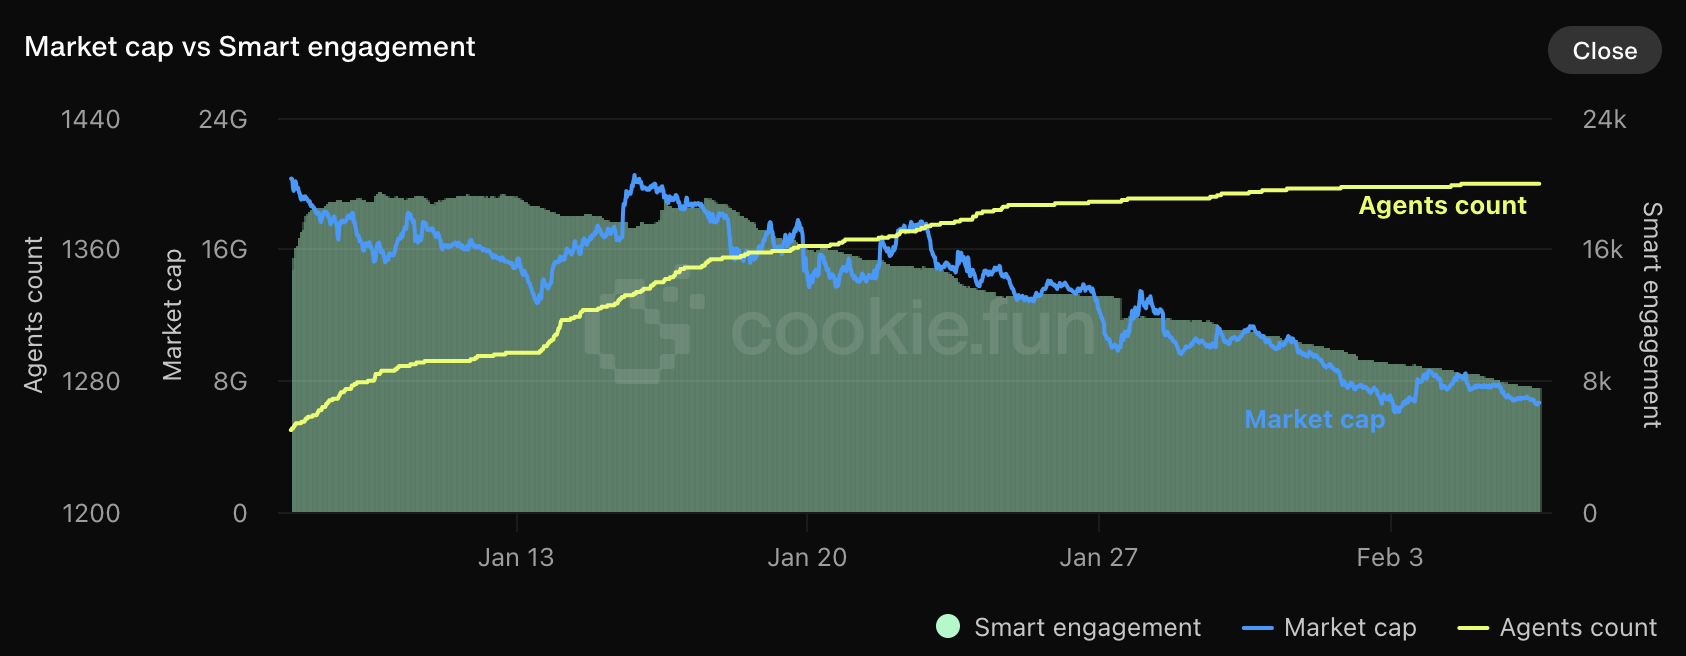
At the same time, engagement within the ecosystem has dropped sharply, with the number of smart accounts interacting with these projects falling from 19,069 on January 17 to just 7,541 now – a staggering 60% decline.
This drop in activity highlights weakening enthusiasm, as fewer users appear to be trading or utilizing these agents.
With both new project creation and user participation declining, regaining strong momentum in the near term appears challenging unless renewed interest or market catalysts emerge.
Disclaimer
In line with the Trust Project guidelines, this price analysis article is for informational purposes only and should not be considered financial or investment advice. BeInCrypto is committed to accurate, unbiased reporting, but market conditions are subject to change without notice. Always conduct your own research and consult with a professional before making any financial decisions. Please note that our Terms and Conditions, Privacy Policy, and Disclaimers have been updated.

Hedera (HBAR) price has been struggling to break above $0.25, reinforcing the ongoing bearish momentum. Its market cap now stands at $8.7 billion, with technical indicators pointing to continued downside risks.
The ADX confirms that the current downward trend remains strong, while the Ichimoku Cloud and EMA structures suggest further weakness. Unless key resistance levels are broken, HBAR remains in a vulnerable position, with the potential for deeper corrections ahead.
Hedera DMI Suggests Selling Pressure Is Easing
Hedera ADX is currently at 41.1, having remained above 40 for the past three days and peaking at 44.1 on February 3. The Average Directional Index (ADX) measures trend strength, with readings above 25 indicating a strong trend and lower values suggesting weakness.
While it does not indicate direction, HBAR’s high ADX confirms that its ongoing bearish trend has been strong over recent days.
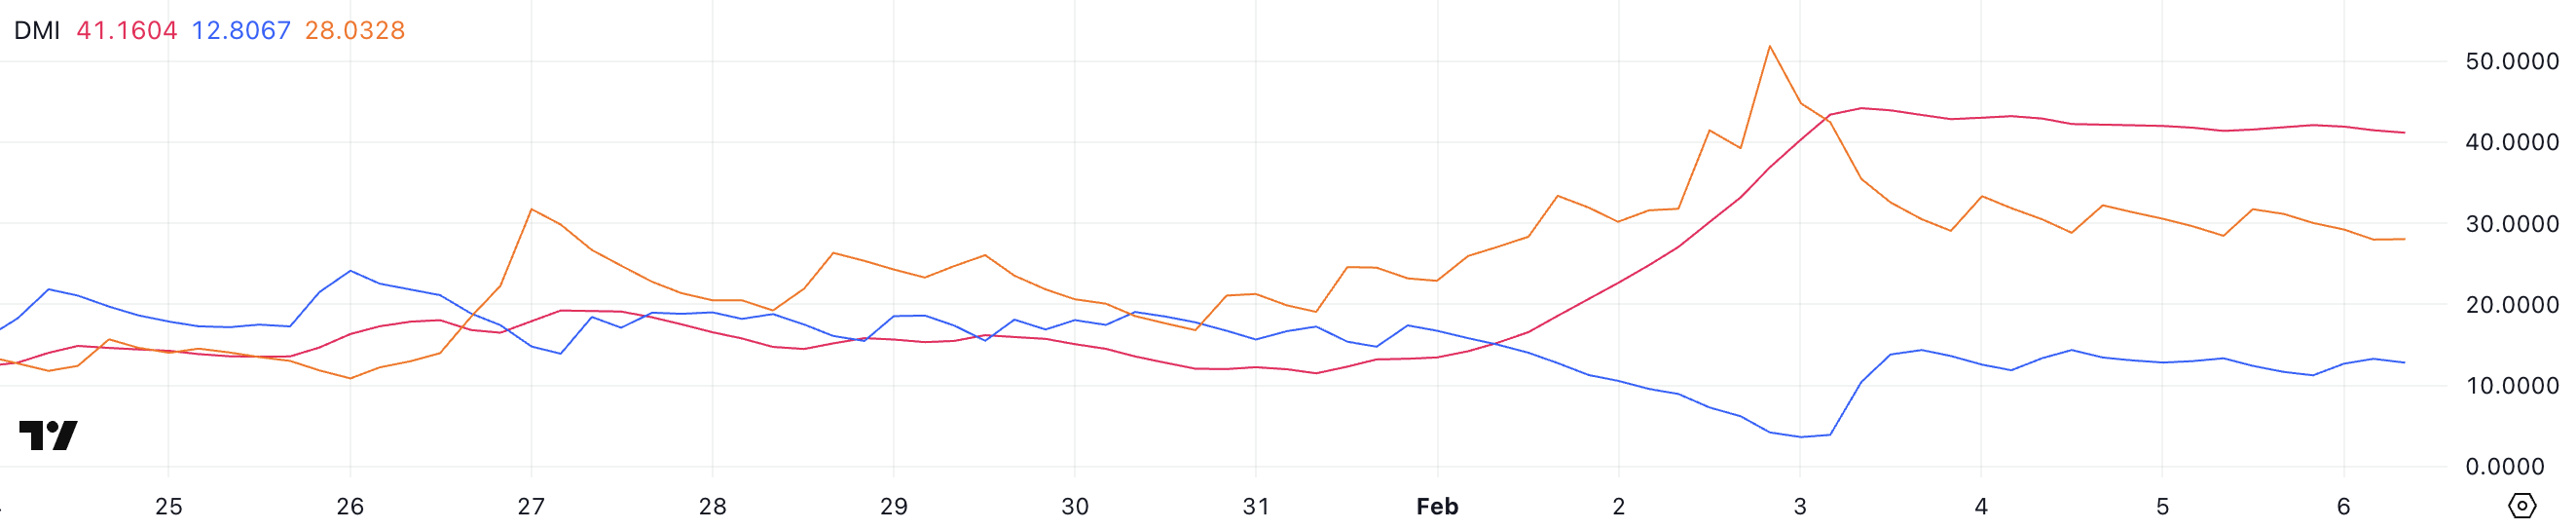
The +DI has climbed to 12.8 from 3.9 three days ago, stabilizing between 11 and 14, while the -DI has dropped to 28 from 44.7, hovering between 28 and 33.
This shift suggests selling pressure is easing slightly, but Hedera buyers have not gained enough strength to reverse the trend. With ADX still above 40, the downtrend remains intact, though the slowing momentum could indicate a potential consolidation phase before the next move.
HBAR Ichimoku Cloud Shows a Bearish Setup
The Ichimoku Cloud chart for HBAR shows a bearish outlook, with the price trading below the cloud. The red cloud ahead suggests continued downward pressure, as it indicates that future resistance remains strong.
The conversion line (blue) is slightly below the baseline (red), reinforcing short-term weakness and signaling that bearish momentum is still in control.
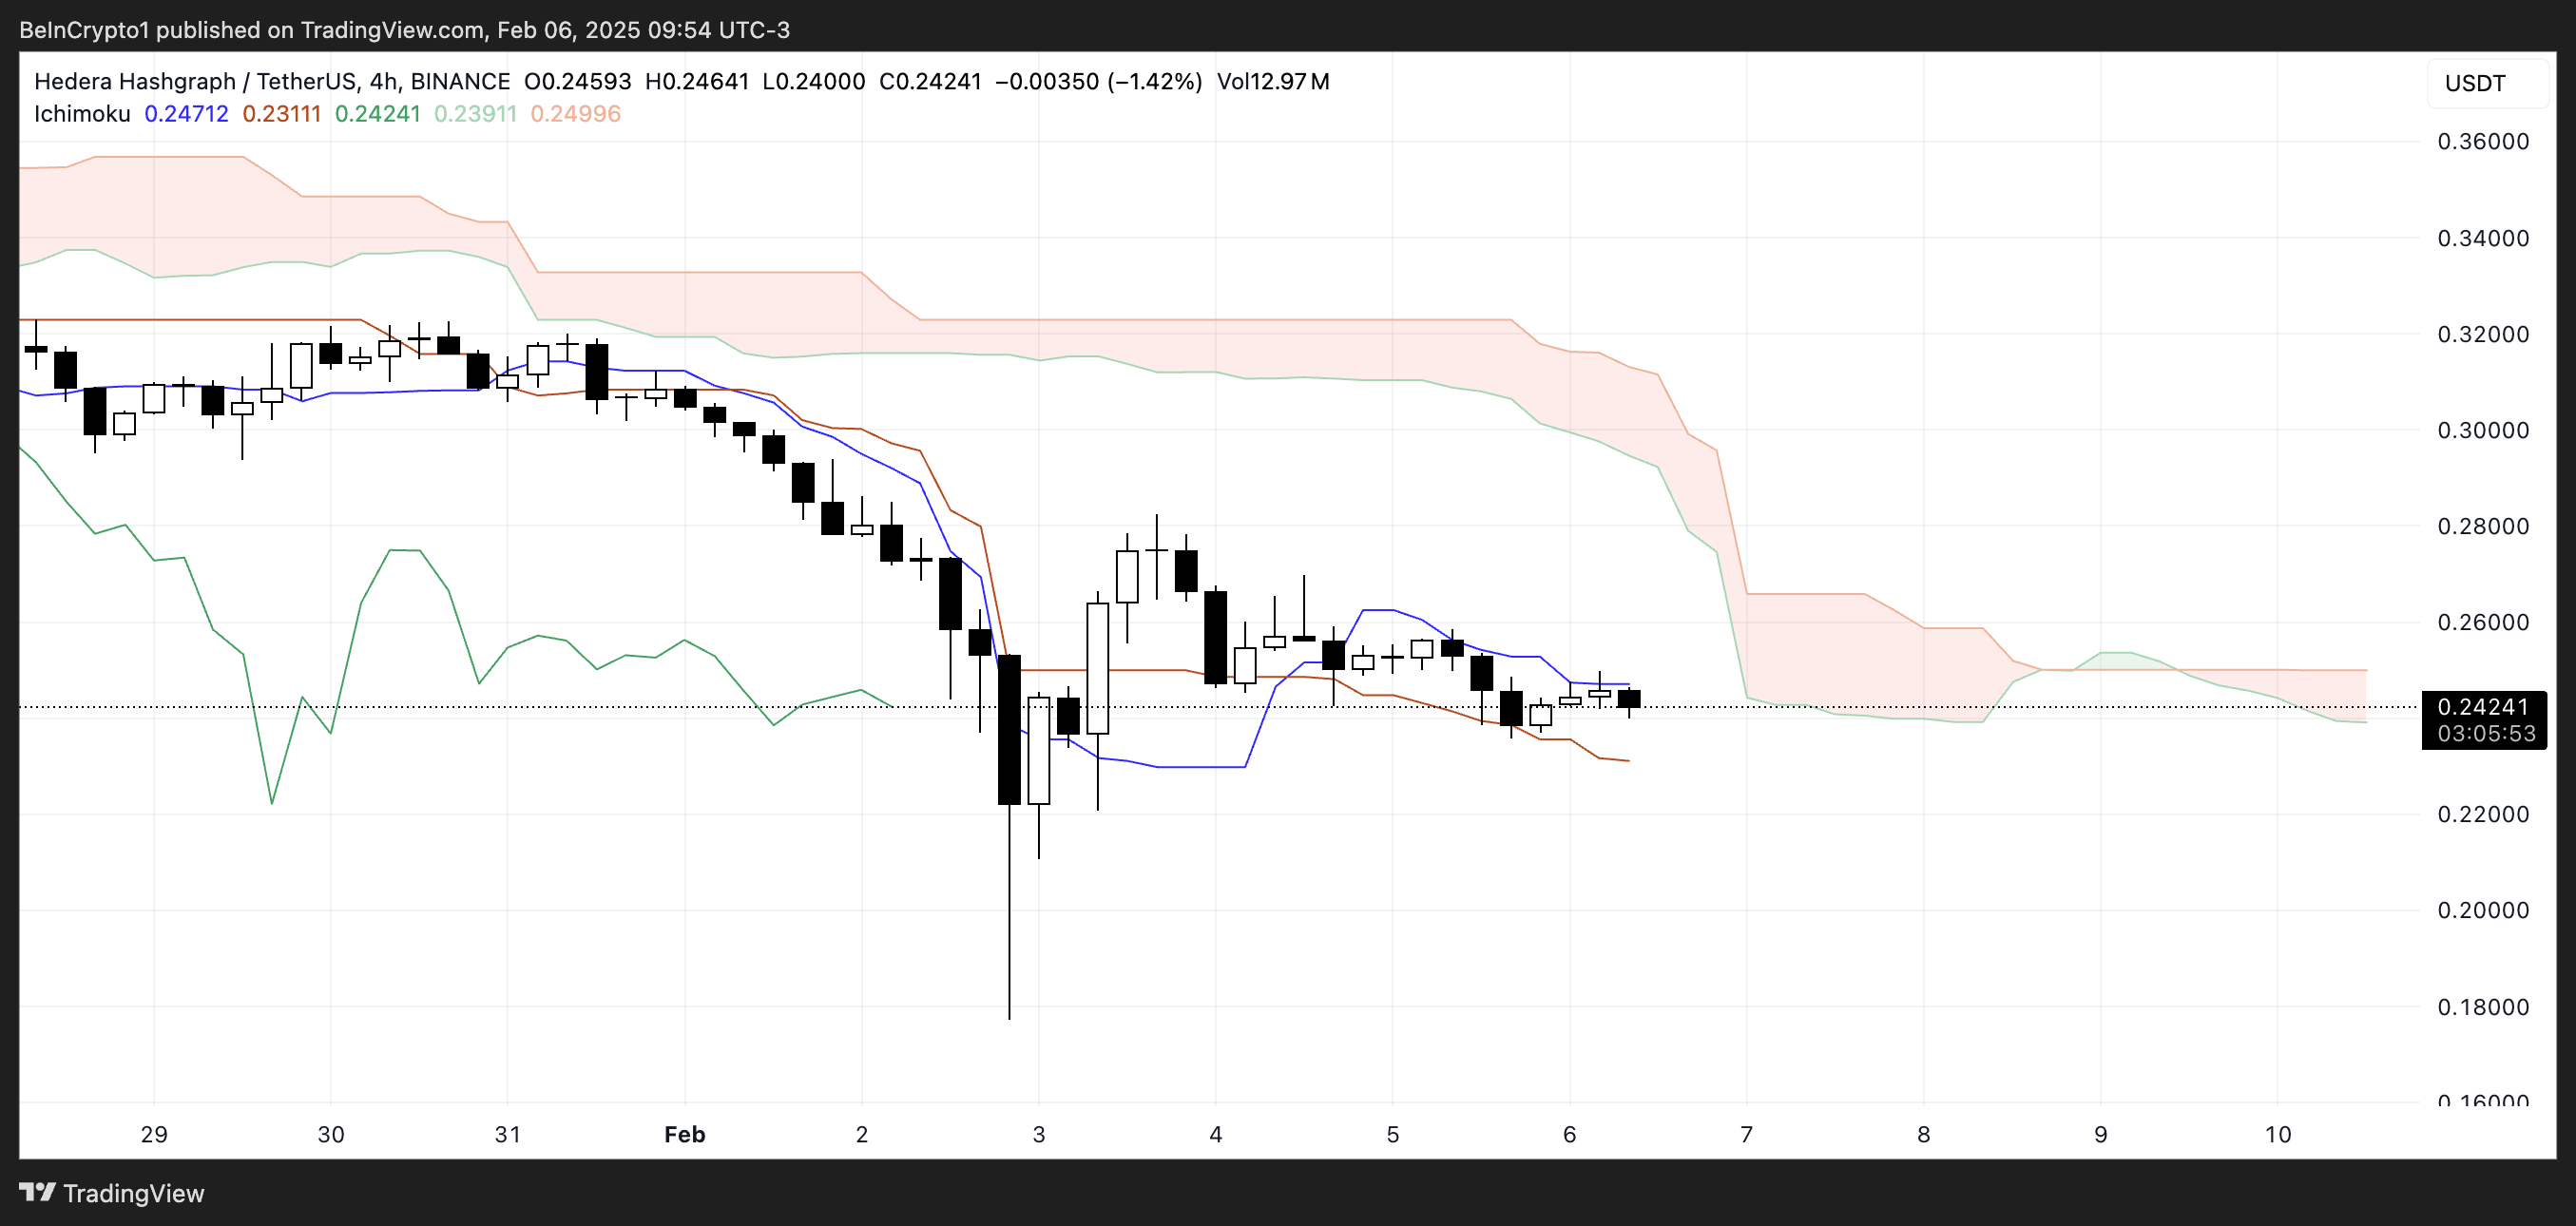
Additionally, the lagging span (green) is positioned below the price, confirming that the downtrend remains intact. The price has also been moving sideways within a tight range, struggling to gain upward momentum.
If the cloud continues expanding downward, it could indicate further bearish continuation, while a flattening baseline could suggest a potential slowdown in the current trend.
HBAR Price Prediction: Can Hedera Correct by 78% In February?
Hedera EMA lines show a clear bearish setup. Four days ago, a death cross formed as short-term EMAs remained below long-term ones. This indicates that the downtrend is still in play, and if it continues, Hedera price could test the $0.17 support.
A breakdown below this level could open the door for further declines to $0.12, and if bearish momentum persists, it could drop as low as $0.05, marking a 78% correction and its lowest level since November 12.
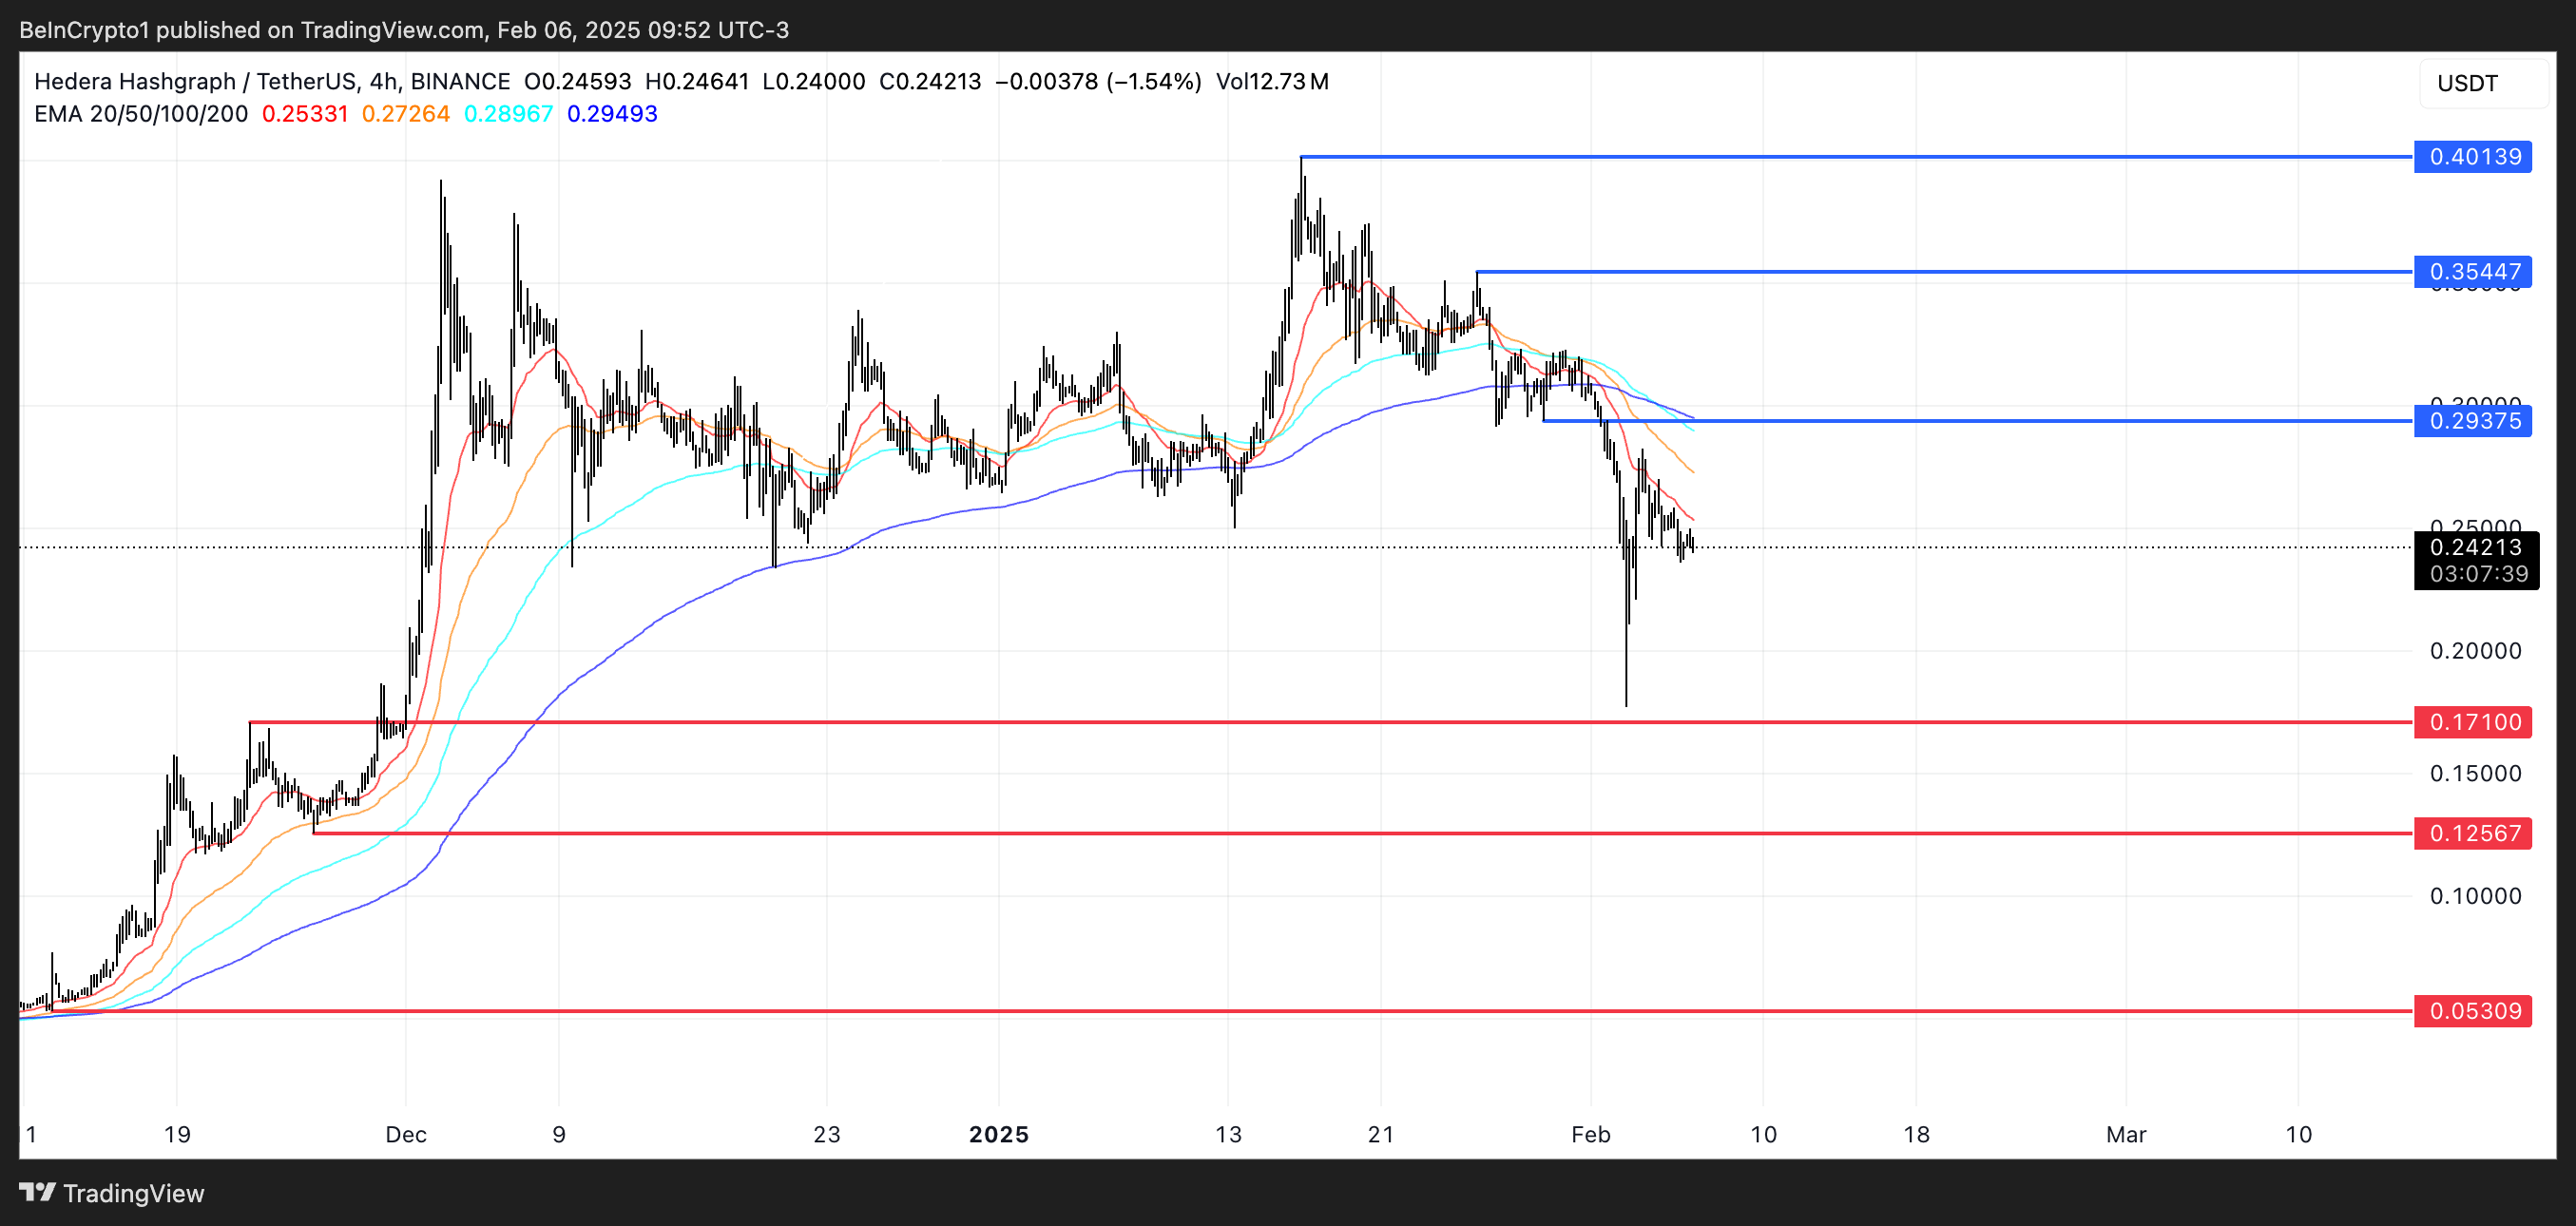
On the other hand, if the trend reverses, HBAR price could test the $0.29 resistance, which would be the first sign of a potential recovery.
A breakout above this level could push the price toward $0.35. If bullish momentum strengthens, HBAR could climb as high as $0.40, a possible 65% upside. However, until the EMAs shift to a more bullish alignment, the prevailing trend remains bearish.
Disclaimer
In line with the Trust Project guidelines, this price analysis article is for informational purposes only and should not be considered financial or investment advice. BeInCrypto is committed to accurate, unbiased reporting, but market conditions are subject to change without notice. Always conduct your own research and consult with a professional before making any financial decisions. Please note that our Terms and Conditions, Privacy Policy, and Disclaimers have been updated.

Meme Coin Launches and ETFs Hit Record

Crypto AI Agents Tokens Drop 13% as New Launches Slow Down

Ethereum Could Crash To $1,700 If This Support Fails, Analyst Says
Why Is Bitcoin, XRP, Solana & Dogecoin Price Dropping?

HBAR Price Struggles Under $0.25 as Bears Dominate

US SEC Seeks Public Comments on Grayscale’s Litecoin ETF Proposal

2.52 Million Altcoins Are Ruining Crypto’s Future

Animoca Brands Valuation Tanks 75% In Two Years, Here’s Why

Crypto exchange BingX hacked for $43 million

Are The Big Players Losing Interest?

Hong Kong’s Securities Association Tips Authorities On Crypto Self-Regulation

Coinbase cbBTC Set to go Live on Solana
2.52 Million Altcoins Are Ruining Crypto’s Future
Animoca Brands Valuation Tanks 75% In Two Years, Here’s Why
Crypto exchange BingX hacked for $43 million
Are The Big Players Losing Interest?
Hong Kong’s Securities Association Tips Authorities On Crypto Self-Regulation
Coinbase cbBTC Set to go Live on Solana
-

 Ethereum15 hours ago
Cboe seeks US SEC nod for spot Ethereum ETF options
-
 Altcoin22 hours ago
BTC Holds $97K, Altcoins Flux, FTT Up 8%
-

 Market21 hours ago
BlackRock to Launch Bitcoin ETP in Switzerland for EU Market
-

 Market20 hours ago
XRP Price Struggles to Keep Pace: What’s Holding It Back?
-

 Market18 hours ago
Dogizen ICO hits $4m as Standard Chartered predicts BTC at $500k
-
 Market24 hours ago
FTT Price Rises as FTX Sets Repayment Date in February
-
 Market23 hours ago
ONDO Price Stalls as Whales Reach All-Time Highs
-

 Market22 hours ago
Ethereum Price Sets Its Sights on Higher Levels: Can Bulls Maintain Momentum?