
Market
Bybit Returns to India After Paying $1 Million Fine

Bybit is resuming operations in India after registering in accordance with local regulations and paying a $1 million fine. The exchange temporarily left in January, citing changing licensing requirements.
Indian political figures have recently advocated for liberalizing the nation’s crypto laws, and Bybit wants to contribute. It joined a local Web3 association and partnered with blockchain societies at several major universities.
Bybit Returns to India
Bybit, the second-largest crypto exchange in terms of daily trading volume, is resuming services in India. The firm temporarily suspended trading services in the country around a month ago, citing changing regulations.
Specifically, India’s Financial Intelligence Unit (FIU-IND) required that Bybit receive licensing to prove compliance and pay a $1 million fee. According to a new press release, this has now been achieved:
“Bybit is committed to operating within the regulatory framework of India and takes its compliance obligations seriously. We have been working diligently with the FIU-IND to address their concerns and ensure full adherence to the Prevention of Money Laundering Act (“PMLA”) and associated regulations,” the press release claimed.
Bybit’s CEO also shared these developments on social media. This is a rather positive development for the crypto exchange, as India remains one of its key markets in Asia.
In addition, Bybit continues to face several regulatory hurdles worldwide. In November, Japan warned Bybit to register its operations, and customers in France can no longer withdraw any assets.
Still, Bybit isn’t the only exchange with disputes with India. Binance recently owed the Indian government $85 million in taxes, and other exchanges like WazirX faced similar scrutiny.
Also, the current government does not seem to have a very pro-crypto vision. Last year, Indian regulators strongly advocated banning Bitcoin and other assets to favor the nation’s CBDC.
However, this attitude may be changing. Earlier this week, India’s Economic Affairs Secretary suggested loosening the country’s crypto restrictions, claiming that cryptoassets “don’t believe in borders.”
“Bybit officially registers with India’s financial regulator and settles pending fines. Full operations license expected soon. Another W for crypto adoption in India, but get ready for that sweet 30% tax + 1% TDS,” wrote Budhil Vyas, a local crypto influencer.
The industry is dramatically growing worldwide, and India doesn’t want to lose out. This might help explain Bybit’s speedy return.
In any event, it’s difficult to predict big-picture political changes like that from here. For now, Bybit is back in business and is carrying out a few endeavors to reach India’s crypto community.
These include partnering with several university-based blockchain societies, becoming a member of the Bharat Web3 Association, conducting workshops and hackathons, and more.
Disclaimer
In adherence to the Trust Project guidelines, BeInCrypto is committed to unbiased, transparent reporting. This news article aims to provide accurate, timely information. However, readers are advised to verify facts independently and consult with a professional before making any decisions based on this content. Please note that our Terms and Conditions, Privacy Policy, and Disclaimers have been updated.


Hedera (HBAR) price has been struggling to break above $0.25, reinforcing the ongoing bearish momentum. Its market cap now stands at $8.7 billion, with technical indicators pointing to continued downside risks.
The ADX confirms that the current downward trend remains strong, while the Ichimoku Cloud and EMA structures suggest further weakness. Unless key resistance levels are broken, HBAR remains in a vulnerable position, with the potential for deeper corrections ahead.
Hedera DMI Suggests Selling Pressure Is Easing
Hedera ADX is currently at 41.1, having remained above 40 for the past three days and peaking at 44.1 on February 3. The Average Directional Index (ADX) measures trend strength, with readings above 25 indicating a strong trend and lower values suggesting weakness.
While it does not indicate direction, HBAR’s high ADX confirms that its ongoing bearish trend has been strong over recent days.
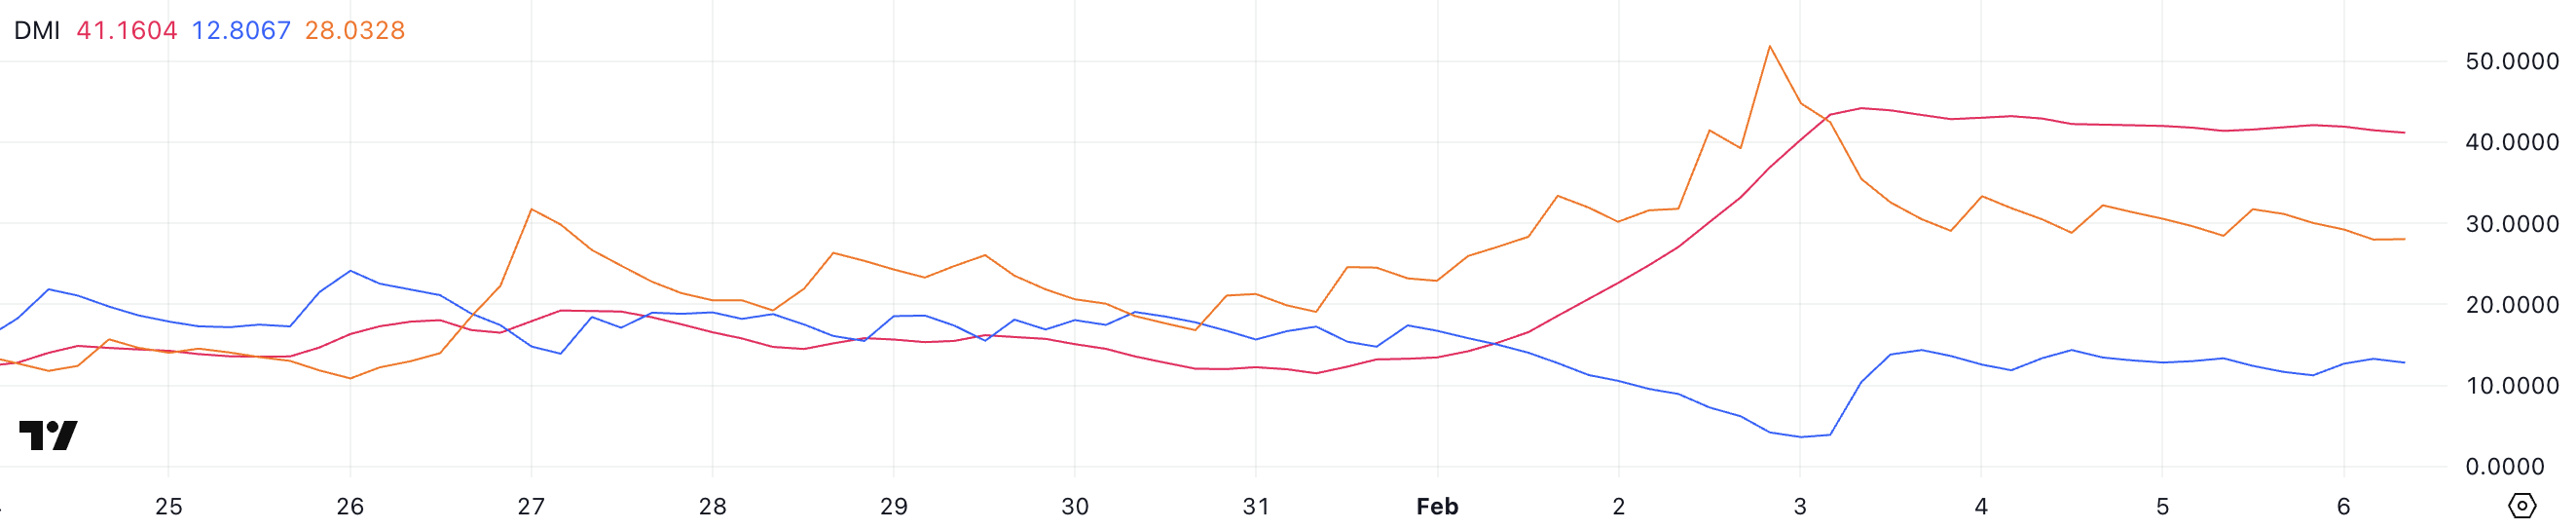
The +DI has climbed to 12.8 from 3.9 three days ago, stabilizing between 11 and 14, while the -DI has dropped to 28 from 44.7, hovering between 28 and 33.
This shift suggests selling pressure is easing slightly, but Hedera buyers have not gained enough strength to reverse the trend. With ADX still above 40, the downtrend remains intact, though the slowing momentum could indicate a potential consolidation phase before the next move.
HBAR Ichimoku Cloud Shows a Bearish Setup
The Ichimoku Cloud chart for HBAR shows a bearish outlook, with the price trading below the cloud. The red cloud ahead suggests continued downward pressure, as it indicates that future resistance remains strong.
The conversion line (blue) is slightly below the baseline (red), reinforcing short-term weakness and signaling that bearish momentum is still in control.
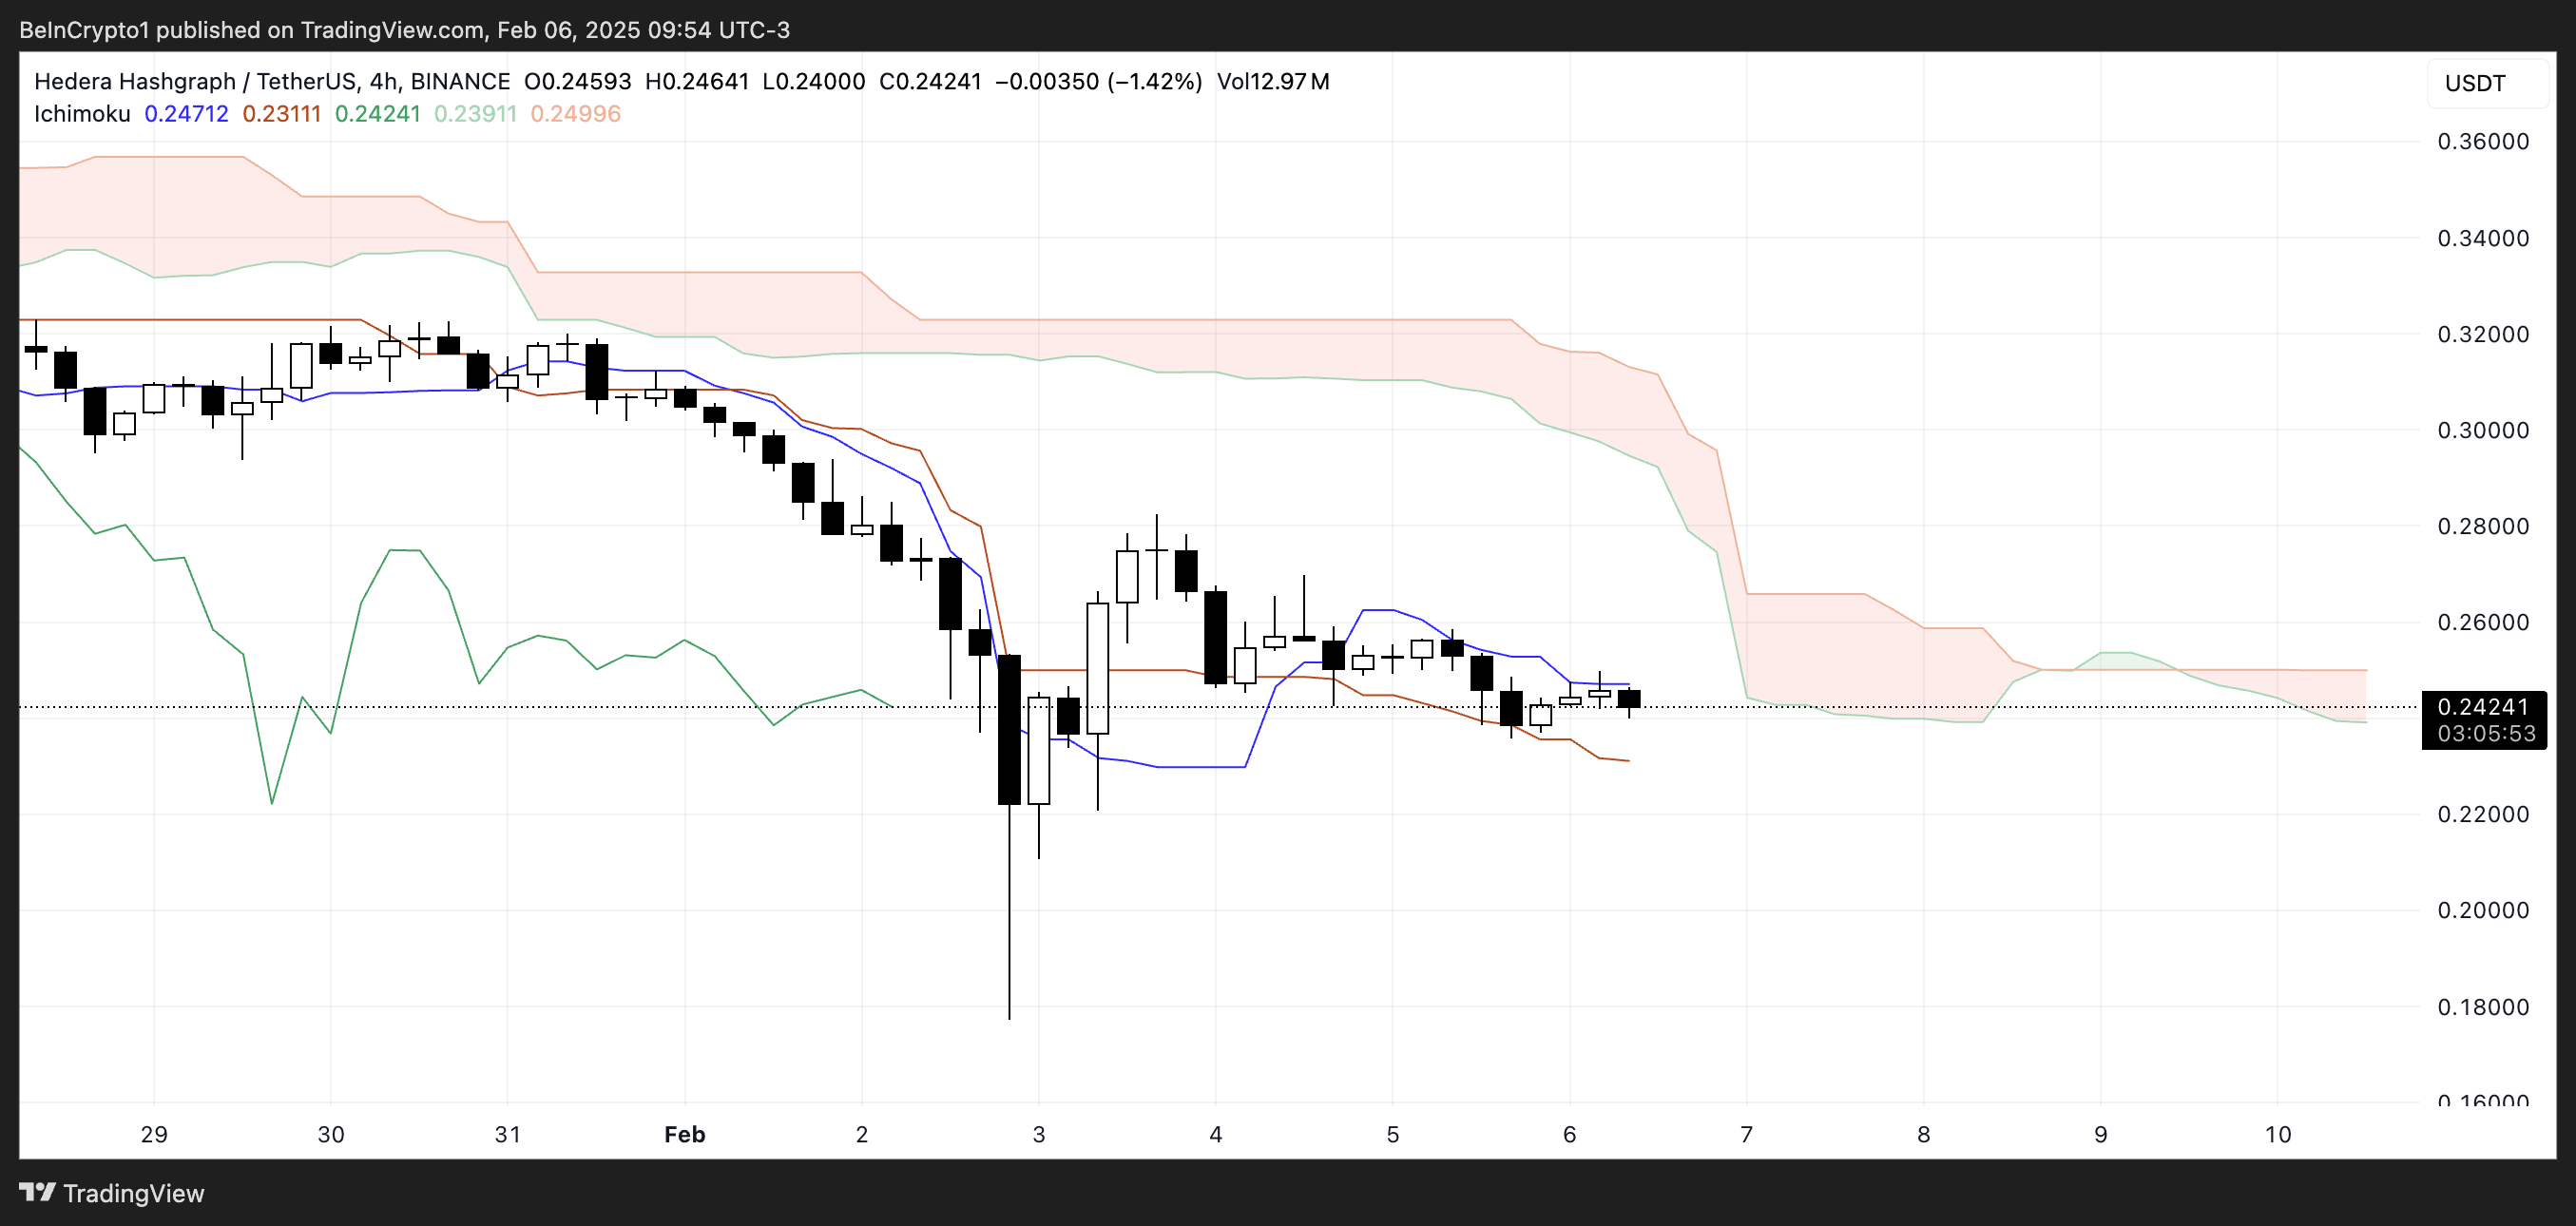
Additionally, the lagging span (green) is positioned below the price, confirming that the downtrend remains intact. The price has also been moving sideways within a tight range, struggling to gain upward momentum.
If the cloud continues expanding downward, it could indicate further bearish continuation, while a flattening baseline could suggest a potential slowdown in the current trend.
HBAR Price Prediction: Can Hedera Correct by 78% In February?
Hedera EMA lines show a clear bearish setup. Four days ago, a death cross formed as short-term EMAs remained below long-term ones. This indicates that the downtrend is still in play, and if it continues, Hedera price could test the $0.17 support.
A breakdown below this level could open the door for further declines to $0.12, and if bearish momentum persists, it could drop as low as $0.05, marking a 78% correction and its lowest level since November 12.
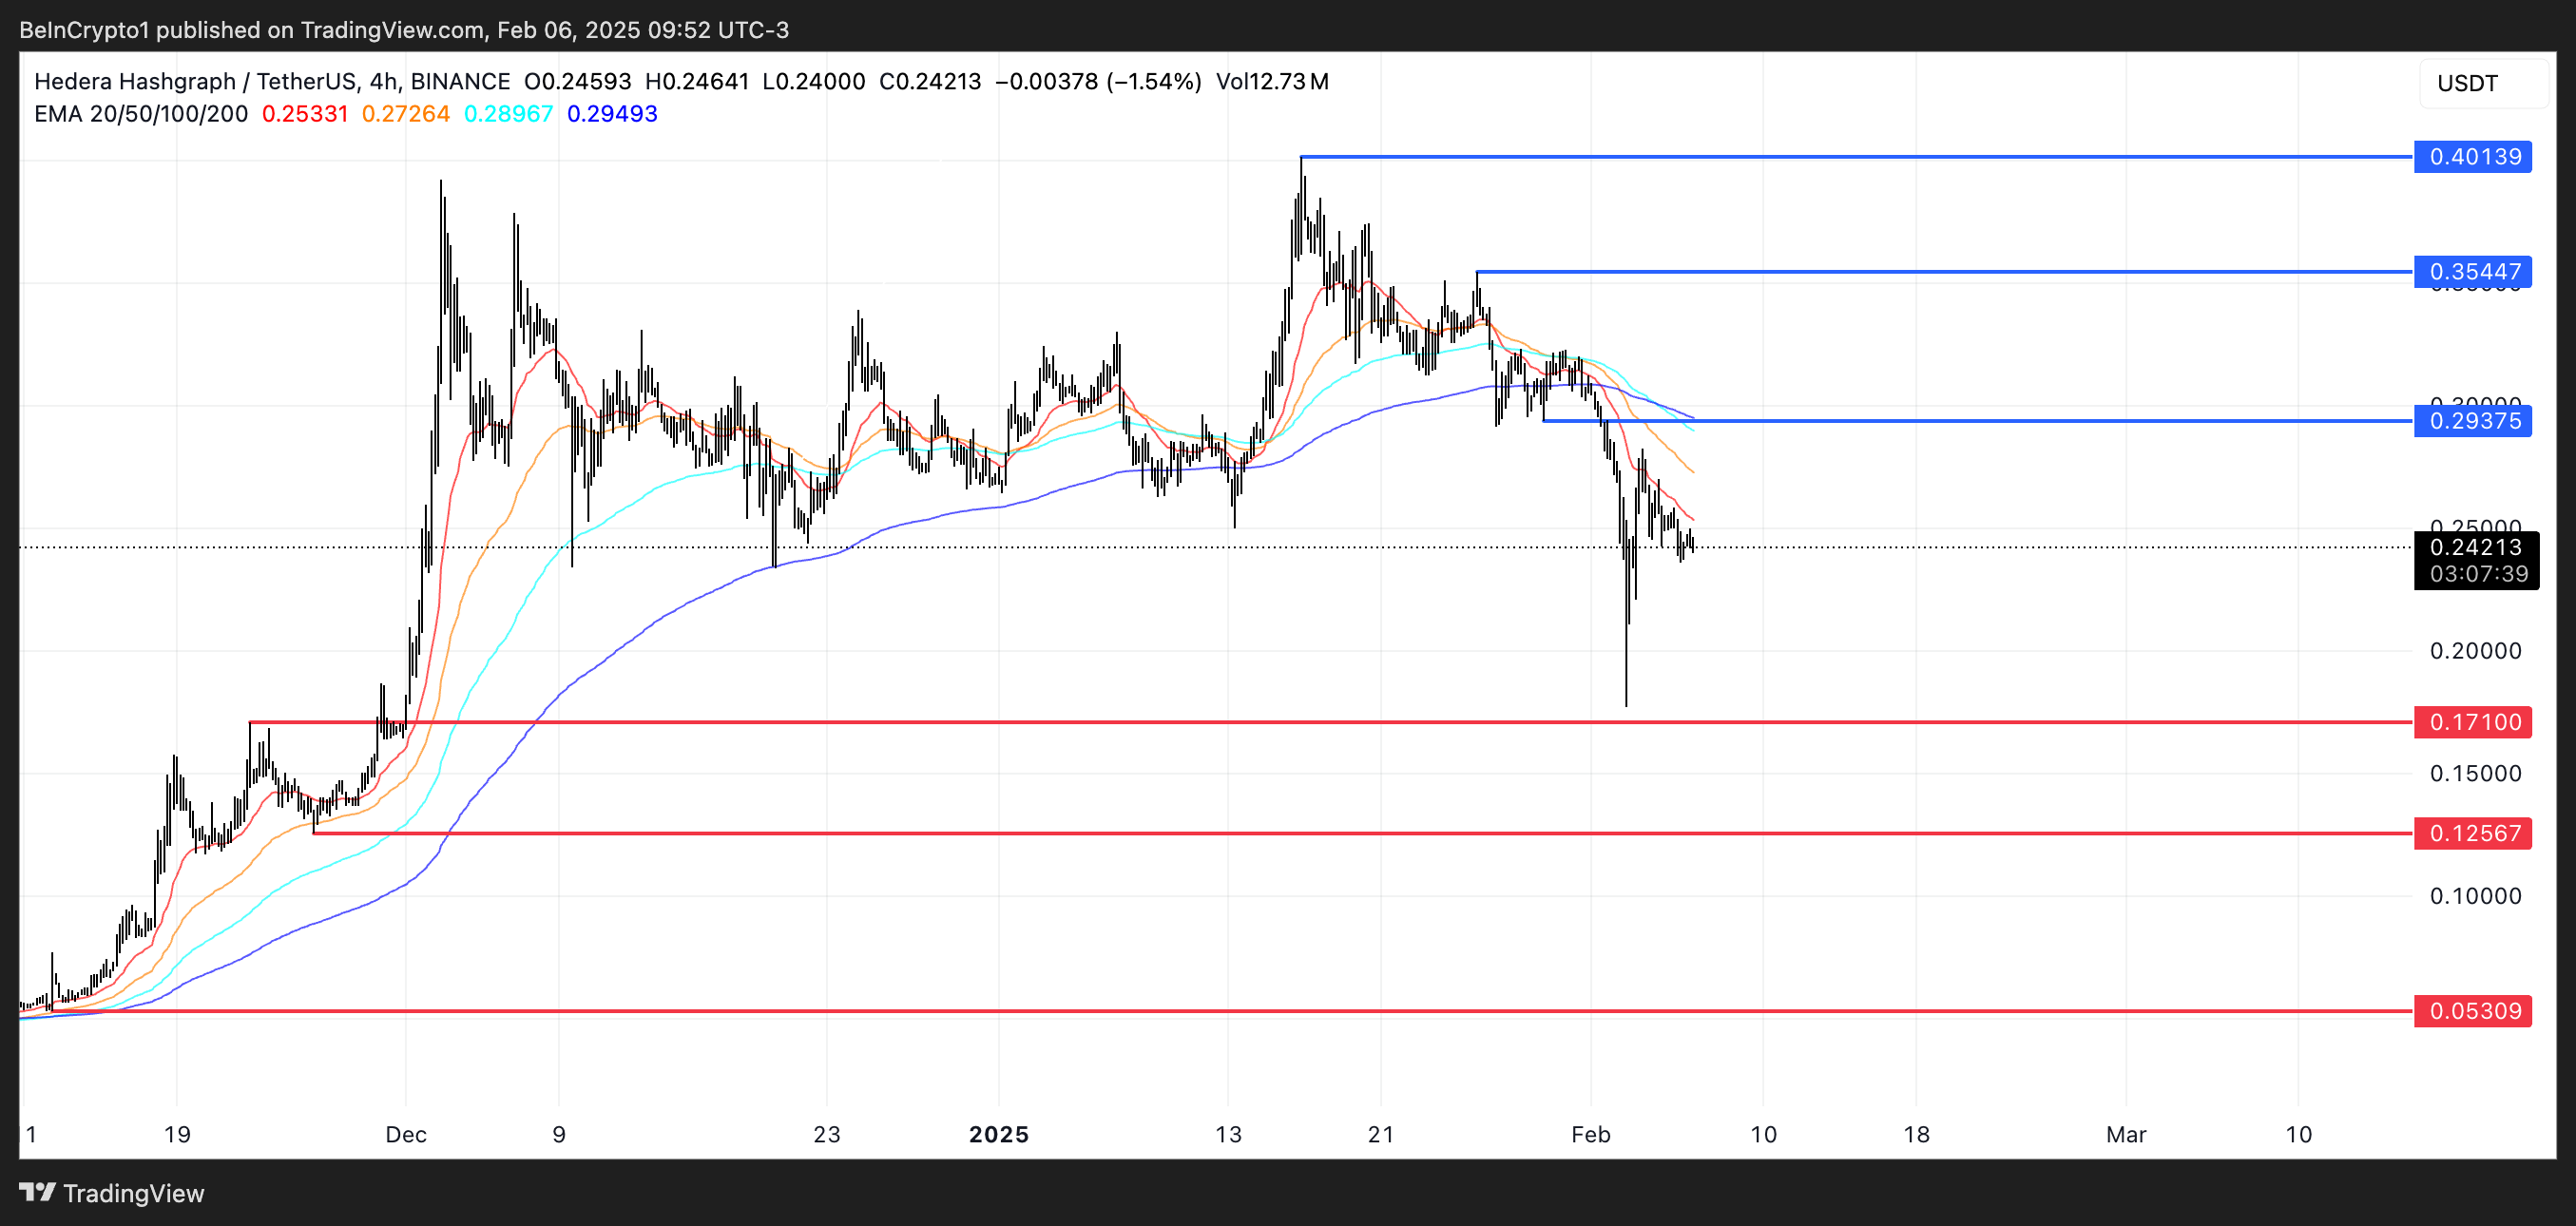
On the other hand, if the trend reverses, HBAR price could test the $0.29 resistance, which would be the first sign of a potential recovery.
A breakout above this level could push the price toward $0.35. If bullish momentum strengthens, HBAR could climb as high as $0.40, a possible 65% upside. However, until the EMAs shift to a more bullish alignment, the prevailing trend remains bearish.
Disclaimer
In line with the Trust Project guidelines, this price analysis article is for informational purposes only and should not be considered financial or investment advice. BeInCrypto is committed to accurate, unbiased reporting, but market conditions are subject to change without notice. Always conduct your own research and consult with a professional before making any financial decisions. Please note that our Terms and Conditions, Privacy Policy, and Disclaimers have been updated.
Cardano (ADA) price has dropped over 25% in the last seven days, bringing its market cap down to $26 billion. Trading volume has also fallen 35% in the past 24 hours, now sitting at $766 million, signaling decreased market activity.
Meanwhile, whale addresses have stabilized after a brief surge, suggesting a period of balance as large holders await clearer market signals.
Cardano ADX Shows the Current Downtrend Is Still Strong
Within five days, Cardano’s Average Directional Index (ADX) climbed from 11.2 to 41.6, indicating a strong trend that coincided with a 20% price correction.
ADX measures trend strength, not direction, with readings above 25 indicating a strong trend and below suggesting weakness. Given ADA’s high ADX, the recent downtrend has been powerful, reinforcing bearish momentum.
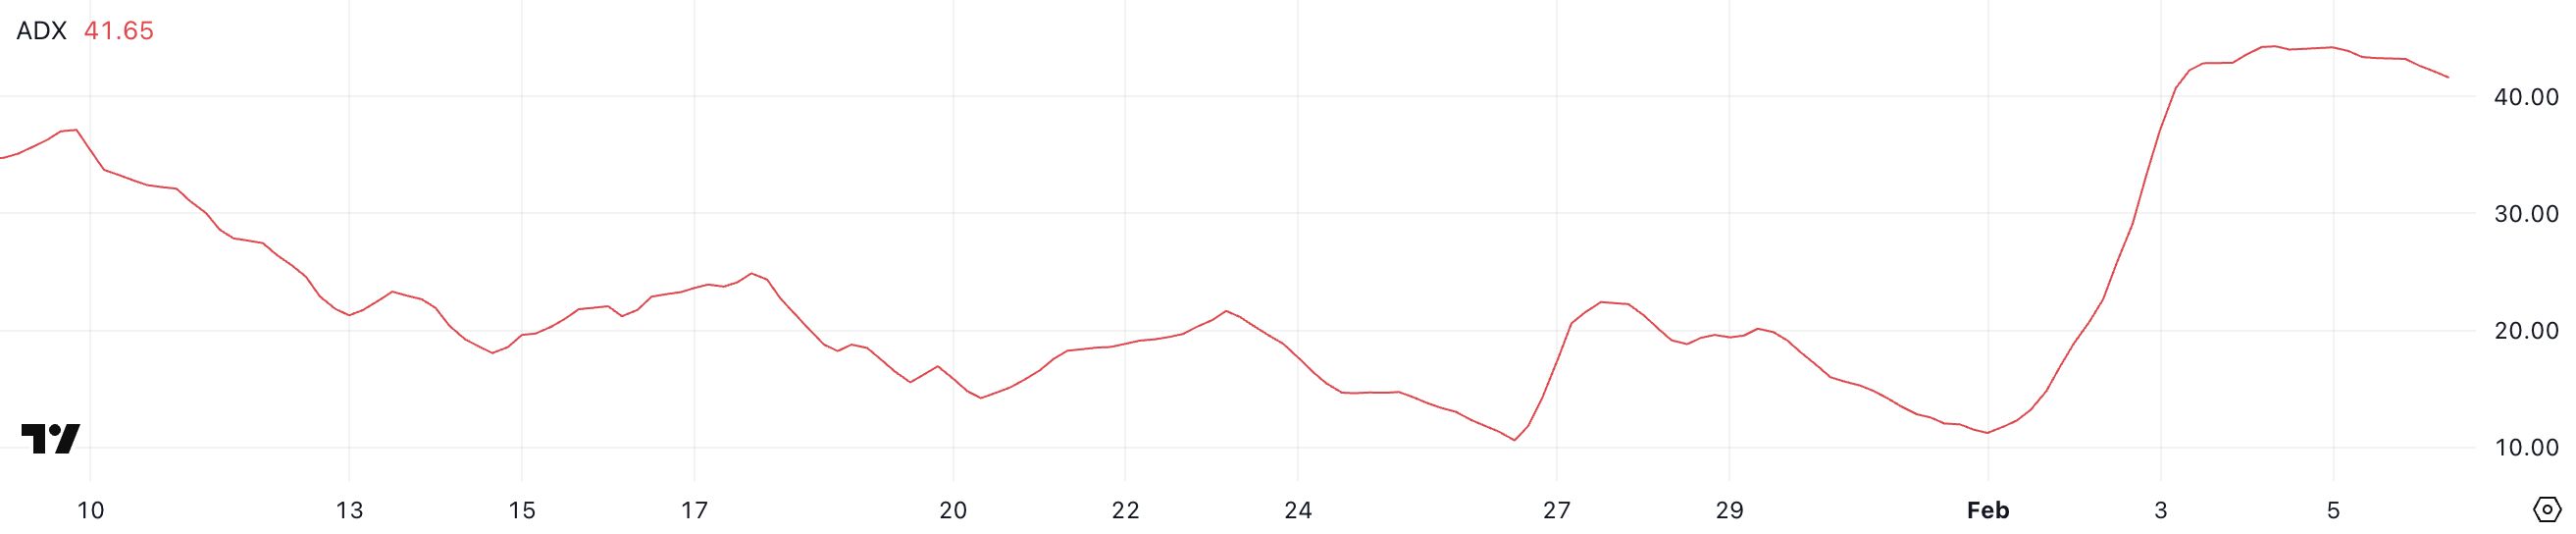
Despite still being in a downtrend, ADA’s ADX has remained stable around 41 and 42 for two days and slightly declined between yesterday and today.
This suggests the trend may be losing intensity, though it hasn’t reversed and is still very strong. If ADX continues to drop while ADA price steadies, sellers could be weakening, possibly leading to consolidation.
However, with no clear reversal, downside risks remain.
Cardano Whales Has Been Stable For Three Weeks
The number of Cardano whale addresses, holding between 1,000,000 and 10,000,000 ADA, jumped from 2,453 to 2,483 between January 9 and January 14. However, after that spike, the number declined slightly and has remained stable over the past few weeks.
Tracking these whales is important because their accumulation or distribution can signal shifts in the market. A rising number of whale addresses often suggests confidence and potential price support, while a decline may indicate selling pressure.
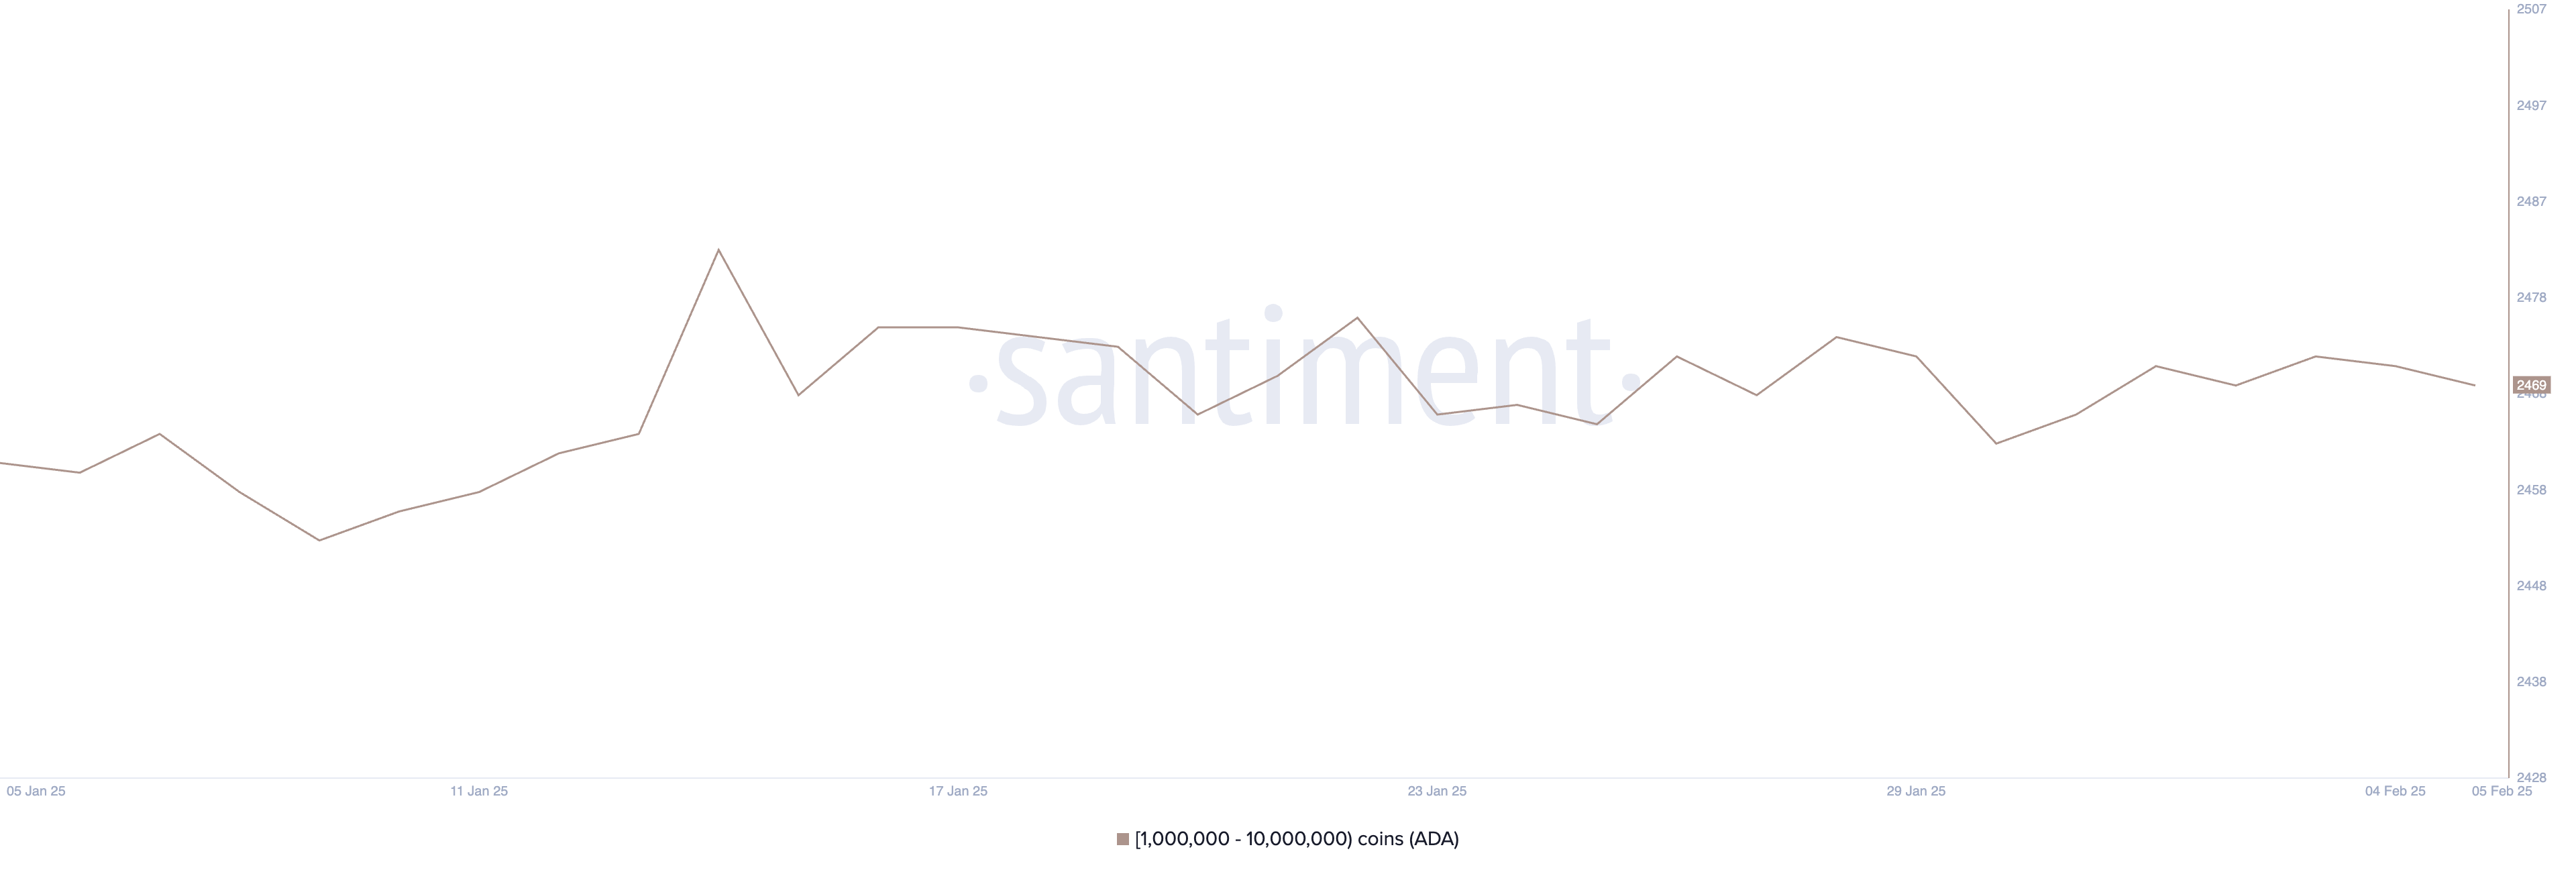
Currently, ADA whale addresses are at 2,469, hovering around this level with minor fluctuations for the past three weeks. This suggests a period of balance. Large holders are neither aggressively accumulating nor selling, possibly focusing their investments on other coins for possible gains in February.
If stability continues, it could mean ADA price is in a consolidation phase, with whales waiting for clearer market direction before making major moves.
ADA Price Prediction: A 55% Upside or Downside?
Cardano price is currently trading between support at $0.65 and resistance at $0.82, with its EMA lines showing a bearish setup—short-term EMAs are positioned below long-term ones.
This suggests that downward momentum remains dominant, reinforcing the idea that ADA is still in a downtrend.
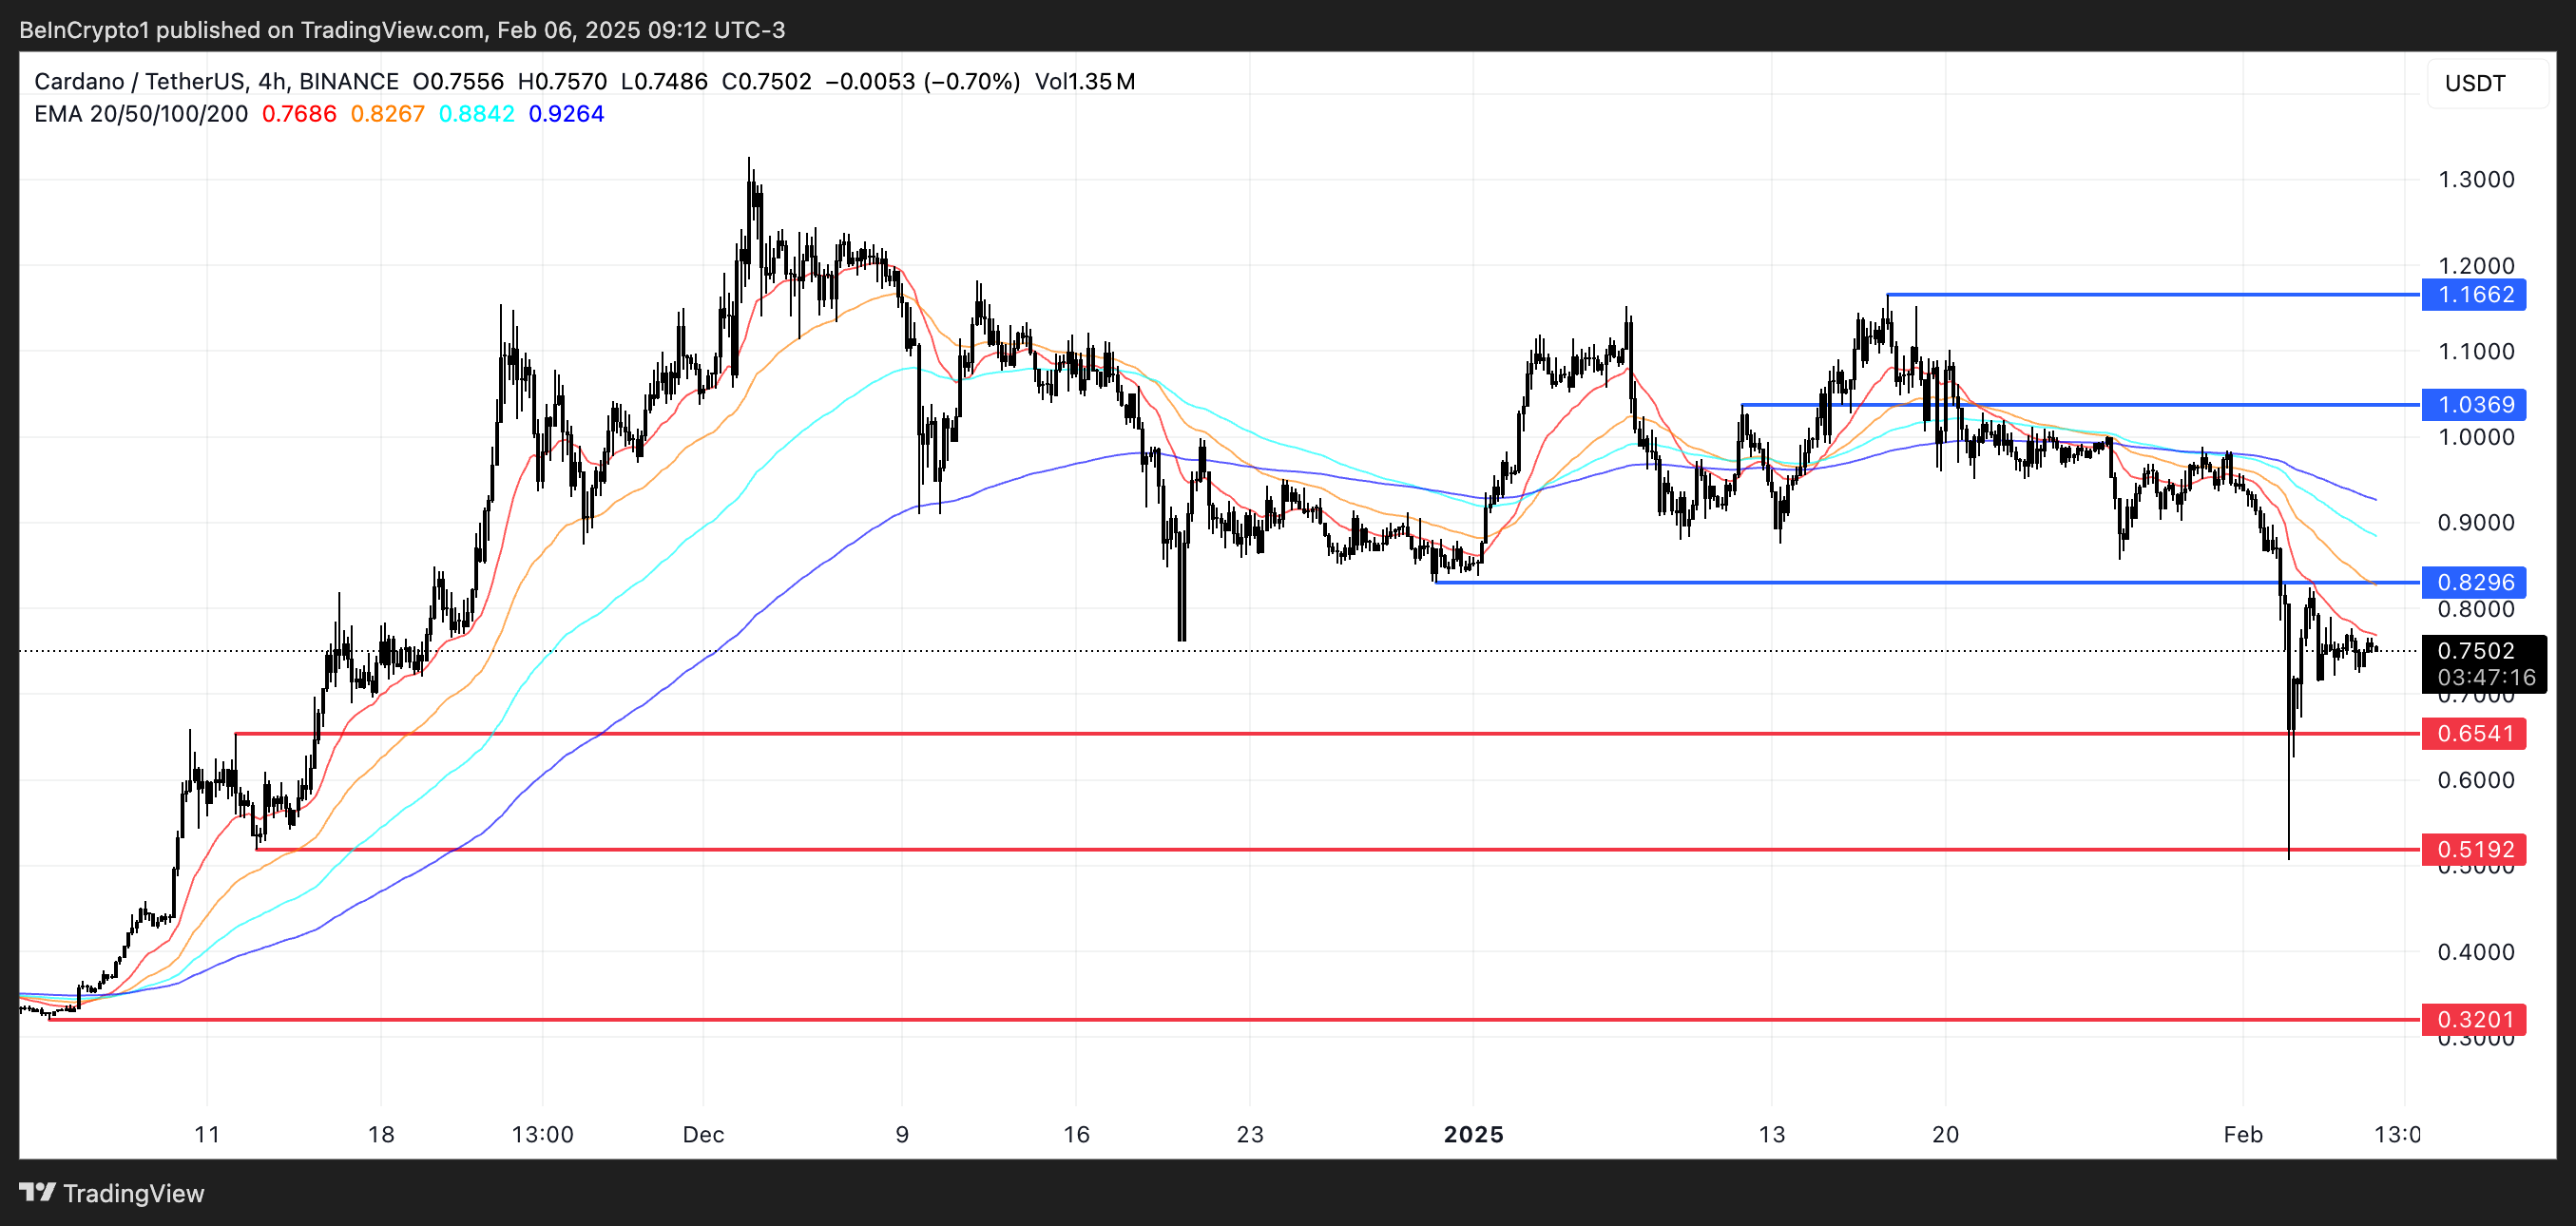
If an uptrend emerges, ADA could test the $0.82 resistance, and a breakout above it could open the door for a move toward $1.03 or even $1.16, a potential 55% upside.
However, if the downtrend continues and ADA price loses the $0.65 support, it could drop further to $0.51 or even $0.32, marking a 55% decline and reaching its lowest levels since December 10, 2024.
Disclaimer
In line with the Trust Project guidelines, this price analysis article is for informational purposes only and should not be considered financial or investment advice. BeInCrypto is committed to accurate, unbiased reporting, but market conditions are subject to change without notice. Always conduct your own research and consult with a professional before making any financial decisions. Please note that our Terms and Conditions, Privacy Policy, and Disclaimers have been updated.
After a year of explosive price growth, the Solana based meme coin, BONK, has wiped out all of its 2024 gains, retracing approximately 76% from its peak. Despite this dramatic decline, a crypto analyst has suggested that this dip could be a strategic buying opportunity for investors rather than a cause for concern.
Solana‘s BONK Retraces 2024 Gains
The broader meme coin market has been experiencing a severe downturn, driven by the volatility and market changes caused by the recent Bitcoin price decline. Following United States (US) President Donald Trump’s trade war, meme coins like BONK, Dogecoin, Shiba Inu, and others crashed severely.
Related Reading
A recent chart analysis by a TradingView expert identified as ‘Cusdridge19523’ sheds light on the extent of Bonk’s severe decline. According to the analyst, Bonk has round-tripped virtually all of its gains from 2024, dropping over 76% from its most recent market peak.
This massive price crash marks the fourth major correction in the meme coin’s history. In 2024, Bonk experienced three significant price pullbacks that saw its price drop by more than 60%. At the beginning of the previous year, the meme coin fell 72.77% after reaching a local peak. Similarly, during the second quarter of 2024, BONK experienced a 74.2% price drop and declined again by 65.05% around the third quarter.
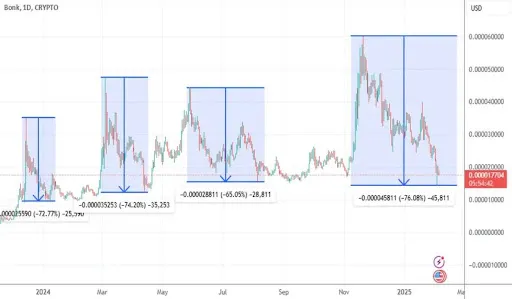
Its recent 76.08% in 2025 marks its highest crash compared to previous corrections in 2024. CoinMarketCap also reports that Bonks’ total gains for 2025 are about 78.82%. The meme coin experienced a gradual price drop to its current low, plummeting by 48.02% in one month and another 28.46% in the past week.
Currently, the BONK price is still in the red zone, having fallen by 1.28% in the last 24 hours. Its current price is $0.000018, aligning with past support levels and consolidation areas that triggered strong rebounds. The TradingView analyst has also revealed that the market may have to wait between 7 and 90 days for BONK to make a round trip and experience a potential price rebound.
Why Now Might Be A Good Time To Buy
As BONK reaches consolidation lows similar to past trends, the TradingView analyst believes its current price level presents an attractive buying opportunity for investors looking to take advantage of market dips. Historically, Bonk has shown a clear pattern of strong price reversals after sharp market corrections, giving investors more reason to believe that the token could once again deliver strong returns from market lows.
Related Reading
Additionally, the TradingView expert revealed that the broader crypto market outlook for 2025 is bullish, with speculation growing around Solana-based Exchange Traded Funds (ETFs). The introduction of a Solana ETF could also drive institutional interest, indirectly benefiting meme coins like BONK. The analyst has also highlighted the possibility of a BONK ETF, adding to the bullish fire and potentially driving demand.
Featured image from LinkedIn, chart from Tradingview.com

HBAR Price Struggles Under $0.25 as Bears Dominate

US SEC Seeks Public Comments on Grayscale’s Litecoin ETF Proposal

ADA Price Drops 25% in a Week

Ethereum Trades Inside A Multi-Year Bullish Pennant – Analyst Sees A Breakout Above $4K

Tornado Cash Developer Alexey Pertsev Set To Be Released; TORN Price Skyrockets

Solana’s BONK Roundtrips Total Gains From 2024, Here’s Why It’s A Good Buy Now

2.52 Million Altcoins Are Ruining Crypto’s Future

Animoca Brands Valuation Tanks 75% In Two Years, Here’s Why

Crypto exchange BingX hacked for $43 million

Are The Big Players Losing Interest?

Hong Kong’s Securities Association Tips Authorities On Crypto Self-Regulation

Coinbase cbBTC Set to go Live on Solana
2.52 Million Altcoins Are Ruining Crypto’s Future
Animoca Brands Valuation Tanks 75% In Two Years, Here’s Why
Crypto exchange BingX hacked for $43 million
Are The Big Players Losing Interest?
Hong Kong’s Securities Association Tips Authorities On Crypto Self-Regulation
Coinbase cbBTC Set to go Live on Solana
-
 Altcoin22 hours ago
Altcoin Season Paused Forever? What The Rising Bitcoin Dominance Says Will Happen
-

 Ethereum13 hours ago
Cboe seeks US SEC nod for spot Ethereum ETF options
-
 Regulation24 hours ago
Coinbase Files Amicus Brief To Protect Customers
-

 Market17 hours ago
XRP Price Struggles to Keep Pace: What’s Holding It Back?
-

 Market23 hours ago
Ex Malaysian PM’s Account Hacked to Promote Fake Meme Coin
-
 Market22 hours ago
TRUMP Price Jumps 10% as Market Cap Nears $4 Billion
-
 Market15 hours ago
Dogizen ICO hits $4m as Standard Chartered predicts BTC at $500k
-
 Market21 hours ago
FTT Price Rises as FTX Sets Repayment Date in February