
Ethereum
Cboe seeks US SEC nod for spot Ethereum ETF options


- Cboe has submitted a 19b-4 filing to be allowed to list and trade options on spot Ethereum ETFs.
- The proposal follows high demand for Ethereum ETFs.
- NYSE American has made a similar proposal though it is yet to receive SEC approval.
The Cboe BZX Exchange has officially submitted a 19b-4 filing to the US Securities and Exchange Commission (SEC), seeking approval to list and trade options on spot Ethereum exchange-traded funds (ETFs).
This move signifies a pivotal step for Cboe towards expanding investor access to Ethereum, mirroring the growing demand within the cryptocurrency market.
Cboe seeks to expand its investment tools
Cboe’s proposal aims to broaden the spectrum of investment tools available to market participants. By allowing options trading on Ethereum ETFs, investors would gain an accessible means to engage with Ethereum’s price movements.
The 19b-4 filing includes funds such as those managed by Bitwise and Grayscale, notably the Grayscale Ethereum Trust and Grayscale Ethereum Mini Trust, which hold Ethereum as their primary asset.
The exchange posits that these options will serve not only as another avenue for investors to gain exposure to Ethereum but also as a crucial hedging instrument against the inherent volatility of the cryptocurrency market.
Notably, Cboe’s filling follows on the heels of a similar proposal by NYSE American, which has yet to receive SEC approval, with the regulator citing concerns over market manipulation, investor protection, and ensuring a fair trading environment.
The SEC’s hesitance is rooted in Section 6(b)(5) of the Securities Exchange Act of 1934, which emphasizes the protection of investors and the maintenance of fair and orderly markets.
Despite these challenges, Cboe’s proposal is framed as a competitive response to NYSE’s initiative, suggesting a potential market eagerness to see these financial products come to fruition.
Cboe’s approach in the filing underscores that Ethereum ETF options would be governed by the same stringent rules as other fund share options on its platform, including listing requirements, margin rules, and trading halts. This regulatory alignment aims to reassure the SEC of the proposal’s adherence to existing frameworks, similar to those applied to Bitcoin ETF options, which were approved under similar regulatory scrutiny.
The surge in investor interest in Ethereum ETFs
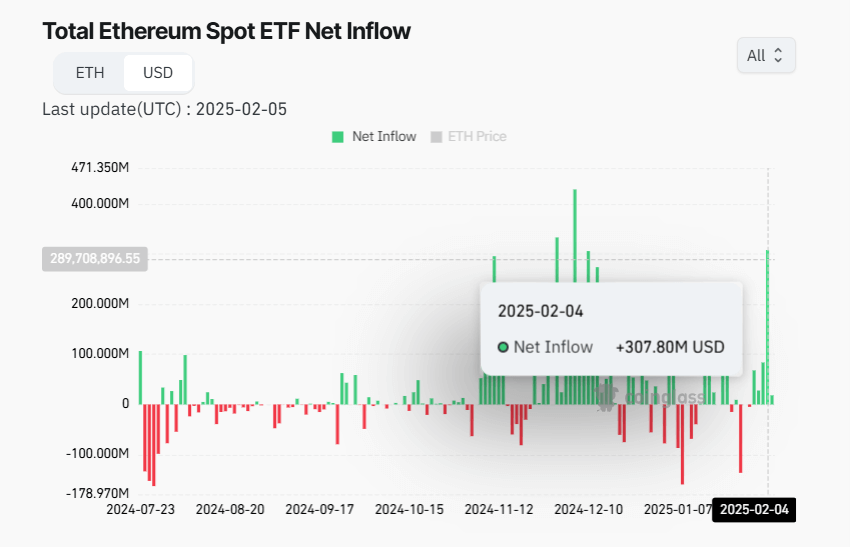
The timing of the Cboe filing coincides with a surge in investor interest in Ethereum ETFs. Recently, these funds have seen unprecedented trading volumes and net inflows.
For instance, on February 4, 2025, Ethereum ETFs recorded net inflows of $307.77 million, the highest single-day inflow of the year, demonstrating robust investor confidence.
This performance not only supports the rationale behind introducing options trading but also highlights the market’s readiness for such financial innovations.
The introduction of options on Ethereum ETFs could potentially stabilize Ethereum’s price by enhancing market liquidity.
Options provide sophisticated risk management tools for institutional investors, allowing them to hedge against price fluctuations. Retail traders might leverage these options for speculative gains.
This could lead to a more mature and stable market environment for Ethereum, fostering greater institutional adoption and contributing to the cryptocurrency’s mainstream financial integration.
Industry experts, like Nate Geraci from The ETF Store, have indicated that the approval process might follow a timeline similar to that of spot Bitcoin ETFs, which took about 8-9 months from launch to options trading approval.
If this precedent holds, we might see options on Ethereum ETFs becoming a reality in the near future, potentially as soon as next month, assuming regulatory hurdles are cleared.


Ethereum experienced one of the most chaotic trading days in its history last Monday, as it plunged over 30% in less than 24 hours amid escalating U.S. trade war fears. However, the market quickly rebounded after President Trump announced negotiations with Canada and Mexico, leading to a sharp recovery across crypto assets.
Related Reading
Despite this rebound, Ethereum remains significantly weaker than other altcoins, raising concerns about how long this underperformance will last. Investors are closely watching price action, as ETH continues to trade at historically low levels relative to Bitcoin and other altcoins.
Top analyst Carl Runefelt shared a technical analysis on X, revealing that Ethereum is holding onto a key horizontal support level on the ETHBTC chart. This suggests that ETH could be at a turning point, with a potential opportunity for recovery if bulls step in. However, failure to hold this level could indicate further downside ahead.
With Ethereum lagging behind its peers, sentiment remains mixed, and market participants are waiting for a clear confirmation of trend direction. Will ETH finally start catching up, or is another leg down still on the table? The next few weeks will be crucial.
Ethereum Faces Uncertainty After Record Liquidations
Ethereum has struggled after one of the most brutal liquidation events in crypto history, with over $8 billion wiped out from the market between Sunday night and Monday. ETH was one of the hardest-hit assets, with price action looking weak and uncertain compared to Bitcoin. This has sparked concerns among analysts, who fear Ethereum’s underperformance could continue.
However, top analyst Carl Runefelt remains optimistic. He shared a technical analysis on X, revealing that Ethereum is holding a crucial horizontal support level on the ETHBTC chart around 0.028. Runefelt believes that if ETH bounces from this level, it could trigger a massive parabolic move, marking the beginning of a long-awaited altseason.
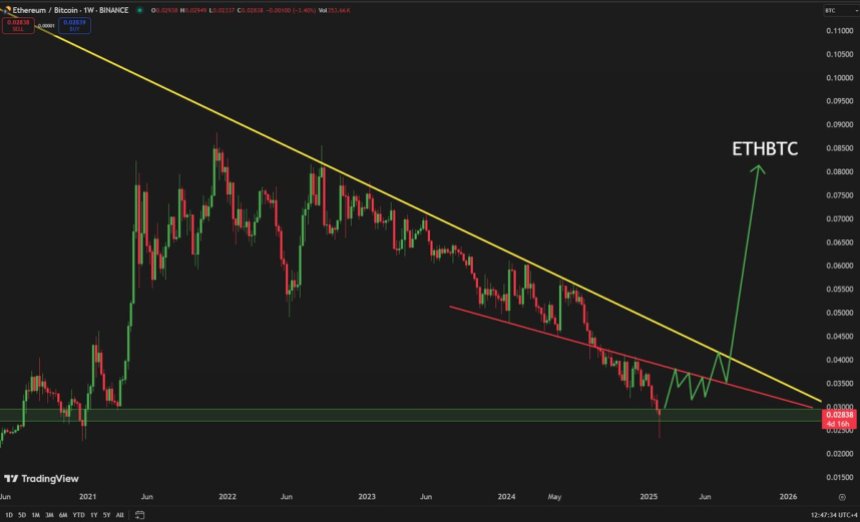
Ethereum has lagged behind BTC since late 2021, failing to reclaim its dominance despite multiple market rallies. While Bitcoin continues to flirt with all-time highs, ETH remains far from its previous peak, and many traders are now questioning whether Ethereum can regain its strength.
Related Reading
For now, Ethereum remains at a make-or-break level, with key support holding but pressure building. If ETH manages to surge from this zone, it could lead to a strong recovery and shift market sentiment. However, failure to hold support could mean further downside ahead.
Can Bulls Reclaim Momentum?
Ethereum is trading at $2,780 after testing two critical moving averages—the 200-day moving average at $2,482 and the 200-day exponential moving average at $2,288. These indicators have been key long-term support levels since July 2020, confirming that Ethereum’s macro trend remains intact despite recent volatility.
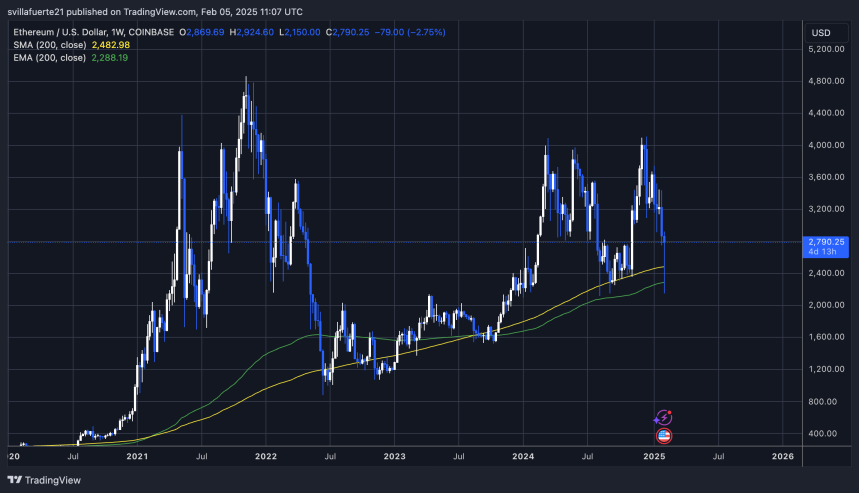
For Ethereum to reverse the short-term bearish trend, bulls must reclaim the $2,800 mark and hold it as support. This level is a psychological and technical barrier that would signal renewed strength. A push above $3,000 is the next critical step, as breaking this resistance would shift sentiment from bearish to bullish and trigger a move into key supply zones.
If Ethereum fails to reclaim these levels, the market could see another wave of selling pressure, pushing ETH back toward lower demand areas. However, historical trends suggest that when ETH holds above these moving averages, it often leads to strong rallies.
Related Reading
Investors are watching closely to see if Ethereum can recover and reestablish its bullish momentum. A breakout above $3,000 would set the stage for a push toward higher resistance levels, potentially leading to a major rally in the coming months.
Featured image from Dall-E, chart from TradingView

Ethereum has made a recovery to $2,800 during the past day as on-chain data shows the whales have been making massive withdrawals from exchanges.
Ethereum Exchange Outflows Spiked After Price Crash
According to data from the market intelligence platform IntoTheBlock, investors reacted to the latest crash in the Ethereum price by making outflows from exchanges.
The on-chain indicator of relevance here is the “Exchange Netflow,” which keeps track of the net amount of the cryptocurrency that’s entering into or exiting the wallets associated with all centralized exchanges.
When the value of this metric is positive, it means the holders are depositing a net number of coins into these platforms. As one of the main reasons why investors transfer to the exchanges is for selling-related purposes, this kind of trend can be a bearish sign for the asset’s price.
On the other hand, the indicator being negative suggests the outflows outweigh the inflows and a net number of tokens is moving out of the exchanges. Such a trend can indicate that the investors are accumulating, which is something that can naturally be bullish for ETH.
Now, here is a chart that shows the trend in the Ethereum Exchange Netflow over the past year:
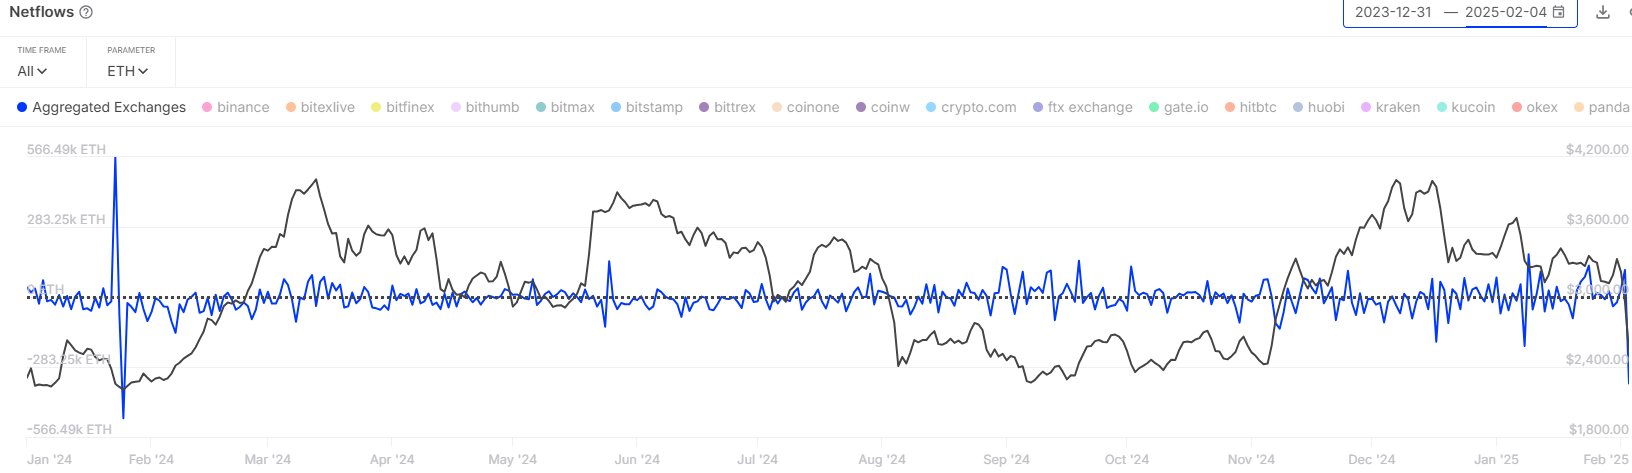
As is visible in the above graph, the Ethereum Exchange Netflow observed a massive negative spike yesterday after the crash in the asset’s price took place.
In total, the investors withdrew 350,000 ETH (worth around $982 million at the current exchange rate of the token) from the exchanges in this outflow spree. “This is the highest amount of net exchange withdrawals since January 2024!” notes the analytics firm.
Given the timing of the outflows, it would appear likely that they were made by whales looking to buy Ethereum at cheap post-crash prices. The accumulation from the investors has in turn helped the cryptocurrency reach a bottom and make some recovery.
The Exchange Netflow could now be to keep an eye on in the coming days, as the upcoming trend in it might also influence the ETH price. Naturally, a continuation of the outflows would be a positive sign, while an increase in inflows could spell a bearish outcome.
In some other news, the number two stablecoin by market cap, USDC, has seen its transaction count shoot up recently, as IntoTheBlock has pointed out in another X post.
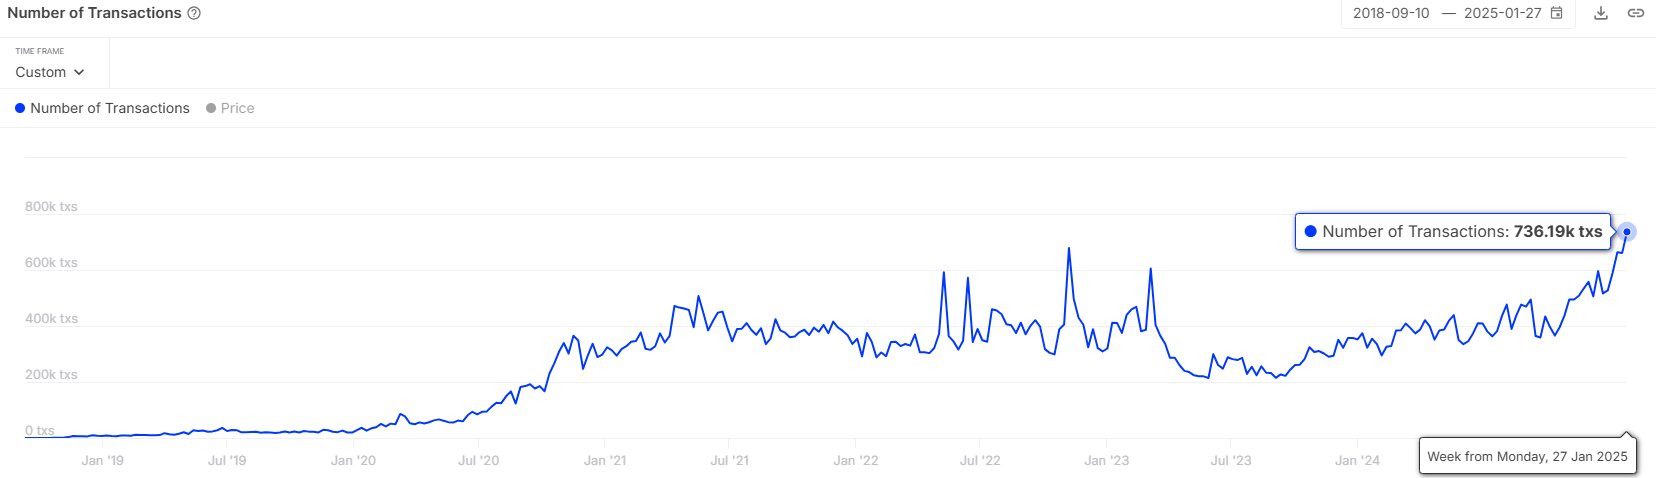
“USDC is becoming increasingly popular, with the number of daily transactions increasing by over 119% in the last year!” says the analytics firm. Stablecoins can end up acting as fuel for volatile assets like Ethereum, so increased activity related to them can be a good sign for the market.
ETH Price
At the time of writing, Ethereum is floating around $2,800, down more than 11% over the last seven days.
The on-chain analytics firm Glassnode has revealed how the Ethereum futures market is still overheated despite the long squeeze that just occurred.
Ethereum Open Interest Still Notably Above The Yearly Average
In a new post on X, Glassnode has discussed about how the Ethereum futures market has changed during the past day. ETH, like other digital assets, has witnessed significant volatility inside this window. Sharp price action usually means chaos for the derivatives side of the sector and indeed, a large amount of liquidations have piled up on the various exchanges.
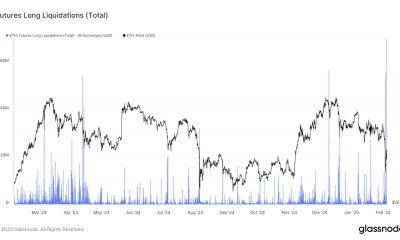
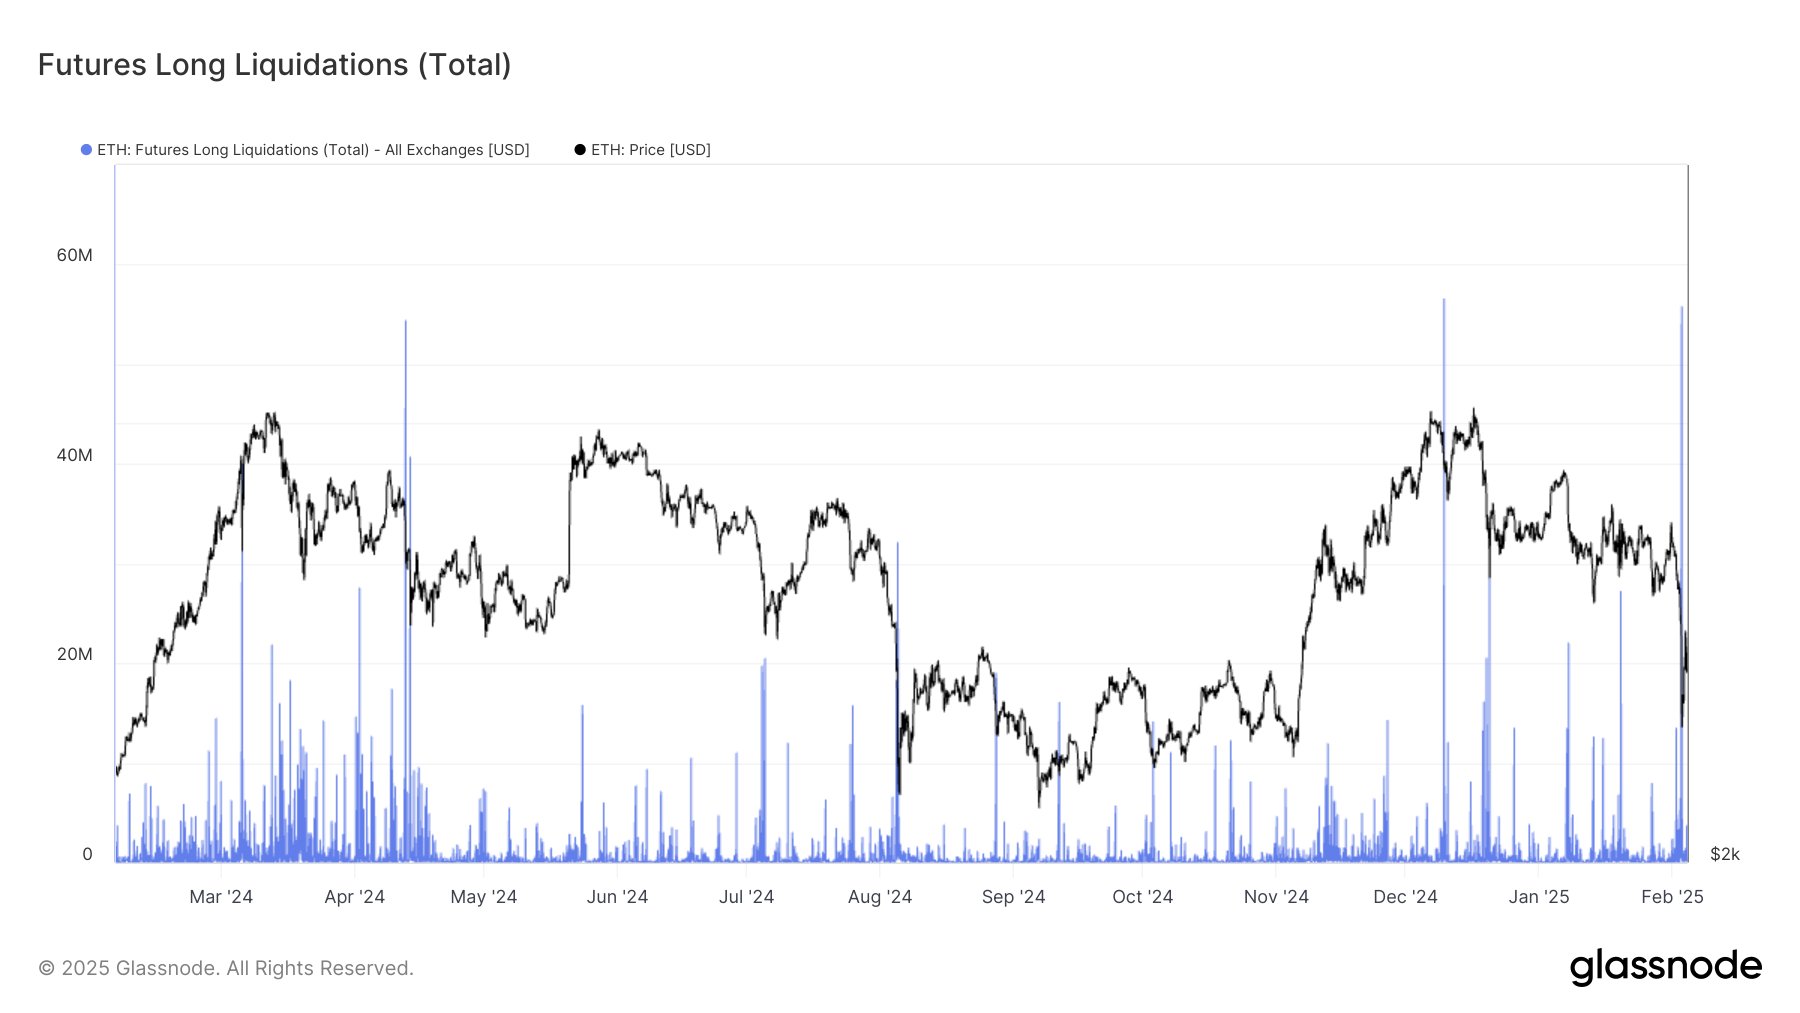
Given that the price action has been majorly towards the downside for Ethereum, the long investors would be the most heavily affected. Below is the chart shared by the analytics firm that shows the trend in the long liquidations related to ETH over the past year.

From the graph, it’s visible that the Ethereum futures market has just witnessed a massive amount of long liquidations. “Yesterday, $76.4M in ETH long liquidations hit the market, with $55.8M wiped out in a single hour – the second-largest spike in a year, just behind Dec 9’s $56M,” notes Glassnode.
These liquidations have meant that a notable ETH leverage flush-out has occurred on the derivatives platforms. Here is another chart, this time for the Open Interest, which showcases the market deleveraging:

The “Open Interest” is an indicator that keeps track of the total amount of Ethereum-related futures positions that are open on all centralized derivatives exchanges. At the start of the month, this metric was sitting around $20.5 billion, but after the mass liquidation event, its value has come down to $15.9 billion.
This suggests $4.6 billion in positions have been wiped out from the market. While this represents a large decrease, it has actually not been enough to cause a sufficient cooldown in the Open Interest.
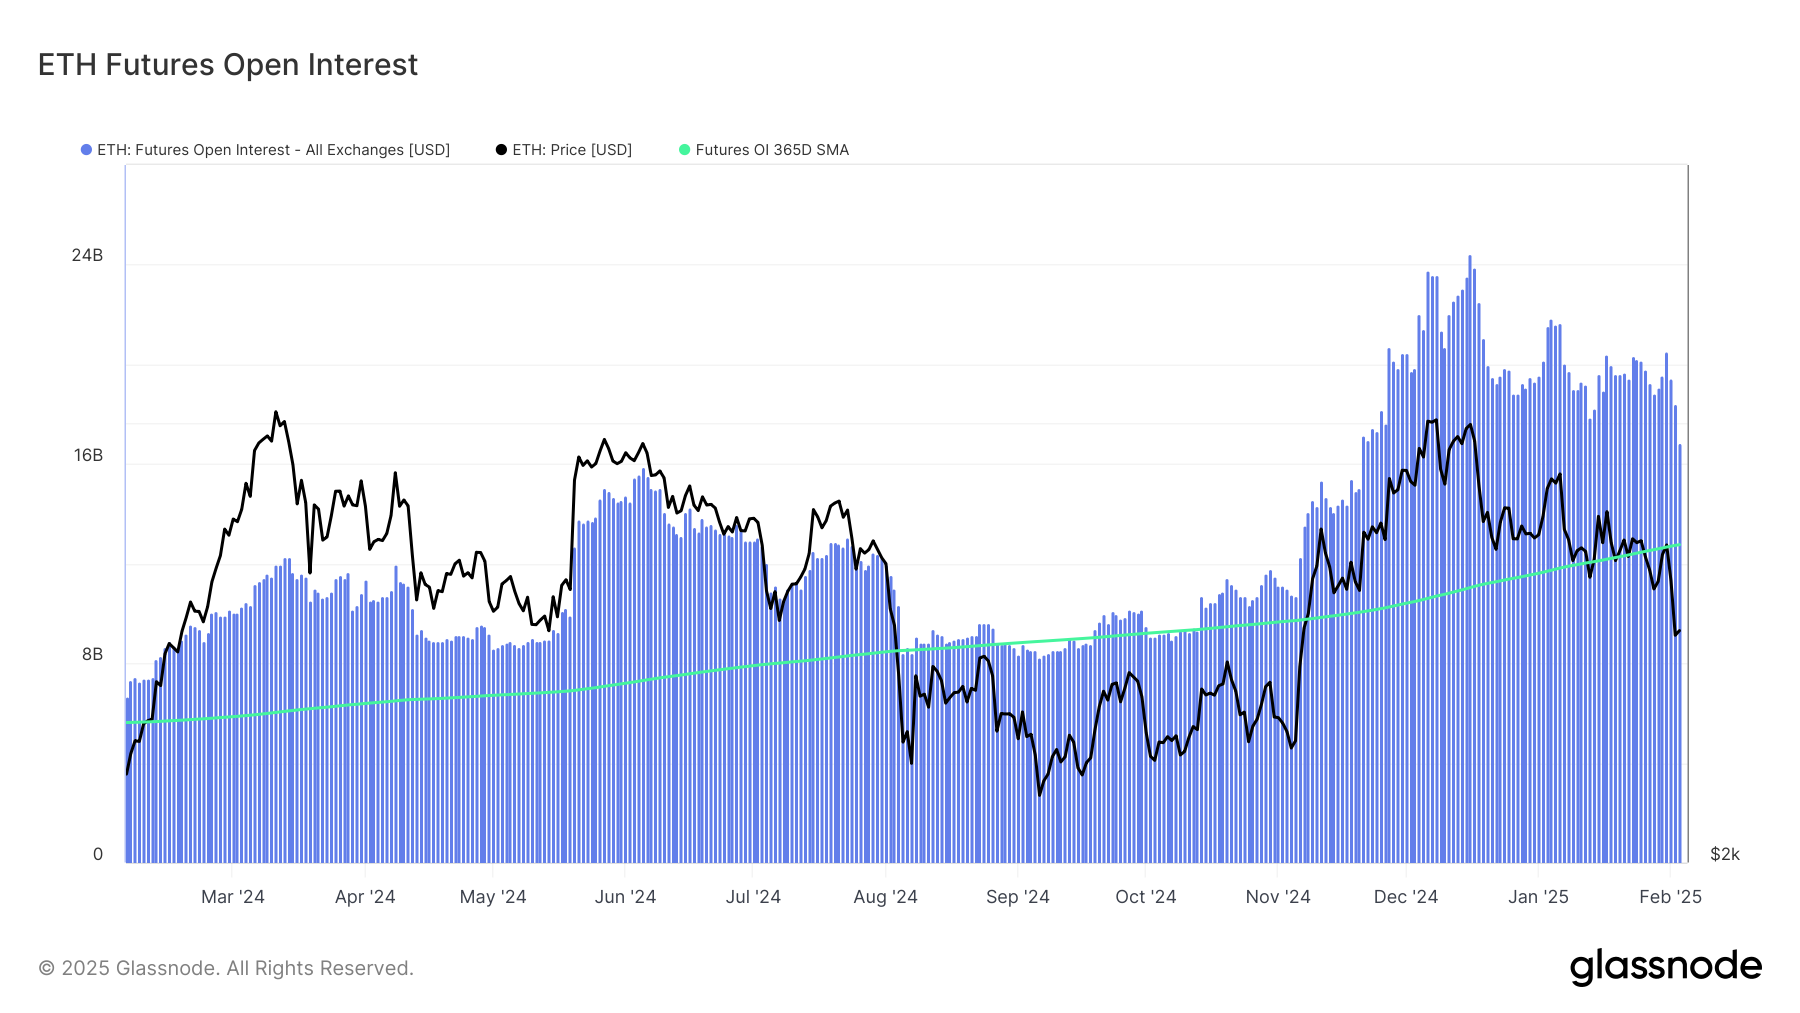
As displayed in the above chart, the 365-day moving average (MA) of the Ethereum Open Interest is currently situated at $13 billion. Thus, the metric’s daily value is around 22% higher than the average for the past year.
This could be a potential indication that the leverage in the sector is still at elevated levels, despite the massive amount of liquidations that the long investors have suffered.
Historically, an overheated futures market has generally unwound with volatility for the coin’s price, so it’s possible that more sharp action could follow for ETH in the near future.
ETH Price
Ethereum saw a crash towards the $2,100 mark yesterday, but it would appear the cryptocurrency has seen a rebound as its price is now trading around $2,800.

Top Reasons for Jupiter Price Crash 8% Today

PEPE Struggles Against Strong Resistance, Bearish Pressure Intensify

El Salvador Keeps Buying Despite IMF Pressure

What It Means for the Crypto Market?

Pump.fun Faces Legal Threat Over DOGSHIT2 Meme Coin
Bitcoin Whales Propel BTC Towards Major Resistance Levels

2.52 Million Altcoins Are Ruining Crypto’s Future

Animoca Brands Valuation Tanks 75% In Two Years, Here’s Why

Crypto exchange BingX hacked for $43 million

Are The Big Players Losing Interest?

Hong Kong’s Securities Association Tips Authorities On Crypto Self-Regulation

Coinbase cbBTC Set to go Live on Solana
2.52 Million Altcoins Are Ruining Crypto’s Future
Animoca Brands Valuation Tanks 75% In Two Years, Here’s Why
Crypto exchange BingX hacked for $43 million
Are The Big Players Losing Interest?
Hong Kong’s Securities Association Tips Authorities On Crypto Self-Regulation
Coinbase cbBTC Set to go Live on Solana
-

 Regulation20 hours ago
FDIC to Allow Banks to Manage Crypto Assets and Token Deposits
-
 Altcoin20 hours ago
What’s Happening With Solana Price
-

 Altcoin17 hours ago
Is An Altcoin Season Around The Corner? Here’s What Historical Data Shows
-

 Market22 hours ago
MEXC Fuels DeFi Innovation and Liquidity Security with the Berachain (BERA) Listing
-
 Market21 hours ago
Berachain Airdrop Details Announced Ahead of Mainnet Launch
-

 Market20 hours ago
AVAX Faces Downward Trend as Whales Pull Out $272 Million
-
 Altcoin18 hours ago
Will HBAR Price Skyrocket To $0.9?
-

 Market17 hours ago
MicroStrategy Rebrands to Strategy, Reveals 74% Bitcoin Yield