
Market
BlackRock to Launch Bitcoin ETP in Switzerland for EU Market

BlackRock is going to list a Bitcoin ETP in Europe and likely launch the product in Switzerland. The firm recently launched a BTC ETF in Canada, but this marks its first offering like this outside North America.
Bitcoin’s price has proved volatile after a major rally in November, but BlackRock has consistently shown complete confidence in it. This ETP offering may substantially impact European markets.
BlackRock to Offer ETP in Europe
BlackRock has undergone substantial changes since becoming the world’s biggest Bitcoin ETF issuer. Its IBIT product has been hailed as the “greatest launch in exchange history,” and the firm holds 2.7% of the entire BTC supply.
BlackRock recently launched an ETF in Canada, and it’s continuing these expansion plans with a Bitcoin ETP in Europe.
“Being able to gain Bitcoin exposure via the ETP wrapper has proven to be a compelling combination for investors,” Samara Cohen and Jay Jacobs, BlackRock’s Chief Investment Officer of ETFs and Index Investments and US Head of Thematic and Active ETFs, respectively, wrote in a blog post last month.
According to reports, BlackRock is likely to domicile this new ETP in Switzerland. Over the past few years, the country has become a hub for friendly crypto regulation, with its “Crypto Valley” in Zug attracting much acclaim.
While Switzerland may have friendlier laws than the EU, it will need to comply with the MICA regulations to do business in the region.
For BlackRock, this European ETP is a strong signal of its executives’ confidence in Bitcoin. The asset’s price has been on a roller coaster for the past few months, generally holding onto gains from Trump’s election in November.
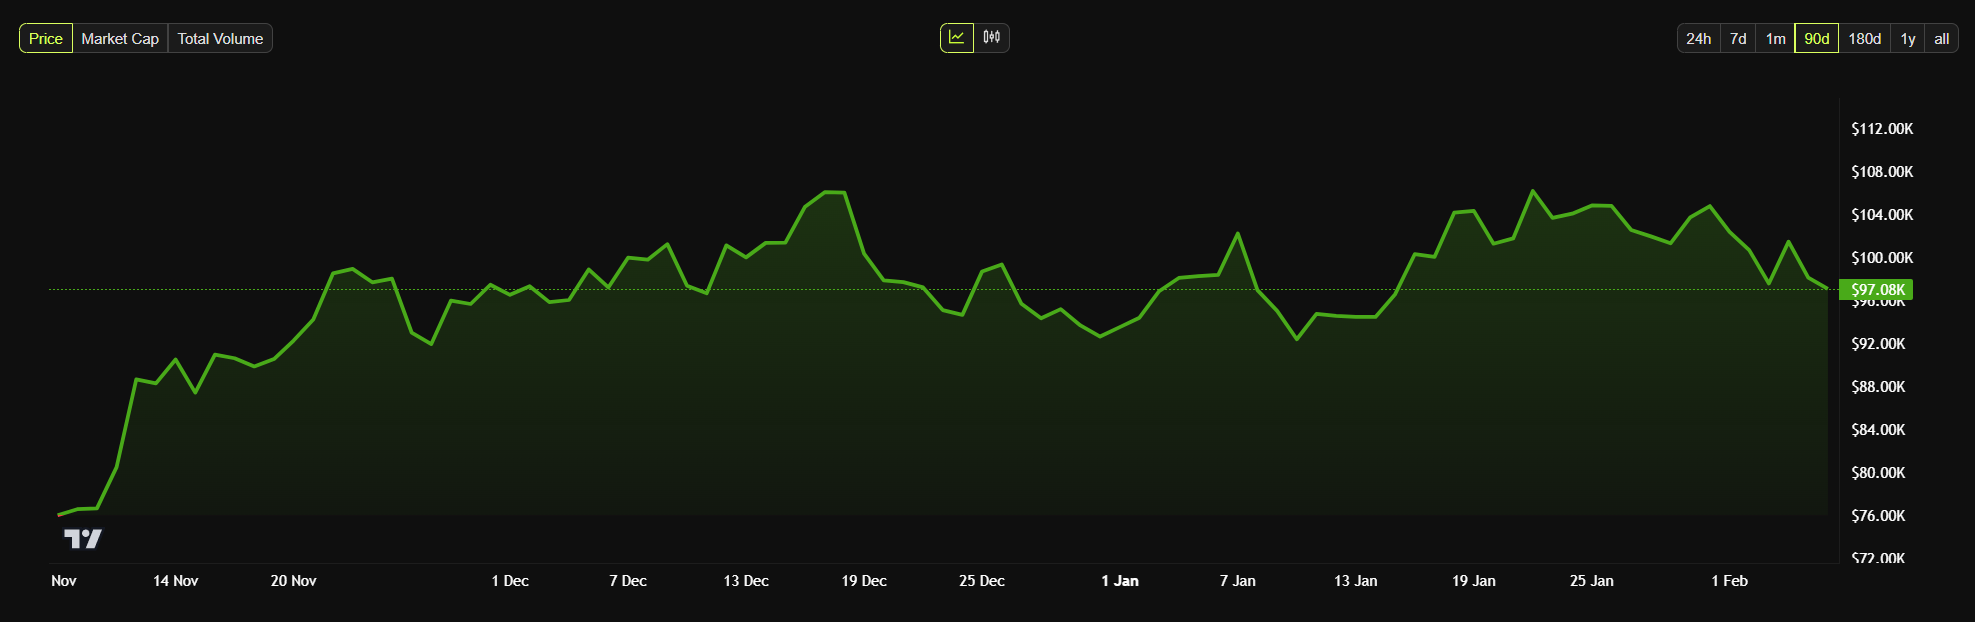
Still, these price wobbles are not enough to deter BlackRock’s new ETP strategy. Last December, IBIT boasted higher AUM than over 50 European ETFs, and it’s been growing since.
Recently, it also saw huge trading volumes despite continued tumult in Bitcoin. Ethereum ETFs recently overperformed their underlying asset by large margins; perhaps this will happen for BTC.
BlackRock may begin marketing this Bitcoin ETP in as little as one month. The company hasn’t made any public statements or responded to press requests, but a few employees spoke off the record.
Overall, the firm has a huge amount of capital and market influence, and this offering may substantially shake up EU markets. This plan may reap huge rewards.
Disclaimer
In adherence to the Trust Project guidelines, BeInCrypto is committed to unbiased, transparent reporting. This news article aims to provide accurate, timely information. However, readers are advised to verify facts independently and consult with a professional before making any decisions based on this content. Please note that our Terms and Conditions, Privacy Policy, and Disclaimers have been updated.


Global traders, including those in crypto, should brace for volatility as tariffs and inflation take center stage in shaping market trends, according to a new survey by JPMorgan Chase.
The survey’s findings indicated a significant rise in concern compared to the previous year when only 27% of respondents cited inflation as a major issue.
Tariffs To Stir Market Uncertainty, JP Morgan Survey Says
Over the past week, US President Donald Trump introduced a 25% tariff on imports from Mexico and Canada and a 10% tariff on goods from China, only to delay some of these measures shortly afterward.
“…We further agreed to immediately pause the anticipated tariffs for one month…,” Trump revealed in a post.
Before the pause, however, the tariffs had triggered significant market fluctuations, with stocks, currencies, and commodities all responding to policy announcements.
Against this backdrop, an annual survey featuring institutional trading clients from JPMorgan Chase revealed that 51% of traders believe inflation and tariffs will be the most influential factors in global markets for 2025.
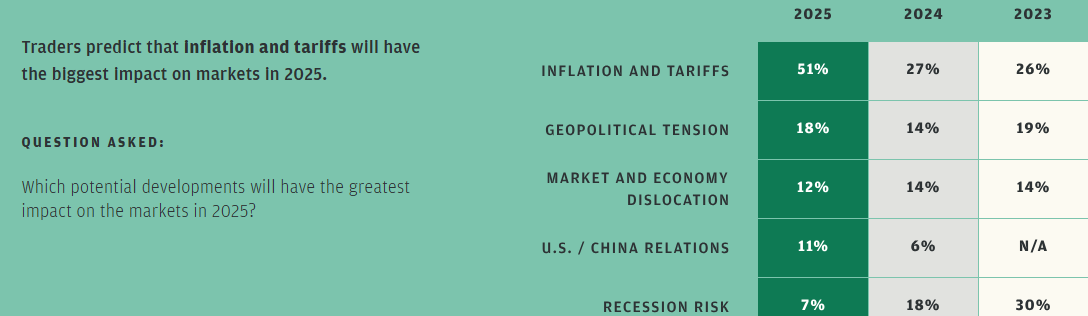
The survey cites the back-and-forth nature of these policies, saying that it has led to sharp market movements. This engagement alludes to China’s move to announce a 10% tariff on US crude oil and agricultural machinery in response to US tariffs on all Chinese imports.
On the inflation front, traders view Trump’s tariff policies as inherently inflationary, pushing prices higher across multiple sectors. Additionally, fewer traders are worried about a potential recession. Only 7% of those surveyed cited it as a major concern compared to 18% in 2024.
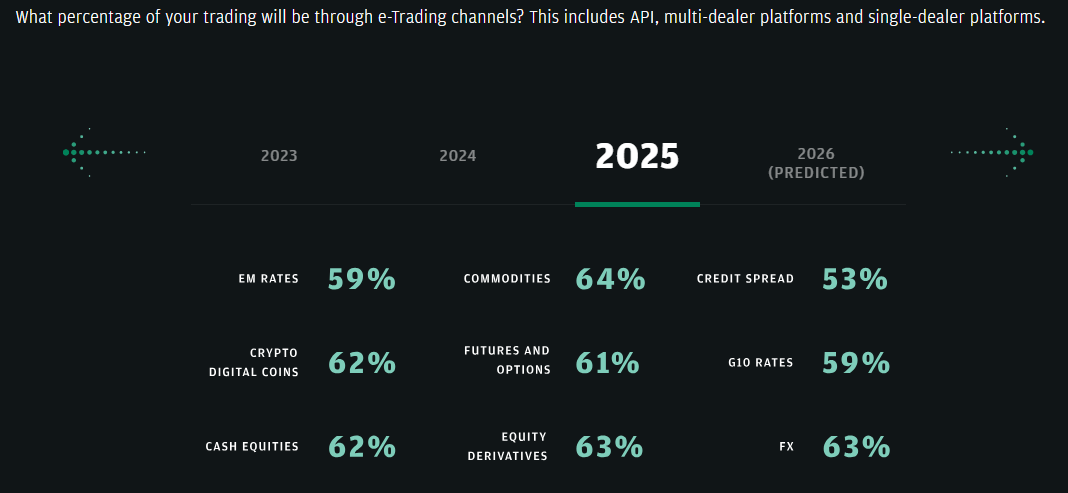
The report also highlights changing market structures. It emphasizes that electronic trading is expected to expand across all asset classes, including emerging markets like crypto.
Volatility Remains a Core Concern
JPMorgan’s survey also identified market volatility among the challenges to watch in 2025. Specifically, 41% of respondents named it their primary concern, up from 28% in 2024. Unlike in previous years when volatility was expected around key scheduled events, traders are now experiencing sudden market swings driven by unpredictable political and economic news.
“What distinguishes this year is the somewhat unexpected timing of volatility. Unlike in the past, when volatility was tied to scheduled events like elections or nonfarm payroll data, we’re seeing more sudden fluctuations in response to news headlines around the administration’s plans, leading to knee-jerk reactions in the marketplace,” Reuters reported, citing Eddie Wen, global head of digital markets at JPMorgan.
Meanwhile, the broader financial markets are not the only ones reacting to Trump’s tariff policies. Bitcoin and the crypto sector have also felt the impact of these economic shifts. When Trump delayed tariffs on Canada and Mexico, the Coinbase Bitcoin premium index surged to a new 2025 high.
Likewise, the news triggered a rebound in Bitcoin prices. Traders interpreted the delay as a sign of potential economic stability. Additionally, when the US paused tariffs on Mexico, XRP saw a significant recovery. This highlights the direct influence of trade policies on the digital asset market.
However, China’s retaliation to Trump’s tariffs introduced fresh instability, further exacerbating market fluctuations.
“[Ethereum would fall] Back to 2200-2400 if China trade war is real,” crypto analyst Andrew Kang wrote.
Elsewhere, Glassnode highlighted the unusual nature of the current Bitcoin cycle. As BeInCrypto reported, the blockchain analytics firm noted how macroeconomic factors—including tariffs—play an outsized role. Unlike previous cycles that primarily followed internal crypto industry trends, the 2025 cycle could realize significant influence from global economic policies.
Disclaimer
In adherence to the Trust Project guidelines, BeInCrypto is committed to unbiased, transparent reporting. This news article aims to provide accurate, timely information. However, readers are advised to verify facts independently and consult with a professional before making any decisions based on this content. Please note that our Terms and Conditions, Privacy Policy, and Disclaimers have been updated.

Solana-based meme coin dogwifhat (WIF) has experienced a sharp downturn over the past week. It has shed 33% of its value during that period and currently trades at a February 2024 low.
On-chain and technical indicators confirm the weakening demand for the meme coin, suggesting its decline may continue in the short term.
WIF’s Declining Demand Signals Bearish Outlook
An assessment of the WIF/USD one-day chart reveals that the token’s On-Balance-Volume (OBV), a key indicator of buying and selling pressure, has continued to drop, reflecting diminishing demand for the meme coin. At press time, it is at -398.94 million, falling by 285% in just seven days.
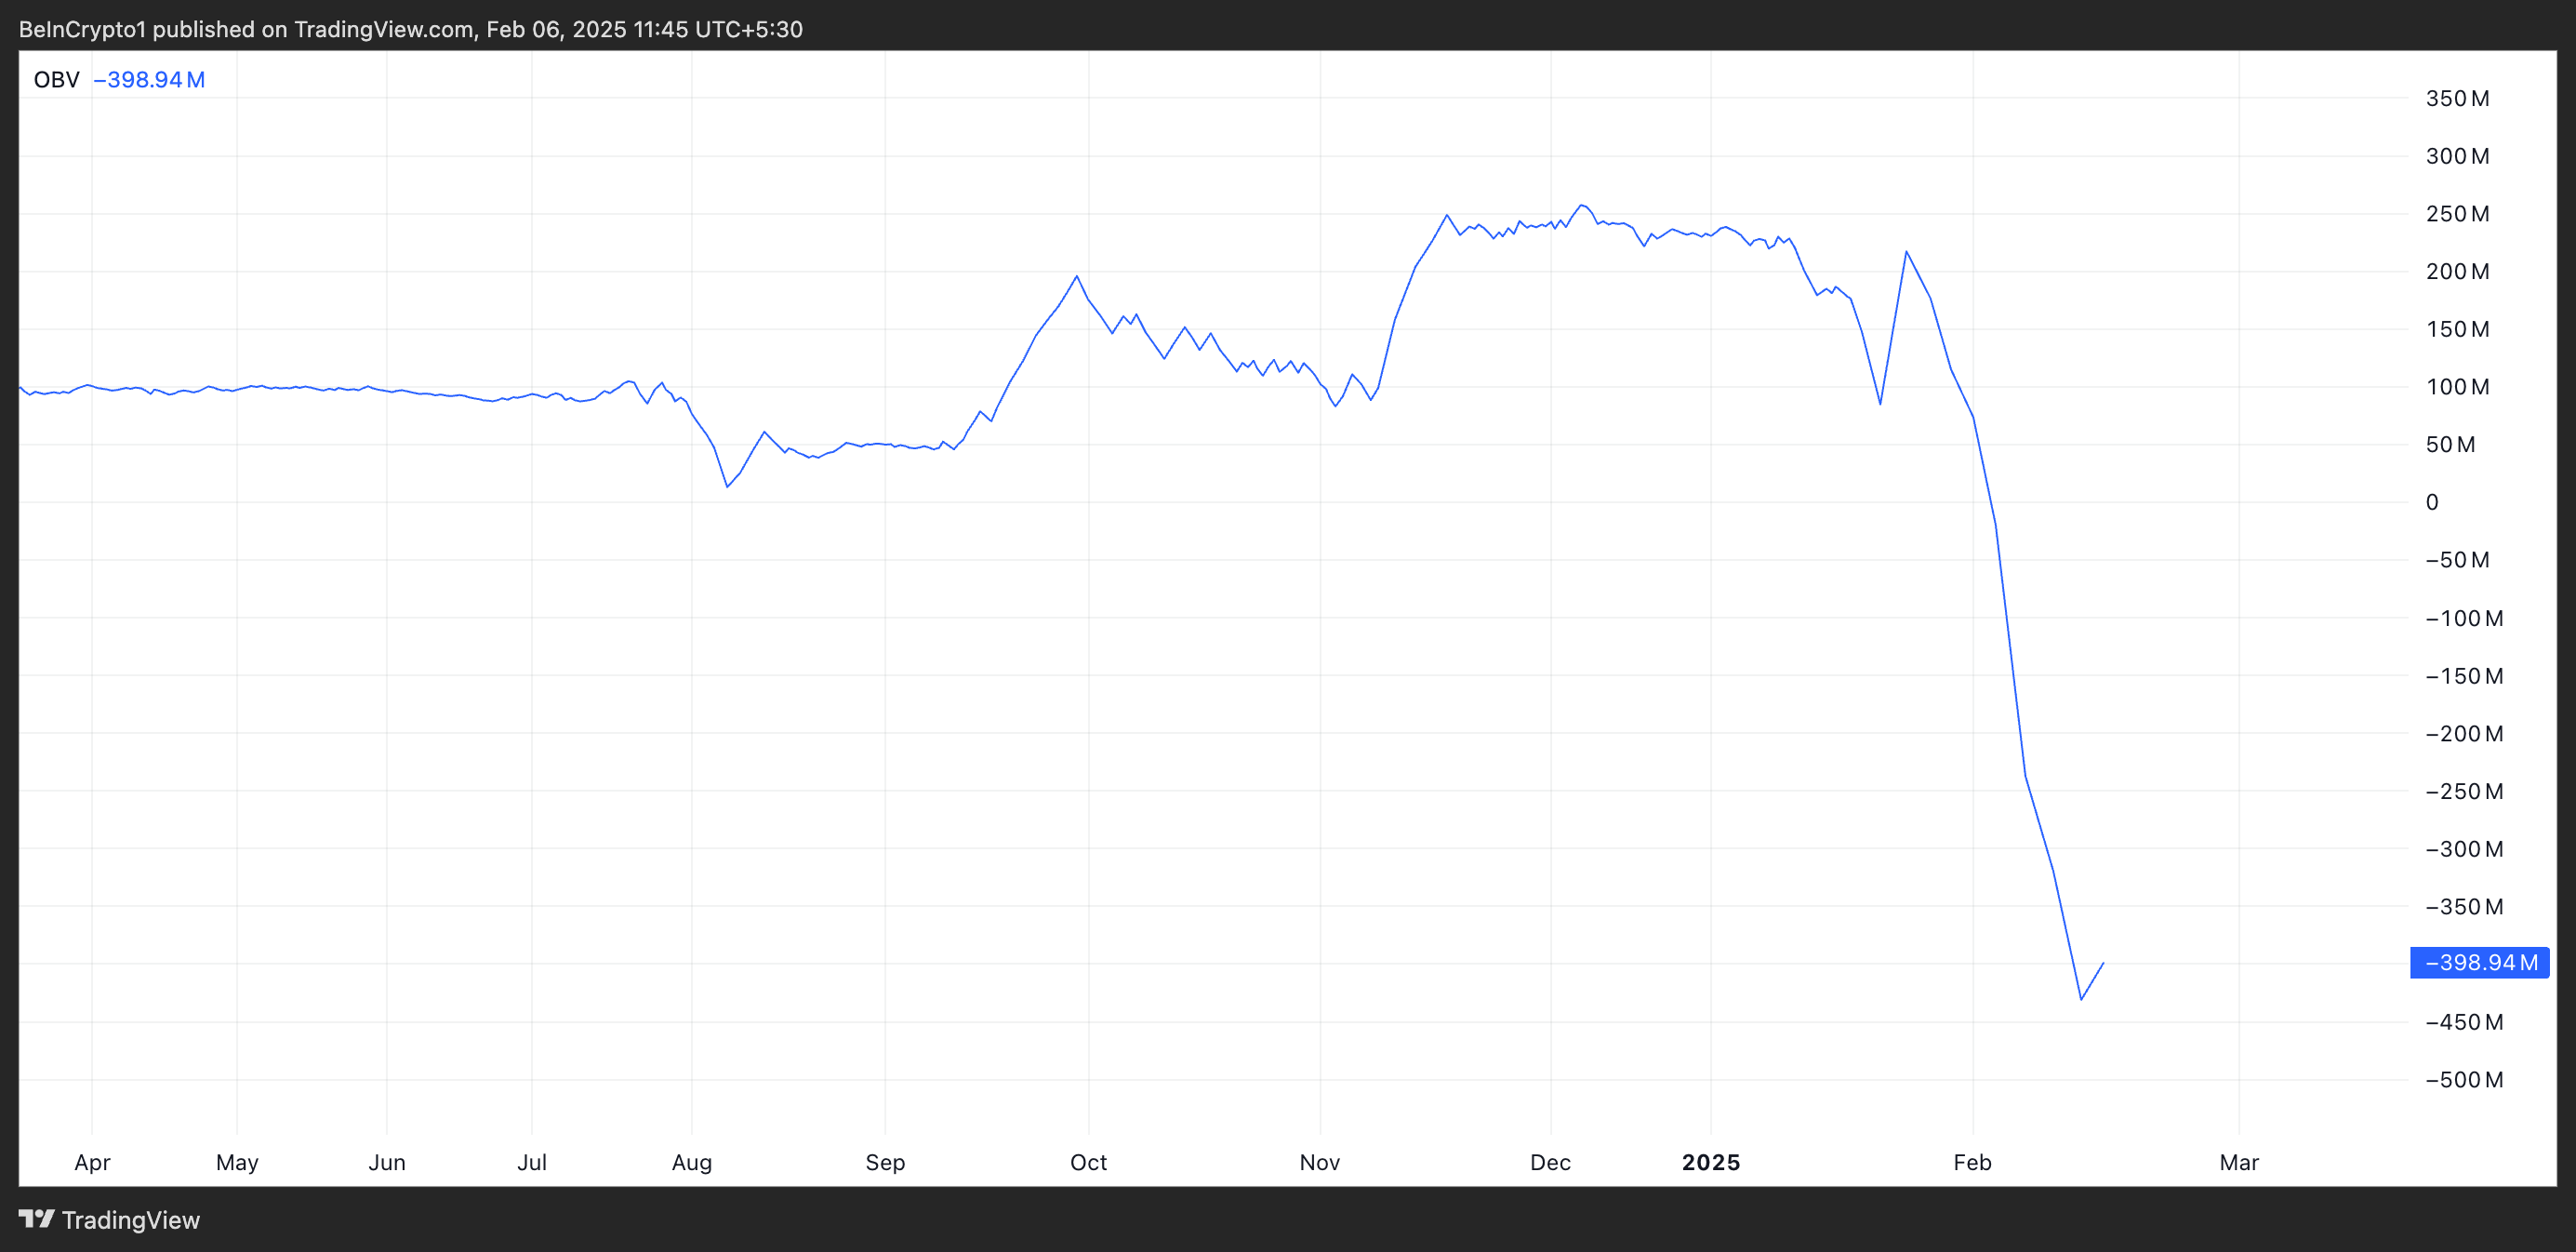
A falling OBV like this indicates that selling pressure outweighs buying pressure. It means more traders are offloading the asset than accumulating it.
When an asset’s OBV falls while its price declines, it reinforces bearish sentiment and the likelihood of further losses. This suggests weakening demand for WIF and signals a potential downtrend or continuation of its existing price drop.
Additionally, WIF’s open interest reinforces this bearish outlook. It has steadily declined since the start of February, plunging by 42%.
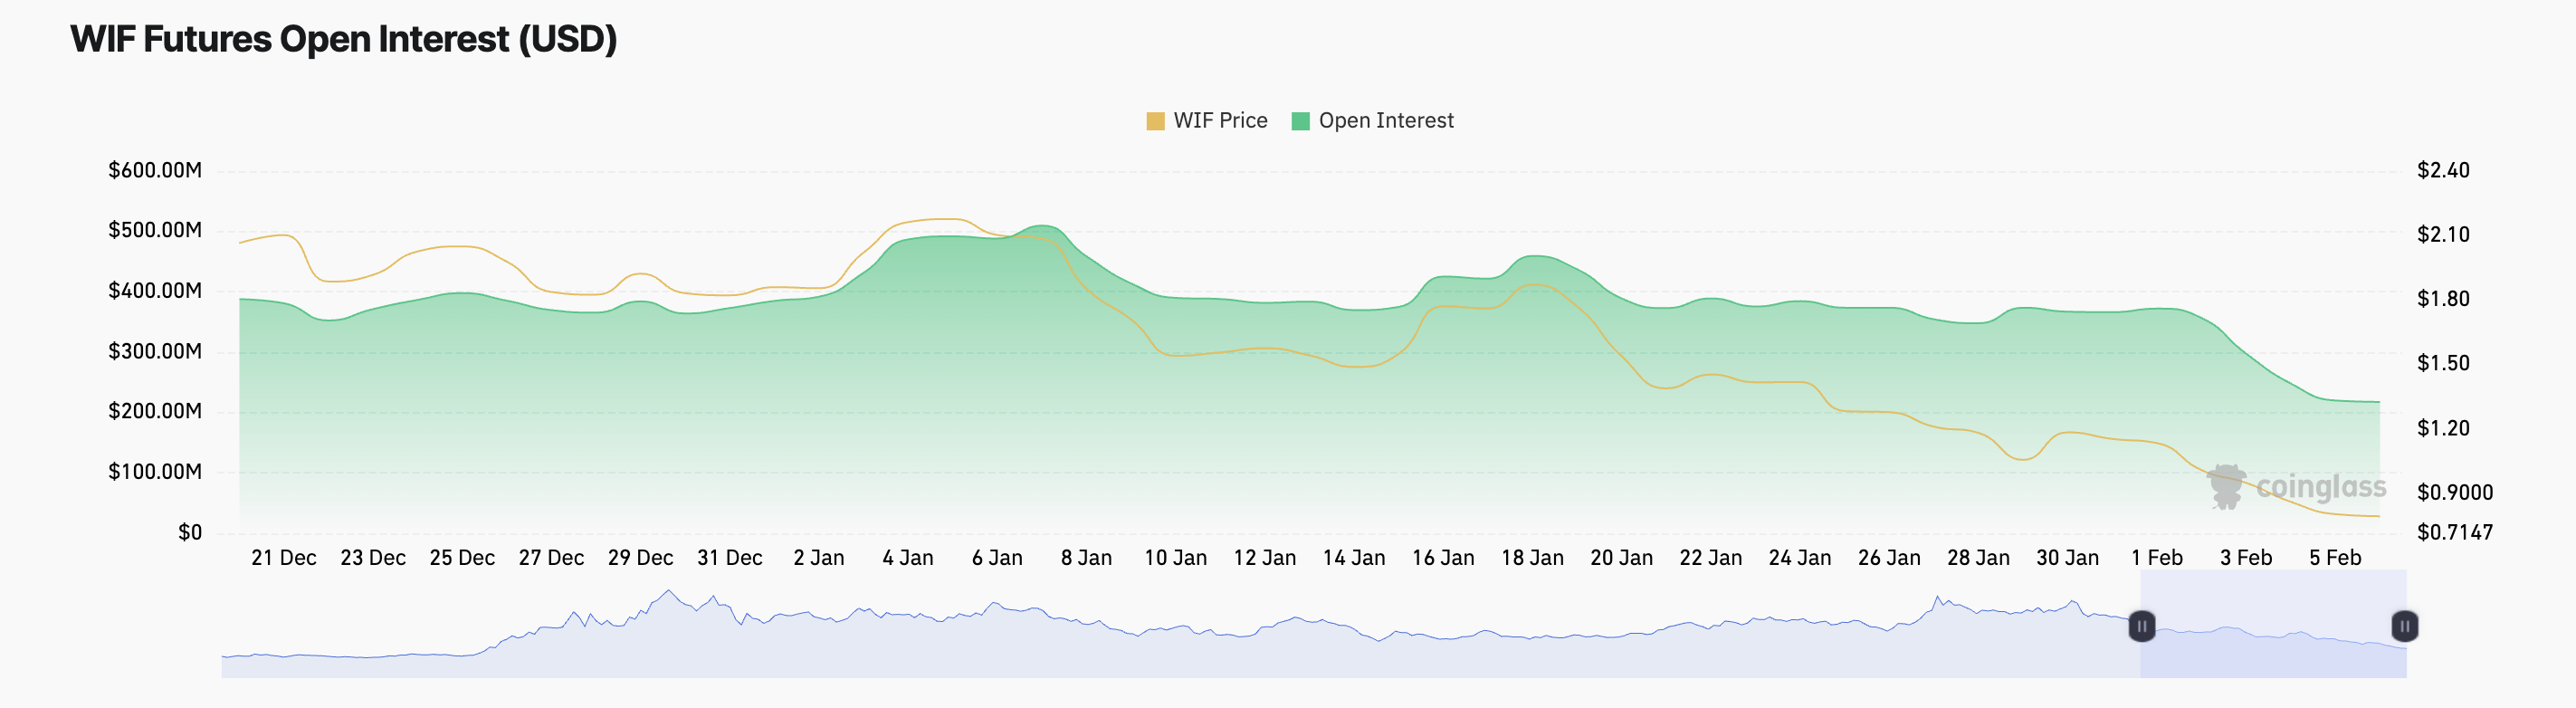
Open Interest refers to the total number of outstanding futures or options contracts that have not been settled. When it drops alongside an asset’s price decline, traders are closing their positions rather than opening new ones. This reflects weakening market participation and can signal that the downtrend may continue unless new interest emerges.
WIF Price Prediction: More Declines Ahead?
Readings from WIF’s Awesome Oscillator (AO) confirm the waning demand for the altcoin. This indicator posts red downward-facing histogram bars as of this writing, reflecting the high selling pressure. Its value is -0.60.
The Awesome Oscillator indicator measures market momentum by comparing the recent 5-period moving average to the longer 34-period moving average. When it posts red downward-facing histogram bars, it indicates weakening bullish momentum or strengthening bearish pressure, suggesting a potential continuation of a downtrend.
If WIF’s downtrend continues, its price could plunge to $0.55, representing a 30% decline from its current value.
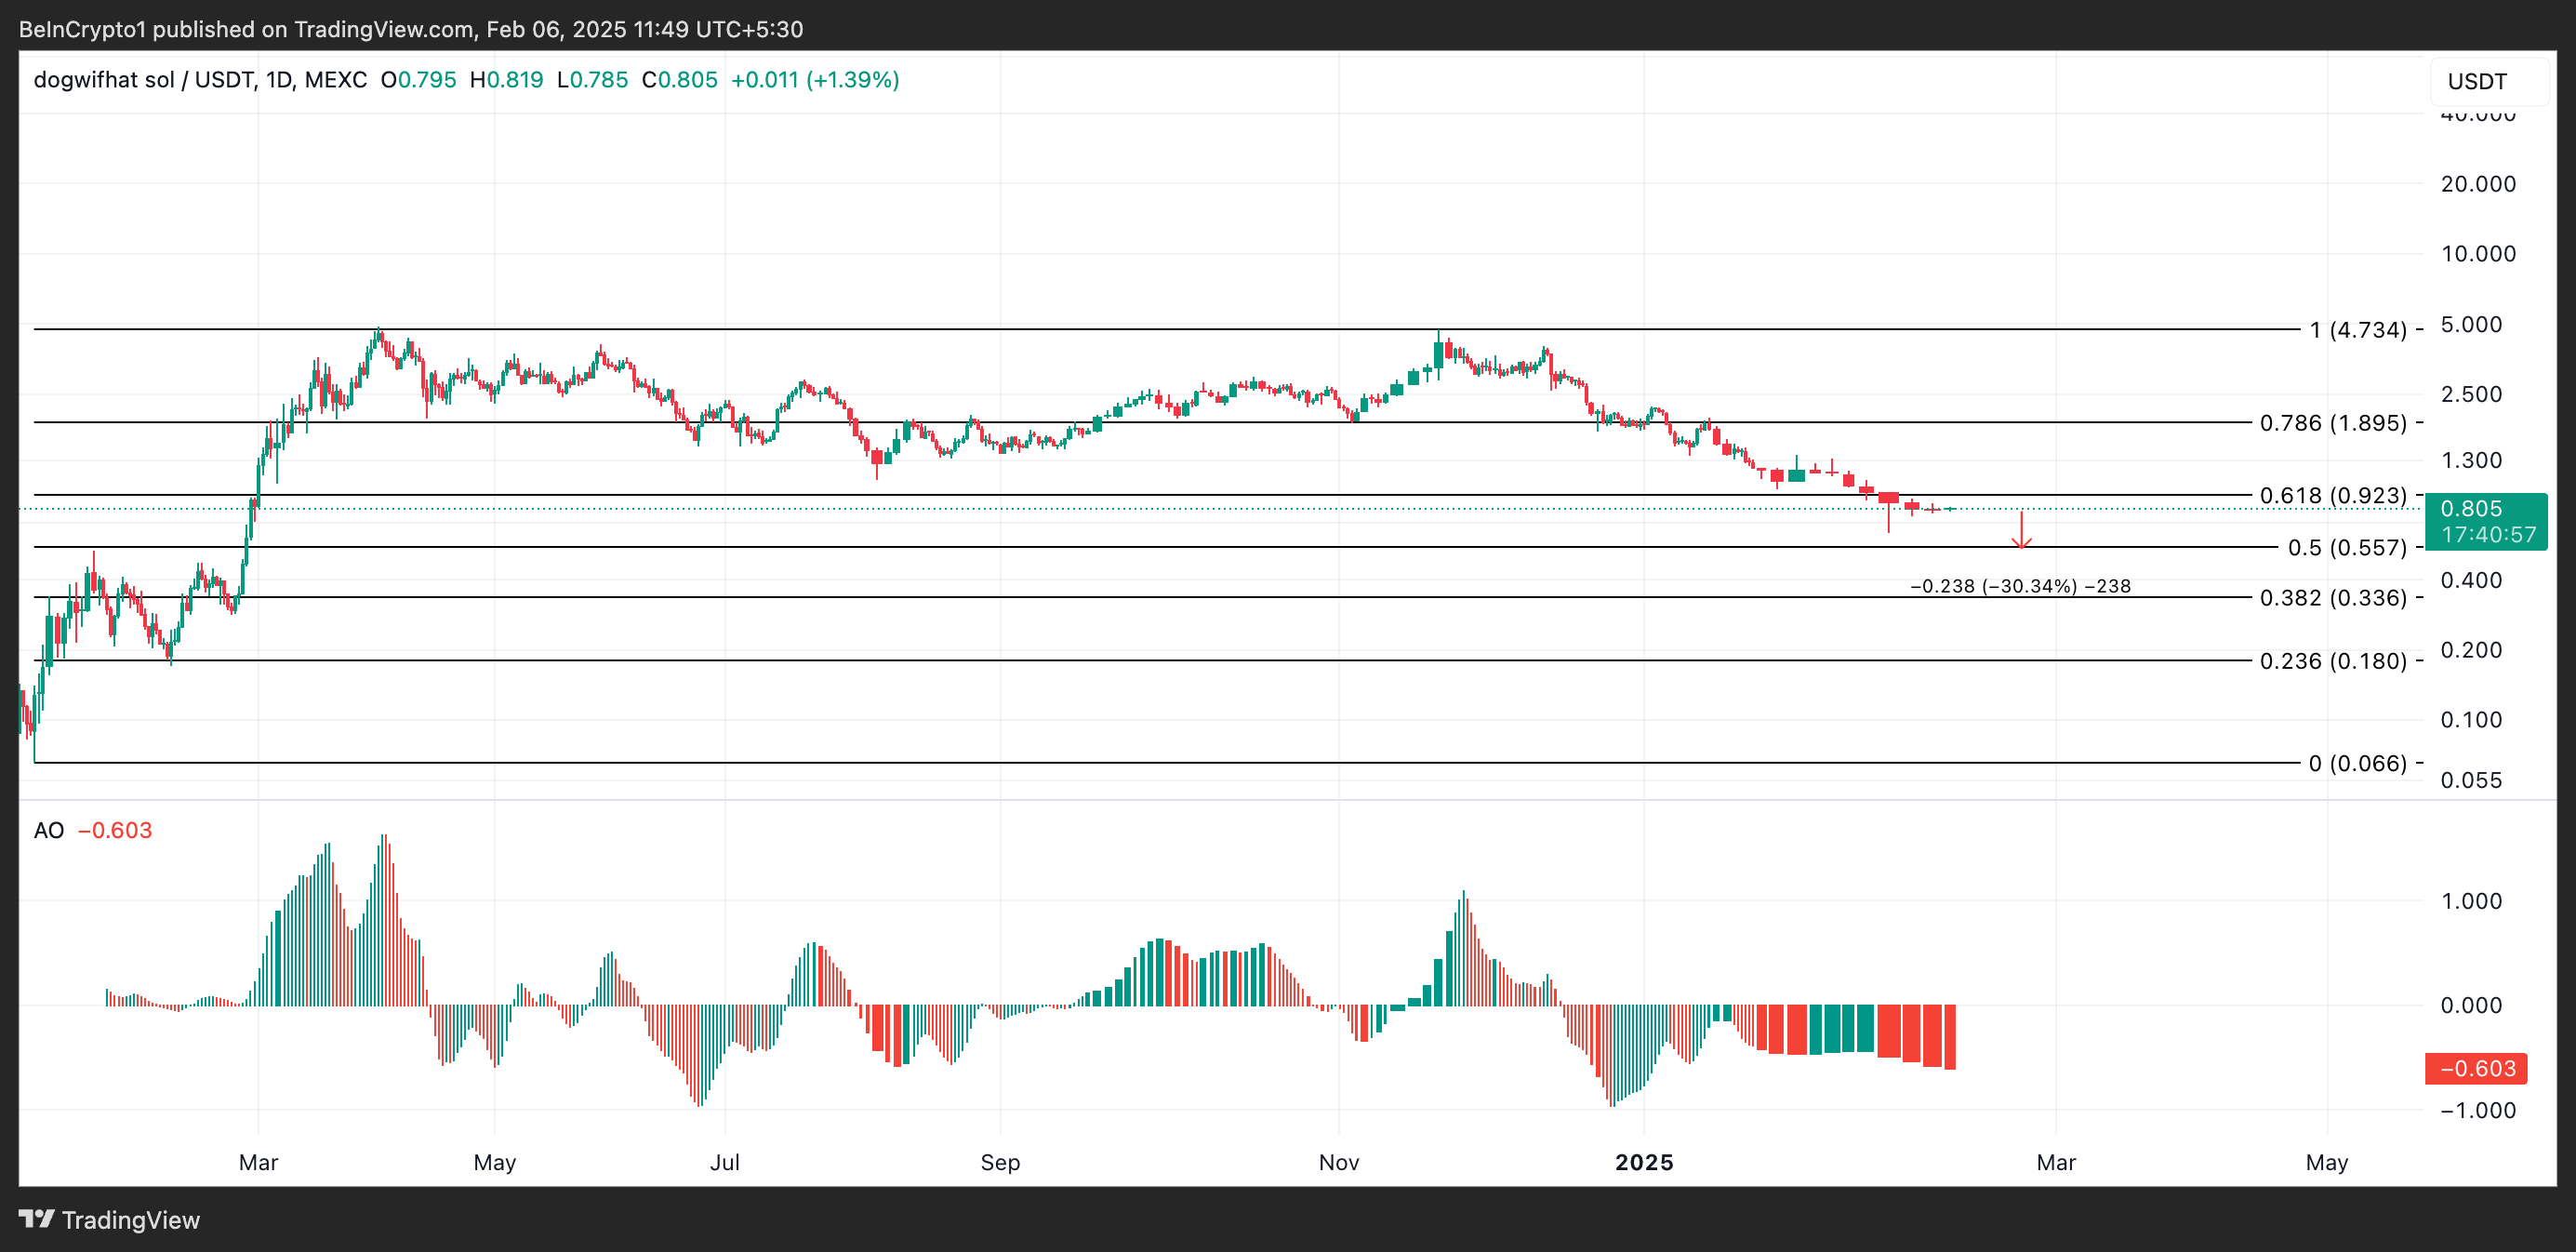
However, if the meme coin sees a resurgence in demand, it could propel its price past the resistance at $0.92 and toward $1.89.
Disclaimer
In line with the Trust Project guidelines, this price analysis article is for informational purposes only and should not be considered financial or investment advice. BeInCrypto is committed to accurate, unbiased reporting, but market conditions are subject to change without notice. Always conduct your own research and consult with a professional before making any financial decisions. Please note that our Terms and Conditions, Privacy Policy, and Disclaimers have been updated.

Dogecoin started a recovery wave above the $0.240 zone against the US Dollar. DOGE is now consolidating and might face hurdles near $0.270.
- DOGE price started a recovery wave above the $0.2350 and $0.2420 levels.
- The price is trading below the $0.2780 level and the 100-hourly simple moving average.
- There is a major bearish trend line forming with resistance at $0.260 on the hourly chart of the DOGE/USD pair (data source from Kraken).
- The price could start another increase if it clears the $0.260 and $0.270 resistance levels.
Dogecoin Price Faces Resistance
Dogecoin price started a fresh decline from the $0.3450 resistance zone, like Bitcoin and Ethereum. DOGE dipped below the $0.300 and $0.250 support levels. It even spiked below $0.220.
The price declined over 25% and tested the $0.20 zone. A low was formed at $0.20 and the price is now rising. There was a move above the 50% Fib retracement level of the downward wave from the $0.3415 swing high to the $0.20 low.
However, the bears are active near the $0.280 zone. Dogecoin price is now trading below the $0.270 level and the 100-hourly simple moving average. Immediate resistance on the upside is near the $0.260 level.
There is also a major bearish trend line forming with resistance at $0.260 on the hourly chart of the DOGE/USD pair. The first major resistance for the bulls could be near the $0.270 level. The next major resistance is near the $0.2850 level or the 61.8% Fib retracement level of the downward wave from the $0.3415 swing high to the $0.20 low.

A close above the $0.2850 resistance might send the price toward the $0.300 resistance. Any more gains might send the price toward the $0.320 level. The next major stop for the bulls might be $0.3420.
Another Decline In DOGE?
If DOGE’s price fails to climb above the $0.270 level, it could start another decline. Initial support on the downside is near the $0.2420 level. The next major support is near the $0.2250 level.
The main support sits at $0.220. If there is a downside break below the $0.220 support, the price could decline further. In the stated case, the price might decline toward the $0.2020 level or even $0.200 in the near term.
Technical Indicators
Hourly MACD – The MACD for DOGE/USD is now losing momentum in the bearish zone.
Hourly RSI (Relative Strength Index) – The RSI for DOGE/USD is now below the 50 level.
Major Support Levels – $0.2420 and $0.2250.
Major Resistance Levels – $0.2700 and $0.2850.

Does Kraken Know Satoshi Nakamoto’s True Identity?

Trump’s Tariffs and Inflation to Fuel Market Uncertainty, JPMorgan
OKX Chief Marketing Officer Highlights Economic Dangers of a US Strategic Bitcoin Reserve

Cboe seeks US SEC nod for spot Ethereum ETF options
Dogecoin Whales Bag 750M DOGE Amid Recent Market Dip, What’s Next?

WIF Price Plunges to Yearly Lows – Bearish Trend Ahead?

2.52 Million Altcoins Are Ruining Crypto’s Future

Animoca Brands Valuation Tanks 75% In Two Years, Here’s Why

Crypto exchange BingX hacked for $43 million

Are The Big Players Losing Interest?

Hong Kong’s Securities Association Tips Authorities On Crypto Self-Regulation

Coinbase cbBTC Set to go Live on Solana
2.52 Million Altcoins Are Ruining Crypto’s Future
Animoca Brands Valuation Tanks 75% In Two Years, Here’s Why
Crypto exchange BingX hacked for $43 million
Are The Big Players Losing Interest?
Hong Kong’s Securities Association Tips Authorities On Crypto Self-Regulation
Coinbase cbBTC Set to go Live on Solana
-
 Regulation23 hours ago
Kraken appoints former Paxos executive as its new chief legal officer
-

 Regulation24 hours ago
India’s financial regulator fines Bybit $1M, compliance status unclear
-
 Market23 hours ago
Why Traders Hold Hope for an Upcoming Rally?
-

 Market18 hours ago
MEXC Fuels DeFi Innovation and Liquidity Security with the Berachain (BERA) Listing
-
 Market17 hours ago
Berachain Airdrop Details Announced Ahead of Mainnet Launch
-

 Regulation17 hours ago
FDIC to Allow Banks to Manage Crypto Assets and Token Deposits
-

 Market16 hours ago
AVAX Faces Downward Trend as Whales Pull Out $272 Million
-
 Altcoin16 hours ago
What’s Happening With Solana Price