
Market
What Are Crypto Whales Buying After the Market Crash?

Whales bought heavily during the recent market downturn, signaling renewed confidence in WLD, VIRTUAL, and ONDO. WLD ended 2024 with an 8% decline, but whale accumulation has pushed large holder addresses to all-time highs.
VIRTUAL, one of the hardest-hit AI tokens with a 71% drop, is now seeing a resurgence in whale buying, hinting at a potential recovery. Meanwhile, ONDO remains strong, up 5% in the last week, with steady accumulation from large investors reinforcing its position as a leading Real-World Assets (RWA) project.
Worldcoin (WLD)
Worldcoin ended 2024 with a disappointing 8% decline, frustrating many investors. This underperformance was even more noticeable as crypto AI agents gained traction late in the year, attracting users and capital.
Despite this, whales bought heavily during the recent market downturn, indicating renewed confidence in WLD’s long-term potential.
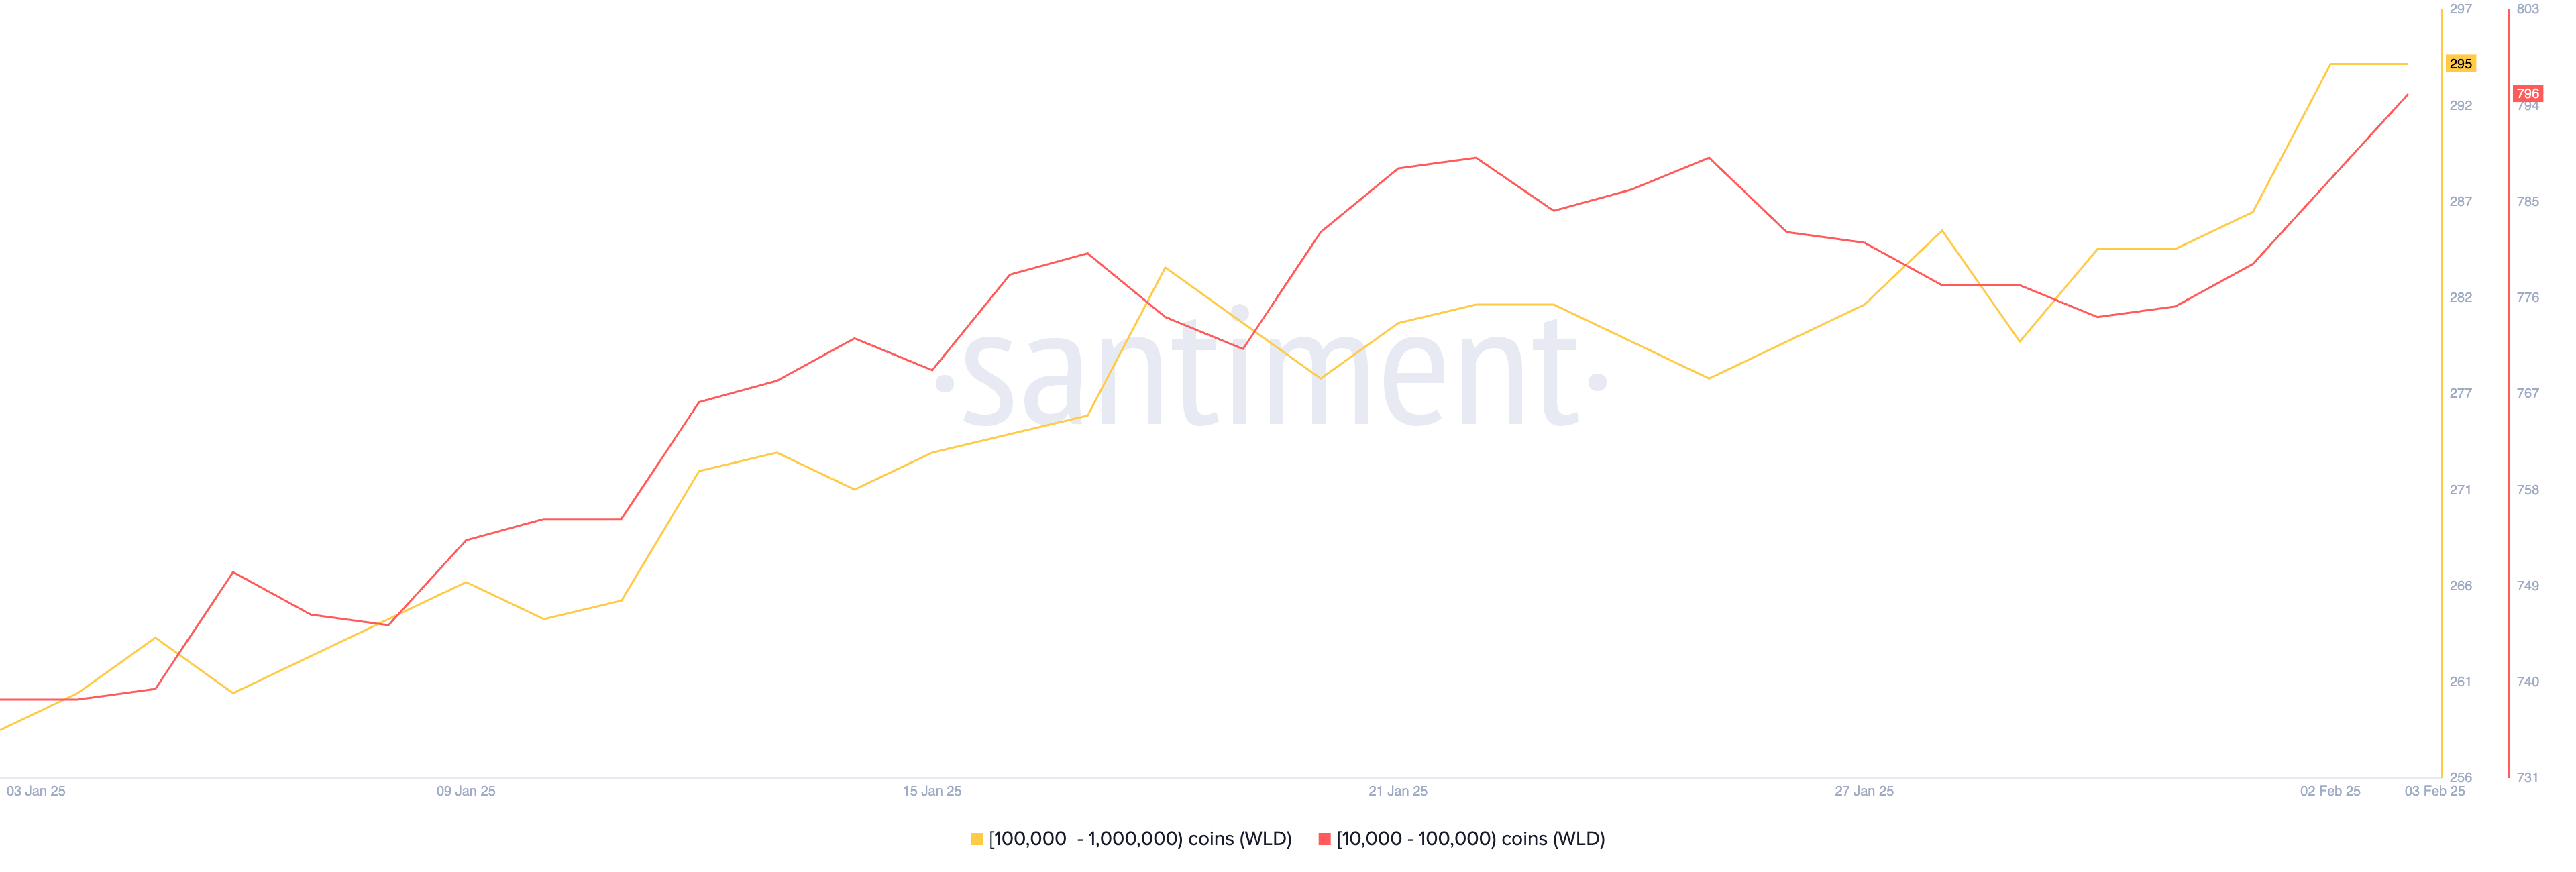
Since January 31, the number of whales holding between 10,000 and 100,000 WLD, as well as those holding between 100,000 and 1,000,000 WLD, has surged to new all-time highs.
This aggressive accumulation suggests that large investors see value at current levels, despite WLD and the overall artificial intelligence market struggles. If whale buying continues, it could provide much-needed support for a potential recovery in the coming weeks.
Virtuals Protocol (VIRTUAL)
VIRTUAL was one of the hardest-hit AI tokens in the market, plunging 71% between January 3 and February 3.
This steep decline made it one of the biggest losers among top artificial intelligence cryptos, reflecting the broader sell-off in speculative sectors. Despite this, recent data suggests that whale activity could be signaling a potential shift in sentiment.
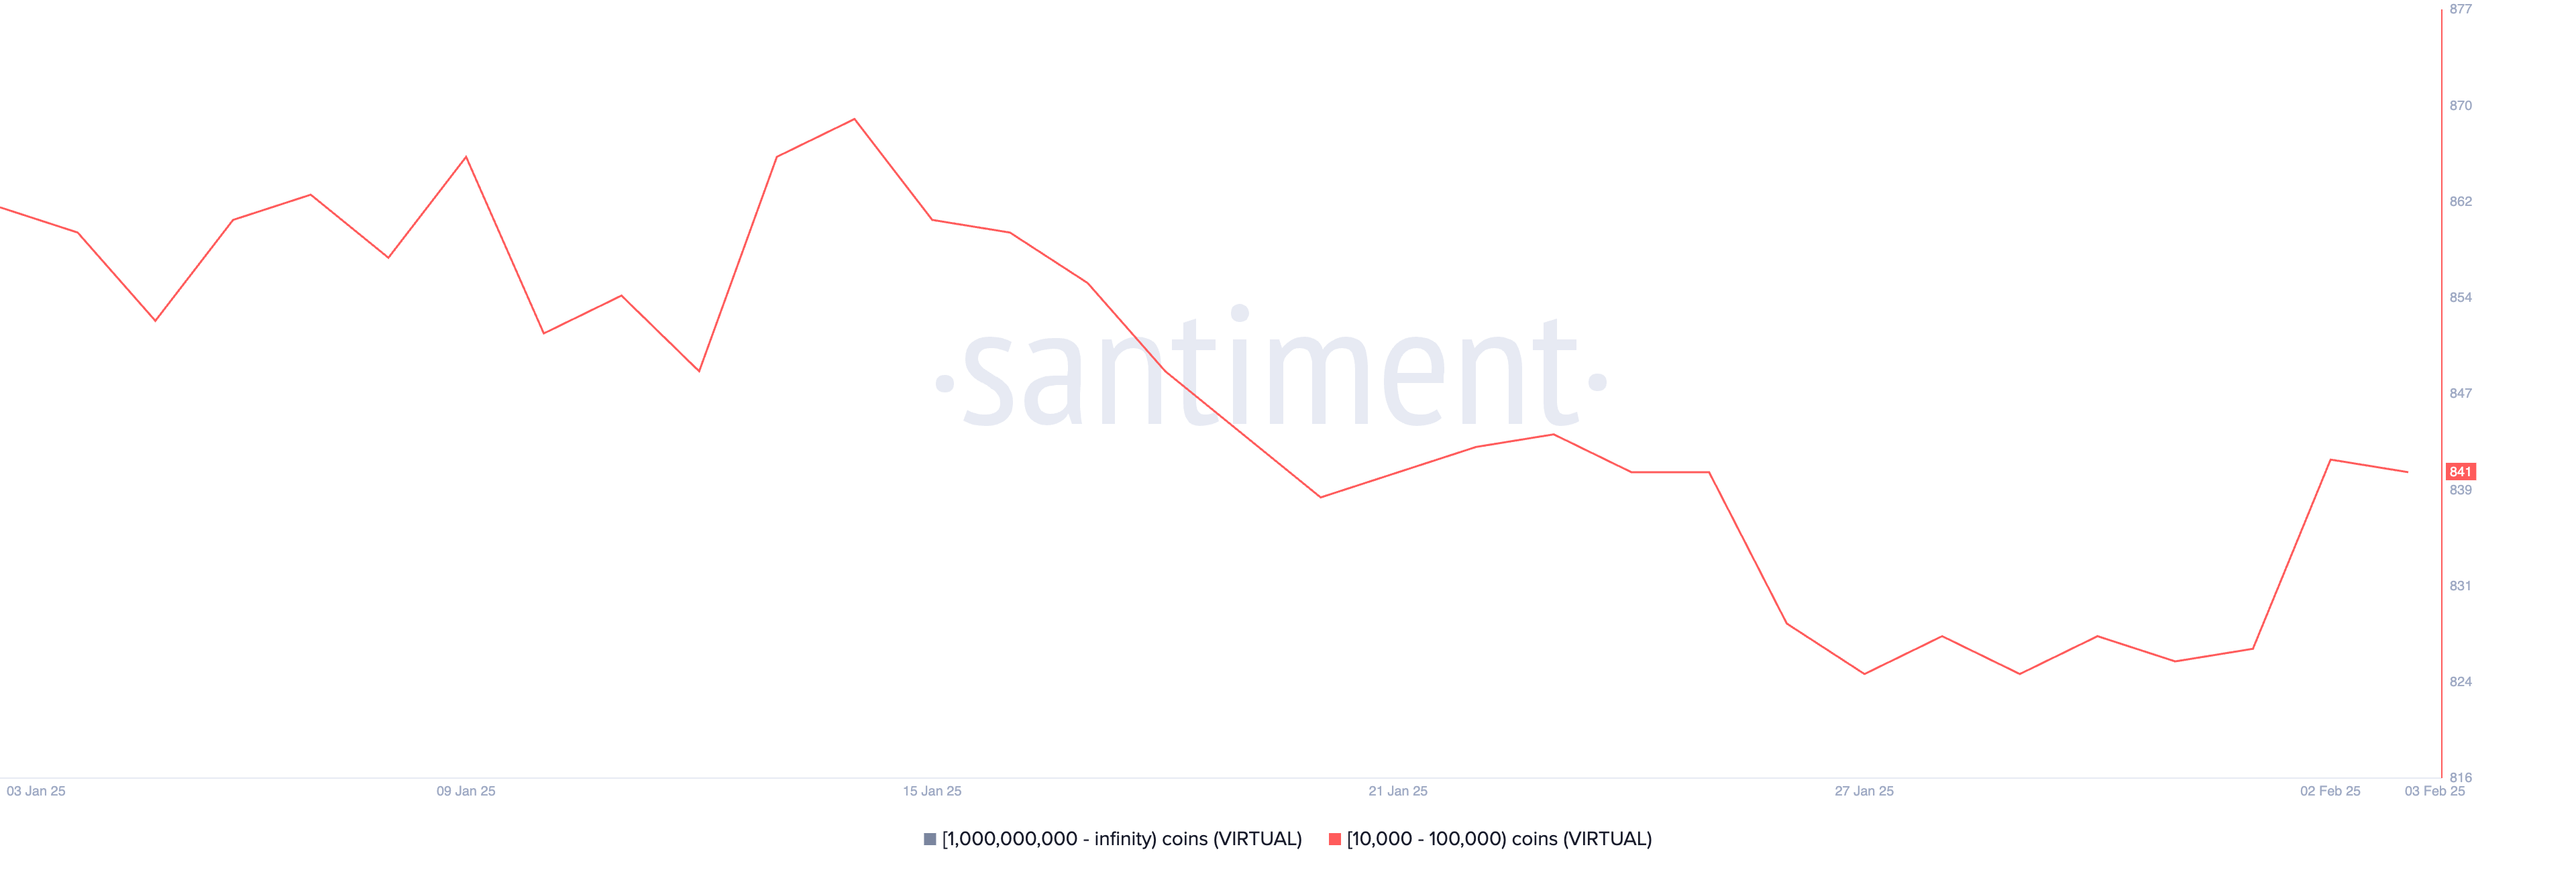
The number of whales holding between 10,000 and 100,000 VIRTUAL had stabilized after dropping from 841 on January 25 to 825 on January 27.
However, following the latest market crash, accumulation has resumed, with whale addresses rising from 827 on February 1 to 841 now.
Ondo (ONDO)
ONDO has established itself as one of the leading Real-World Assets (RWA) projects, surging 453% in 2024. Even amid the broader crypto market correction, ONDO has remained resilient, posting a 5% gain over the last seven days, as RWA is one of the most relevant crypto narratives for the next weeks.
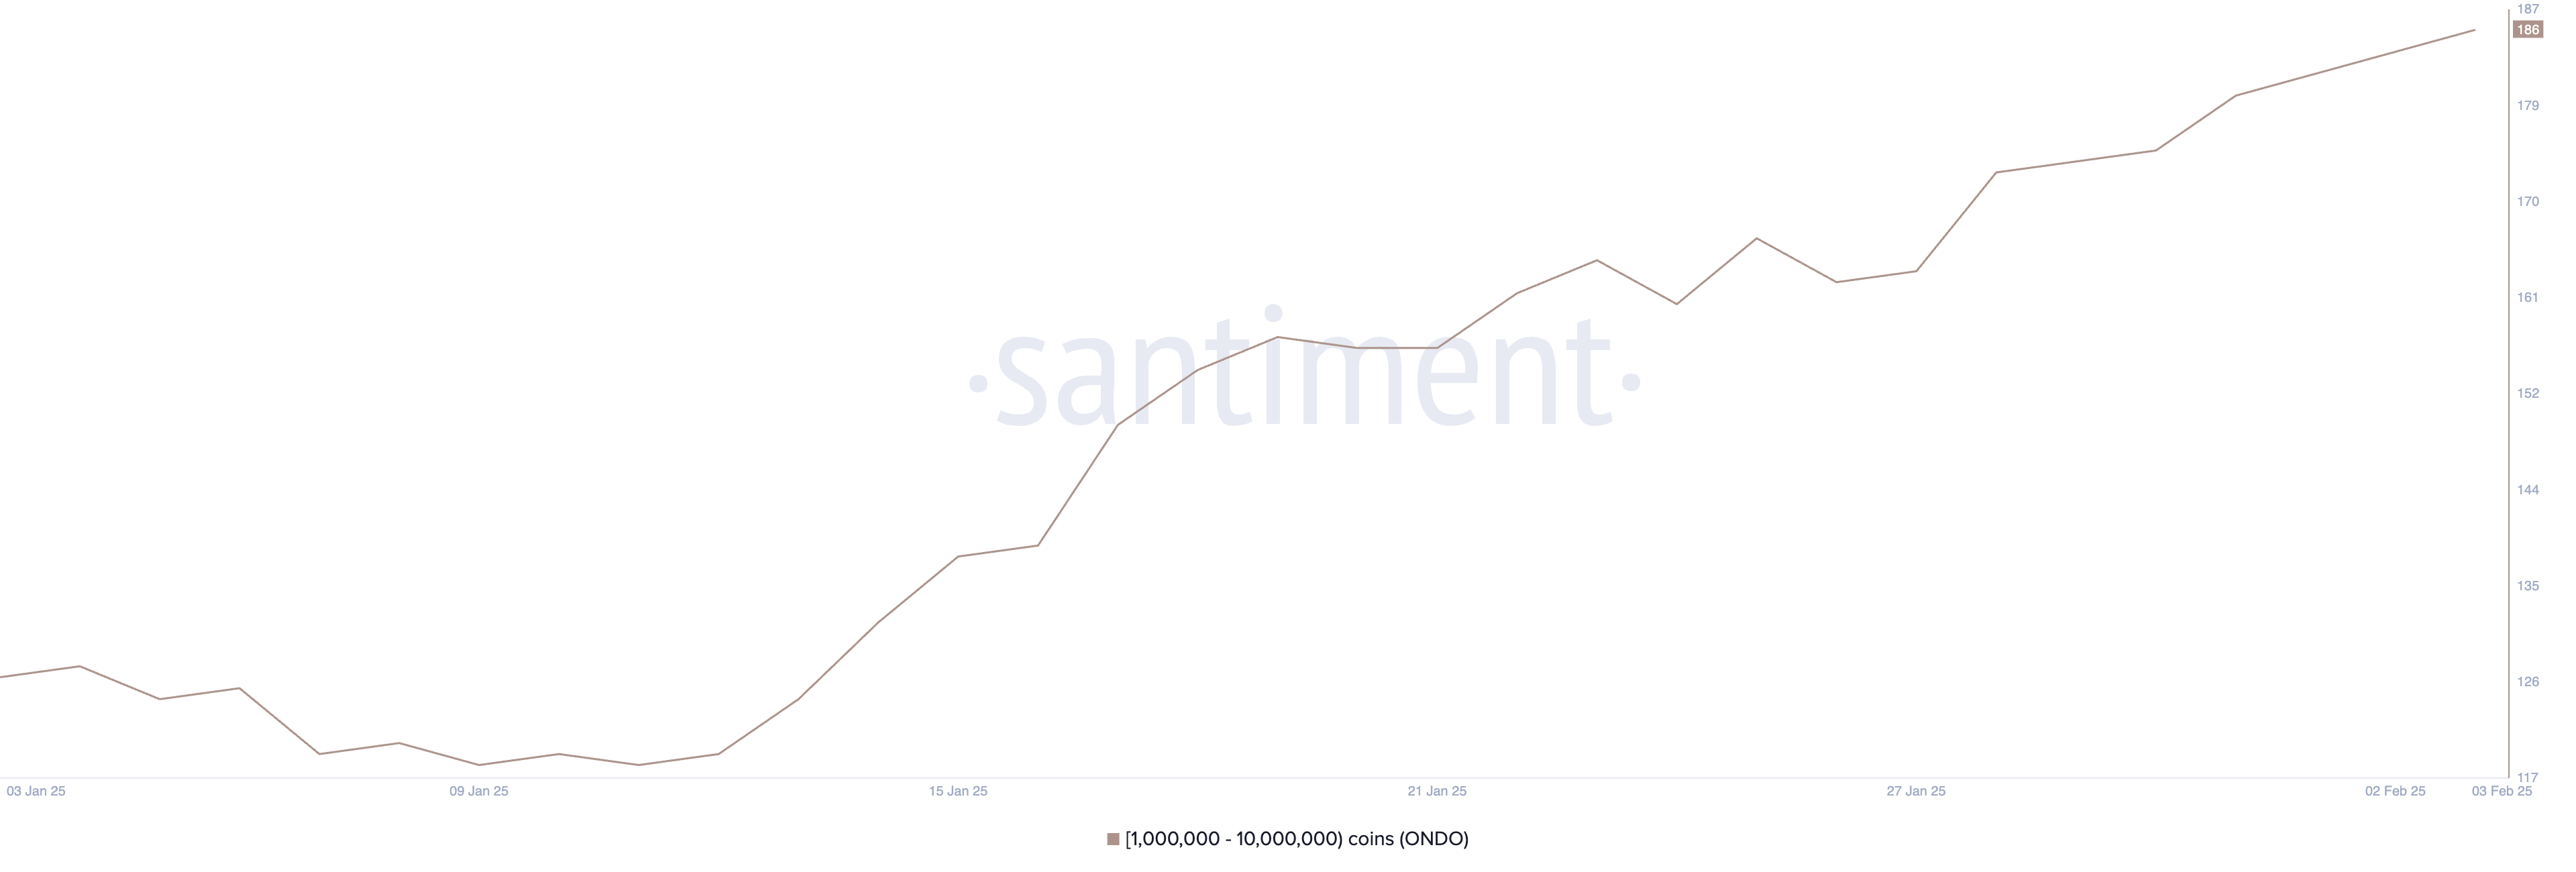
The number of addresses holding at least 1,000,000 ONDO has been steadily increasing since January 12, rising from 180 to 186 between January 31 and February 3.
This accumulation, especially after the recent market downturn, suggests that large holders remain confident in ONDO’s long-term potential. Despite market volatility, the steady growth in whale addresses indicates that institutional and high-net-worth investors are still positioning themselves in ONDO.
Disclaimer
In line with the Trust Project guidelines, this price analysis article is for informational purposes only and should not be considered financial or investment advice. BeInCrypto is committed to accurate, unbiased reporting, but market conditions are subject to change without notice. Always conduct your own research and consult with a professional before making any financial decisions. Please note that our Terms and Conditions, Privacy Policy, and Disclaimers have been updated.


Ethereum price started a recovery wave above the $2,550 zone. ETH is showing positive signs but faces many hurdles near the $2,880 level.
- Ethereum started a decent upward move above the $2,550 zone.
- The price is trading below $2,880 and the 100-hourly Simple Moving Average.
- There is a short-term declining channel forming with resistance at $2,800 on the hourly chart of ETH/USD (data feed via Kraken).
- The pair could start a fresh decline if it stays below the $2,880 level.
Ethereum Price Recovery Faces Hurdles
Ethereum price started a recovery wave after it dropped heavily below $2,500, underperforming Bitcoin. ETH tested the $2,120 zone and recently started a recovery wave.
The price was able to surpass the $2,500 and $2,550 resistance levels. It even climbed above the 50% Fib retracement level of the downward move from the $3,402 swing high to the $2,127 swing low. However, the bears are now active near the $2,900 zone.
The price failed to clear the 61.8% Fib retracement level of the downward move from the $3,402 swing high to the $2,127 swing low. There is also a short-term declining channel forming with resistance at $2,800 on the hourly chart of ETH/USD.
Ethereum price is now trading below $2,880 and the 100-hourly Simple Moving Average. On the upside, the price seems to be facing hurdles near the $2,800 level.

The first major resistance is near the $2,880 level. The main resistance is now forming near $2,920. A clear move above the $2,920 resistance might send the price toward the $3,000 resistance. An upside break above the $3,000 resistance might call for more gains in the coming sessions. In the stated case, Ether could rise toward the $3,120 resistance zone or even $3,250 in the near term.
Another Drop In ETH?
If Ethereum fails to clear the $2,880 resistance, it could start another decline. Initial support on the downside is near the $2,640 level. The first major support sits near the $2,550.
A clear move below the $2,550 support might push the price toward the $2,500 support. Any more losses might send the price toward the $2,420 support level in the near term. The next key support sits at $2,350.
Technical Indicators
Hourly MACD – The MACD for ETH/USD is losing momentum in the bullish zone.
Hourly RSI – The RSI for ETH/USD is now below the 50 zone.
Major Support Level – $2,550
Major Resistance Level – $2,880

SUI price has been up roughly 4% in the last 24 hours but has remained down 30% over the past month. Despite slight recovery, its technical indicators still point to an overall bearish setup, with both the Ichimoku Cloud and EMA lines suggesting strong resistance ahead.
However, SUI continues to show impressive trading activity, ranking as the sixth-largest blockchain by daily volume, ahead of Avalanche and Polygon. Whether SUI can sustain this momentum and reclaim $4 in the coming days will depend on its ability to break key resistance levels and confirm a trend reversal.
SUI Is Now The 6th Largest Chain In Terms of Daily Volume
SUI blockchain daily volume reached $615 million in the last 24 hours, making it the sixth-largest blockchain by volume. This puts it ahead of well-established networks like Avalanche, Hyperliquid, Polygon, and Tron, signaling strong market activity.
While SUI is a relatively new player, its ability to generate such a high volume suggests growing interest from traders and investors.
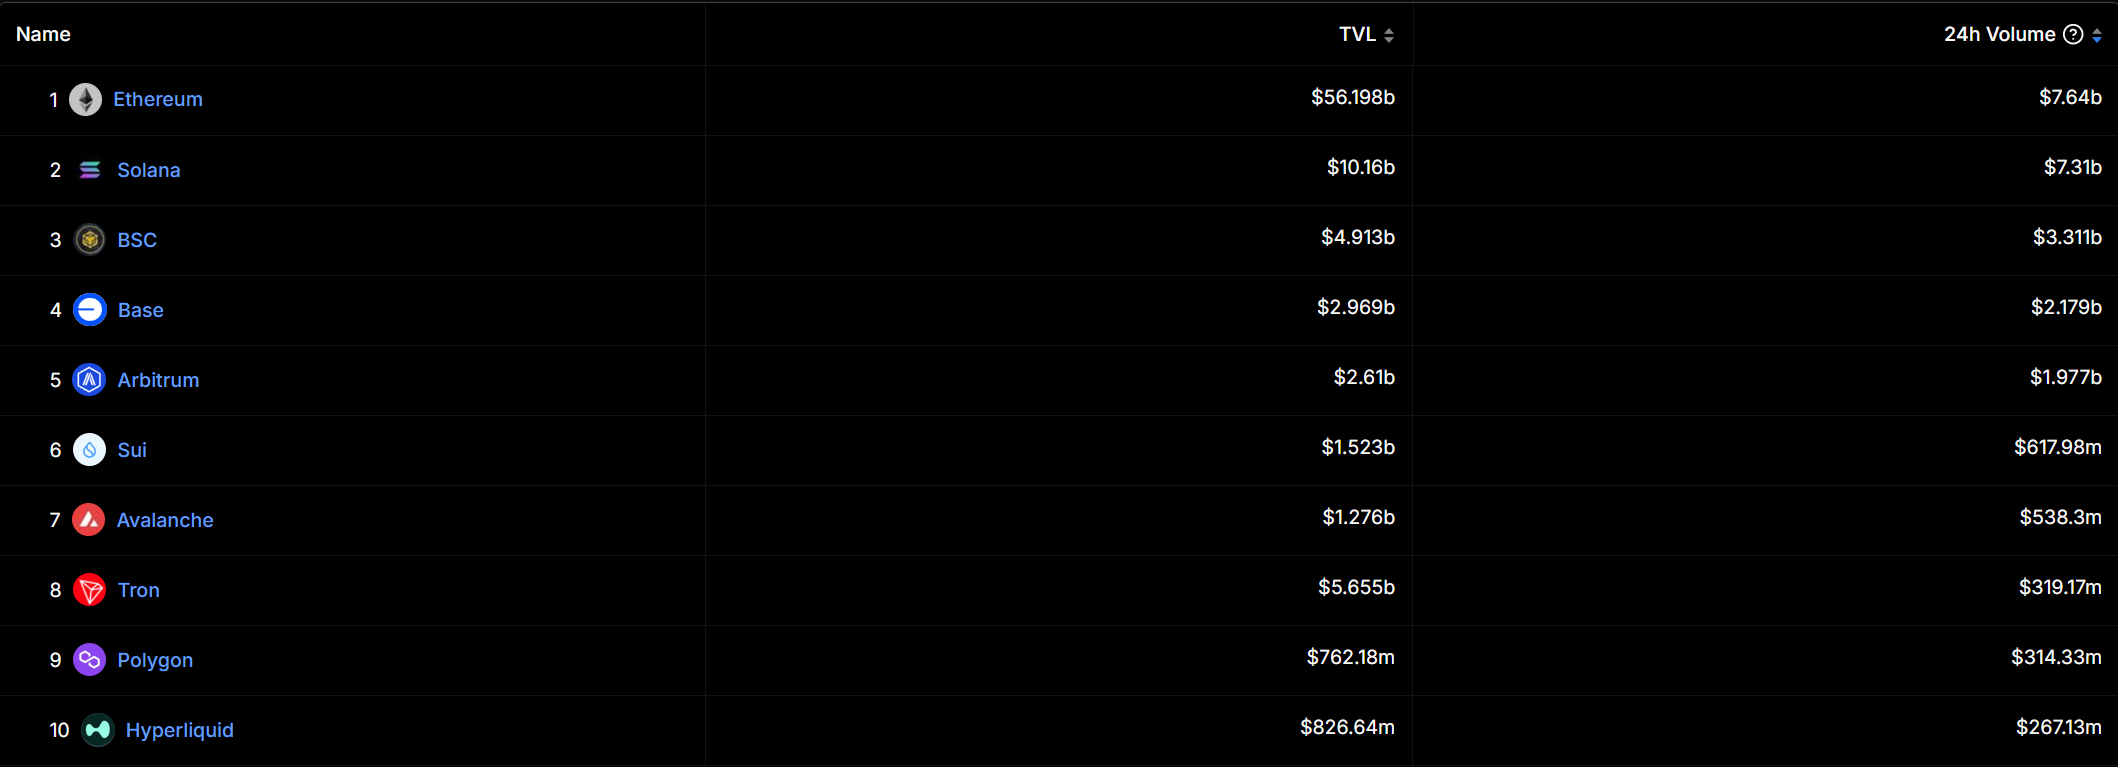
Tracking daily volume is crucial for blockchains as it reflects user engagement, liquidity, and overall demand. Despite attracting $615 million in daily volume, SUI still has far fewer protocols than older networks like Avalanche and Polygon.
This suggests that while its ecosystem is not yet as developed, the strong trading activity could drive more projects to build on SUI, potentially accelerating its adoption and growth.
Ichimoku Cloud Pictures a Bearish Setup for SUI
The Ichimoku Cloud chart shows that the SUI price is currently trading below the cloud, indicating that the broader trend remains bearish. The cloud itself is thick and sloping downward, suggesting strong resistance overhead and a continuation of the downtrend if momentum doesn’t shift.
The conversion line (blue) has recently turned upward and is attempting to cross the baseline (red), which could be an early signal of potential short-term bullish momentum. However, the lagging span (green) is still below the price and the cloud, reinforcing that the longer-term trend has not yet shifted bullish.
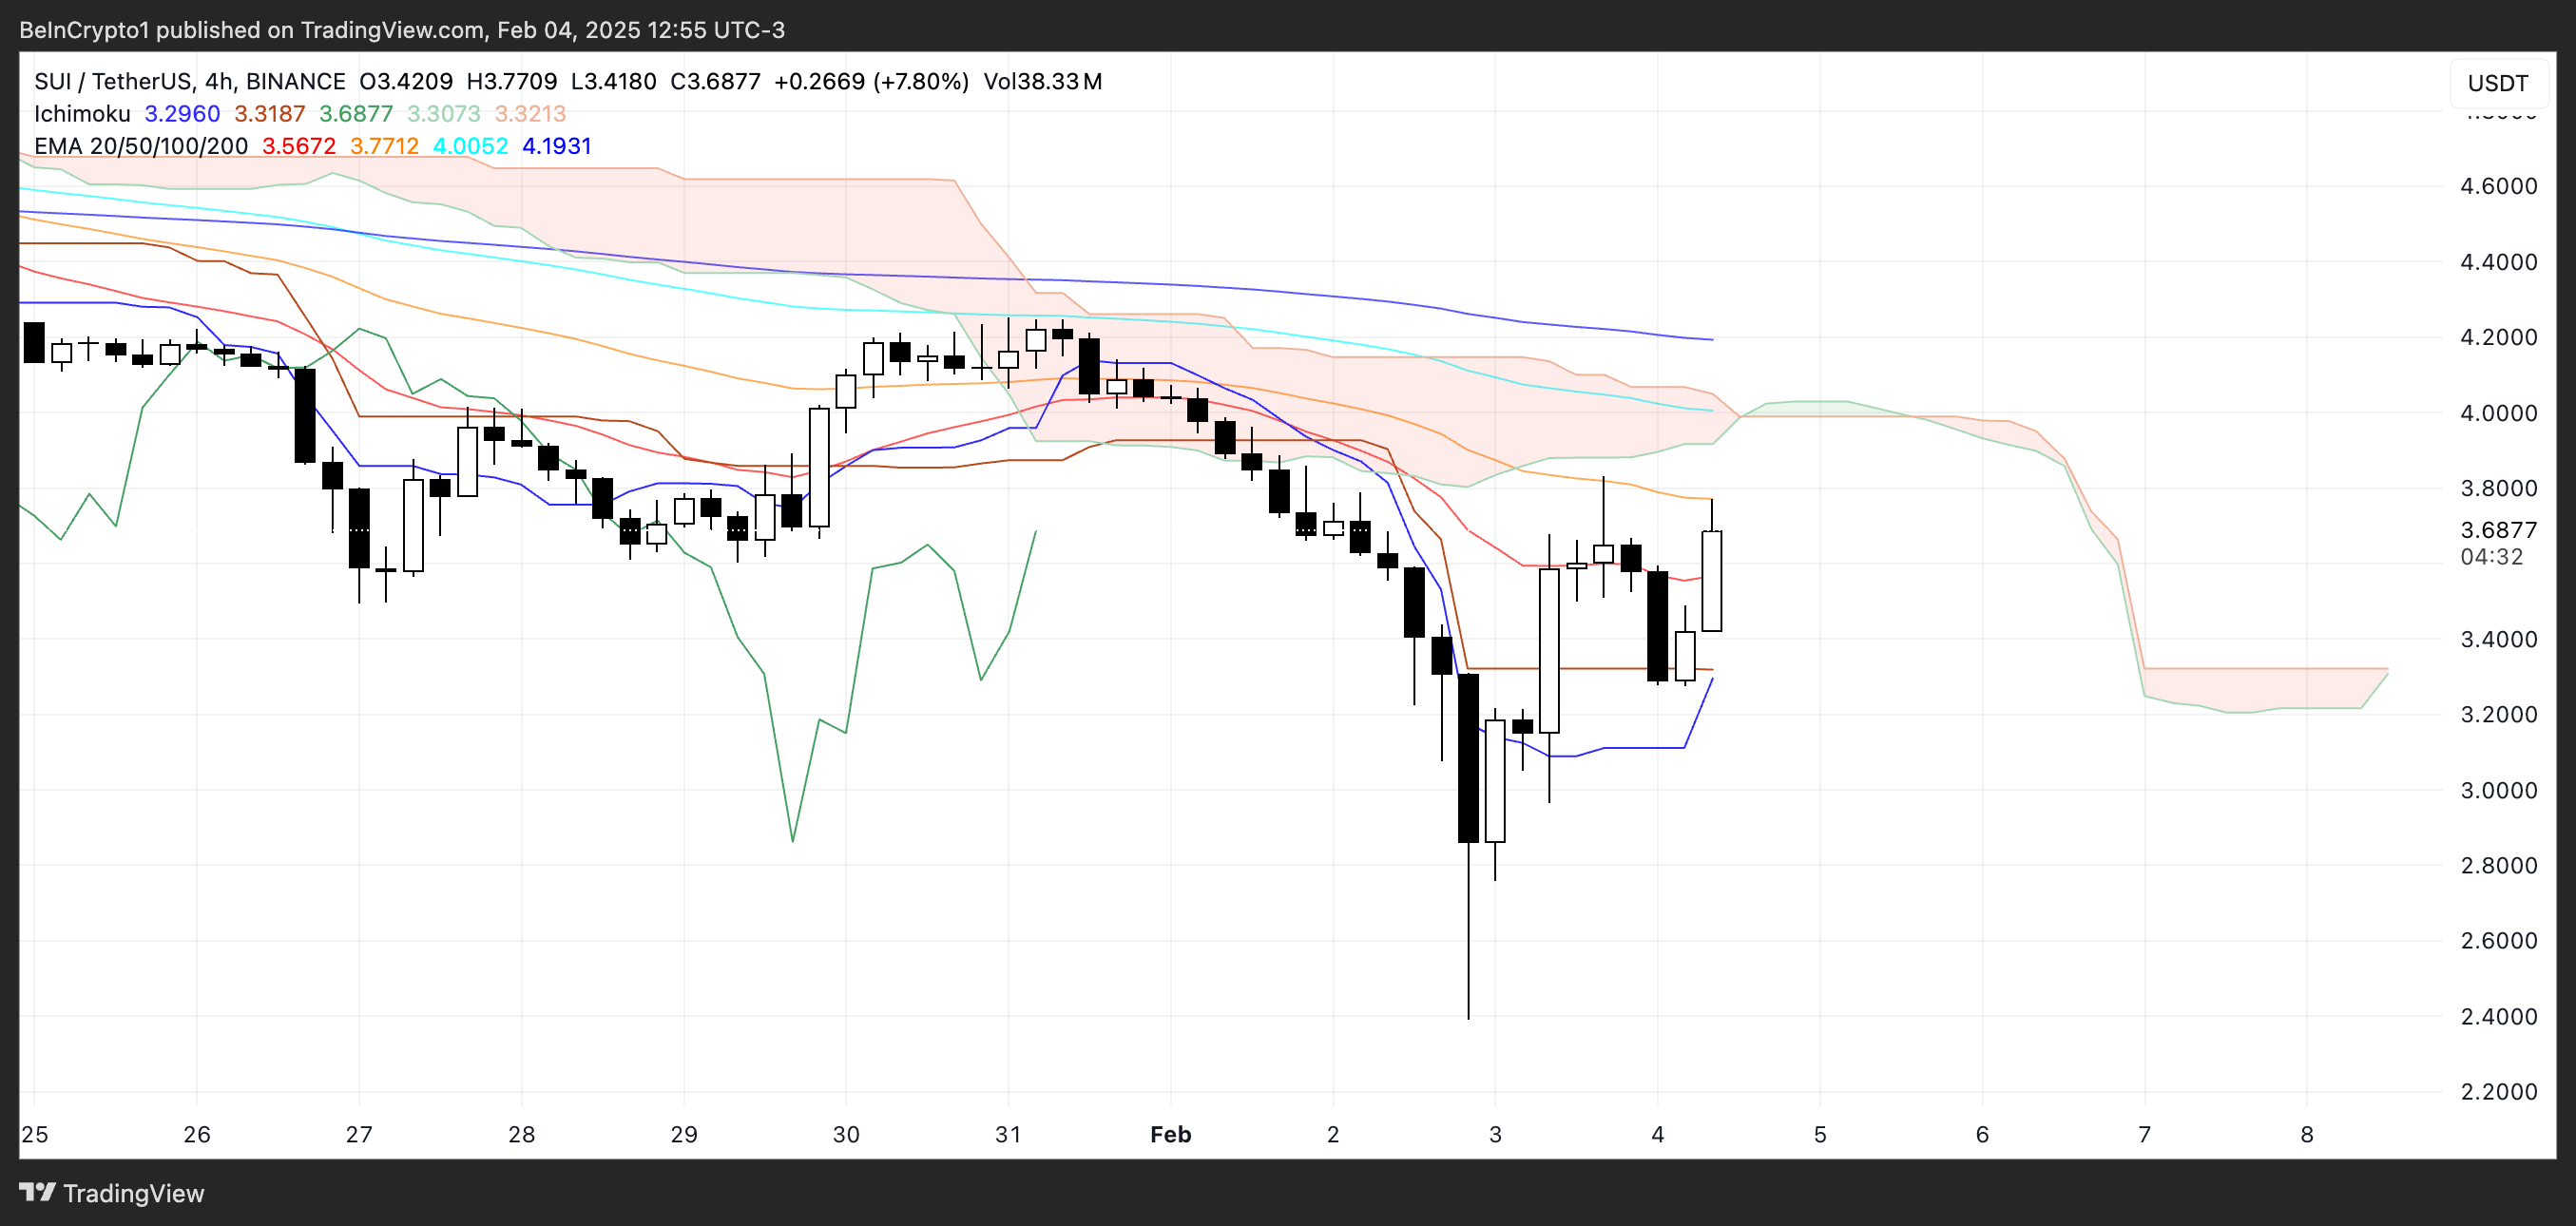
The future cloud is also forming a bearish structure, with its leading span A (green) below leading span B (red), showing that bearish momentum still dominates.
Despite the recent price jump, the cloud remains a strong resistance zone, and unless the price can break above it and confirm a trend reversal, the overall sentiment remains cautious. The fact that SUI price is hovering near the lower edge of the cloud suggests a period of consolidation before a clearer trend direction emerges.
SUI Price Prediction: Can SUI Reclaim $4 In The Next Days?
SUI EMA lines remain bearish, with short-term moving averages still below the longer-term ones despite the recent price surge. This suggests that while momentum has improved, the overall trend has not yet reversed into a clear uptrend.
If the current bullish momentum continues, SUI price could test $3.94, and a breakout above that level could lead to a move toward $4.25. A stronger trend shift could push the price even higher, potentially reaching $4.76 or $5.14 in the coming weeks.
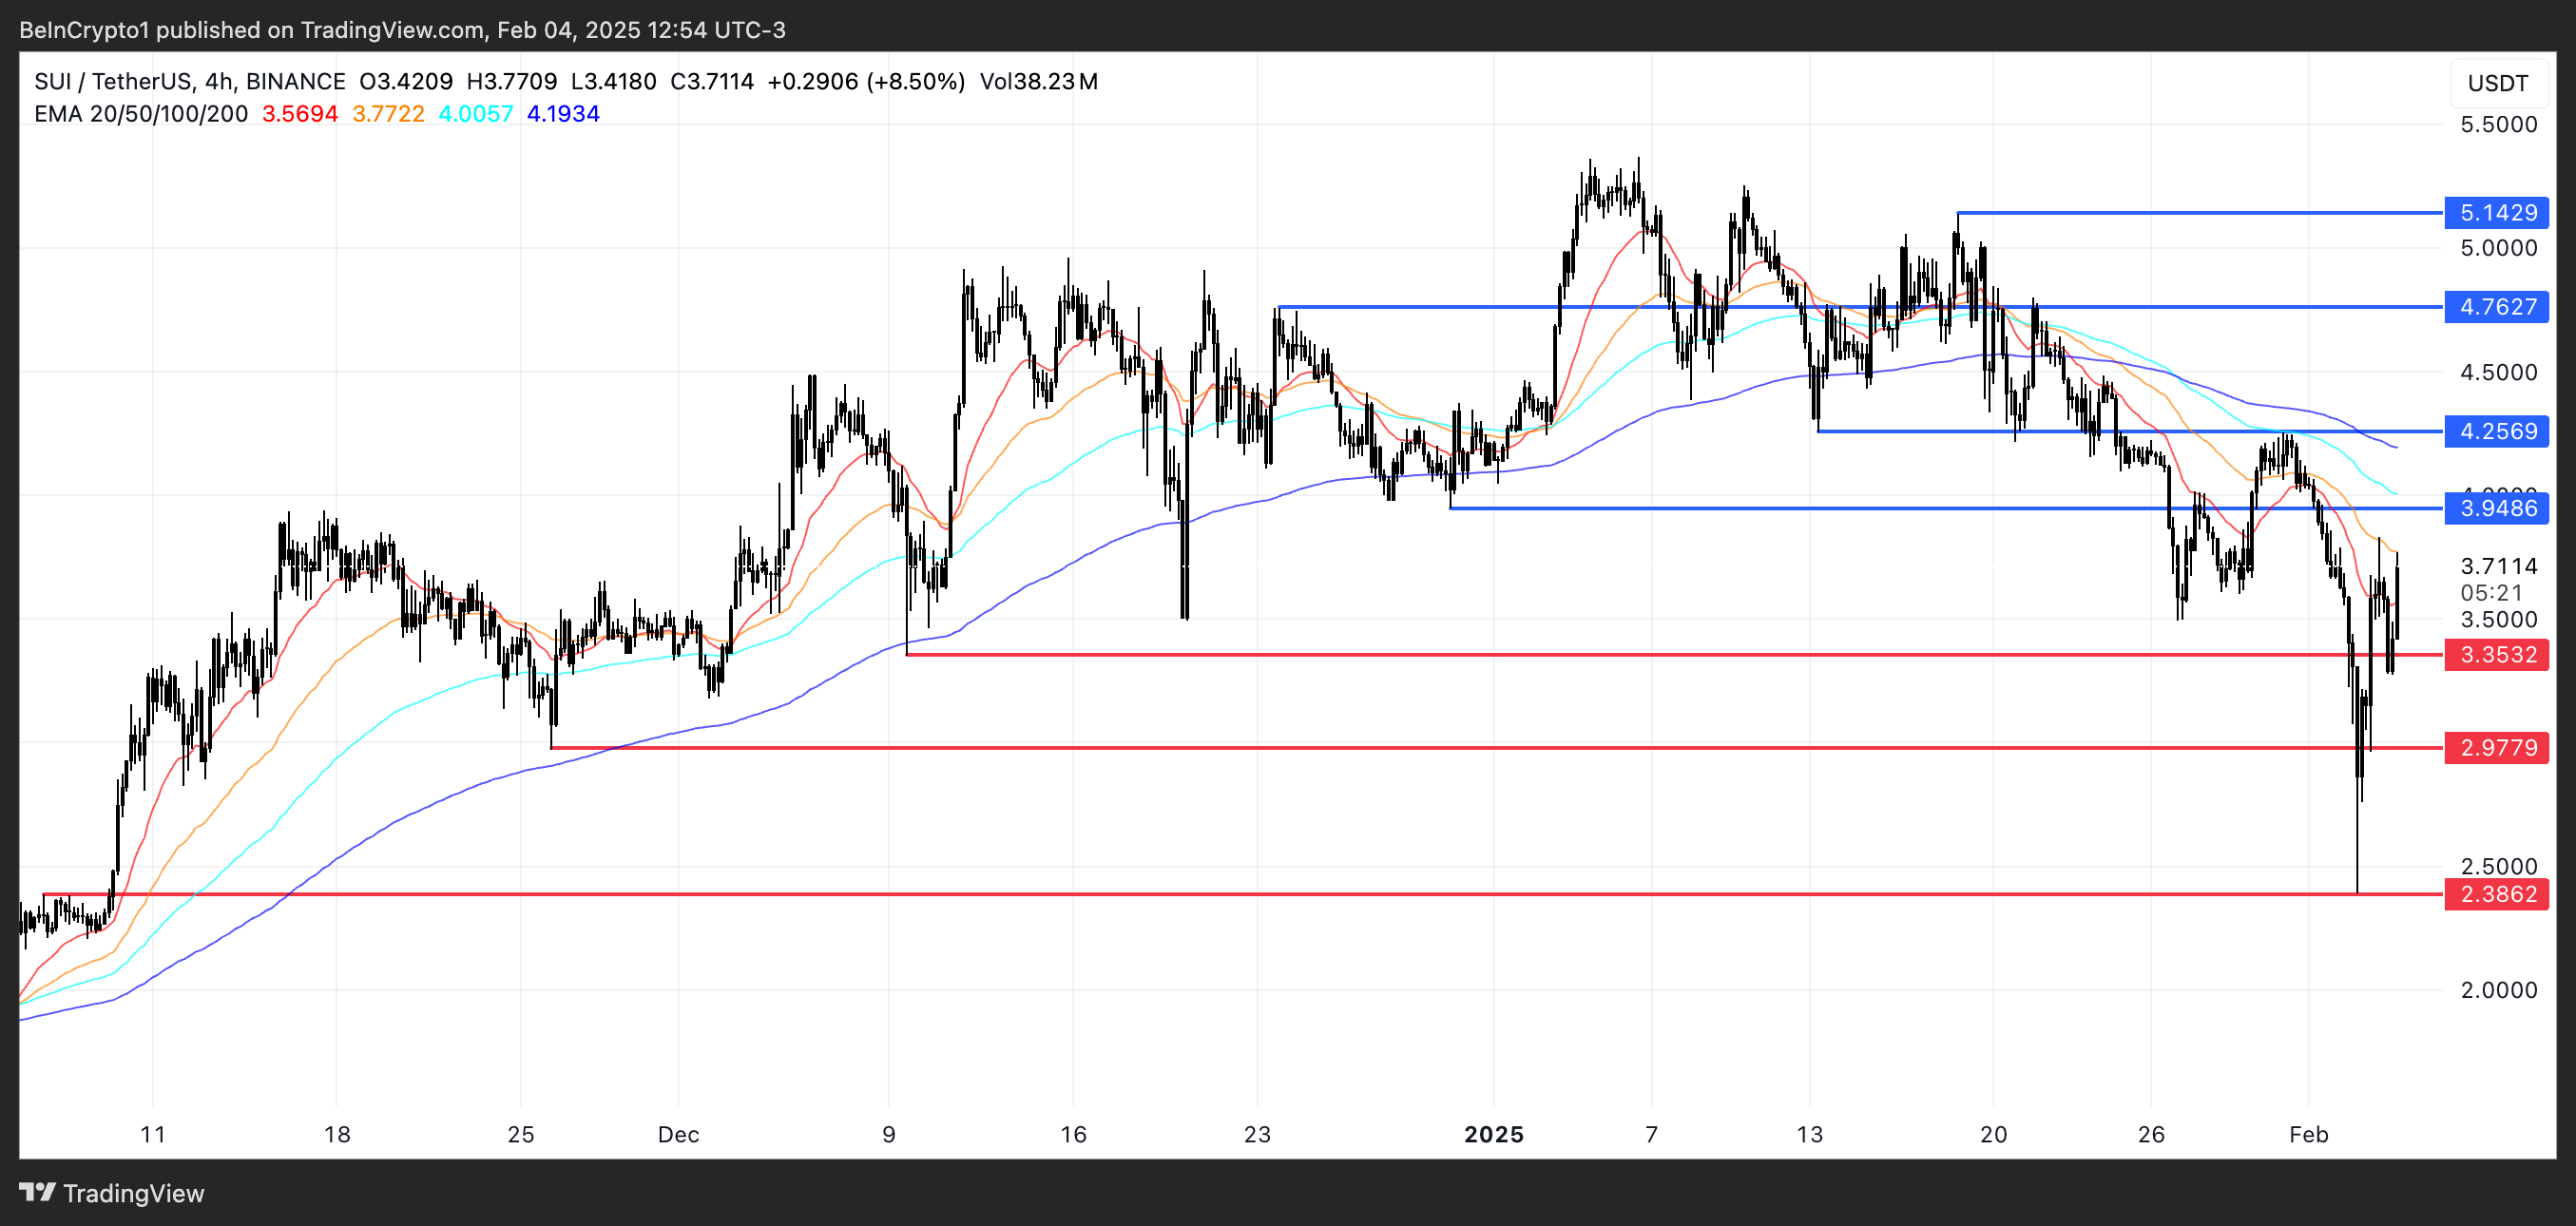
However, as both the Ichimoku Cloud and EMA structure indicate, the broader market sentiment for SUI is still bearish. If the price fails to maintain its current momentum and tests support at $3.35, losing that level could lead to a further drop below $3.
In that scenario, SUI price could decline toward $2.97, and if selling pressure remains strong, it might fall as low as $2.38. Until a decisive trend shift occurs, the market remains in a cautious phase, with both upside and downside possibilities in play.
Disclaimer
In line with the Trust Project guidelines, this price analysis article is for informational purposes only and should not be considered financial or investment advice. BeInCrypto is committed to accurate, unbiased reporting, but market conditions are subject to change without notice. Always conduct your own research and consult with a professional before making any financial decisions. Please note that our Terms and Conditions, Privacy Policy, and Disclaimers have been updated.

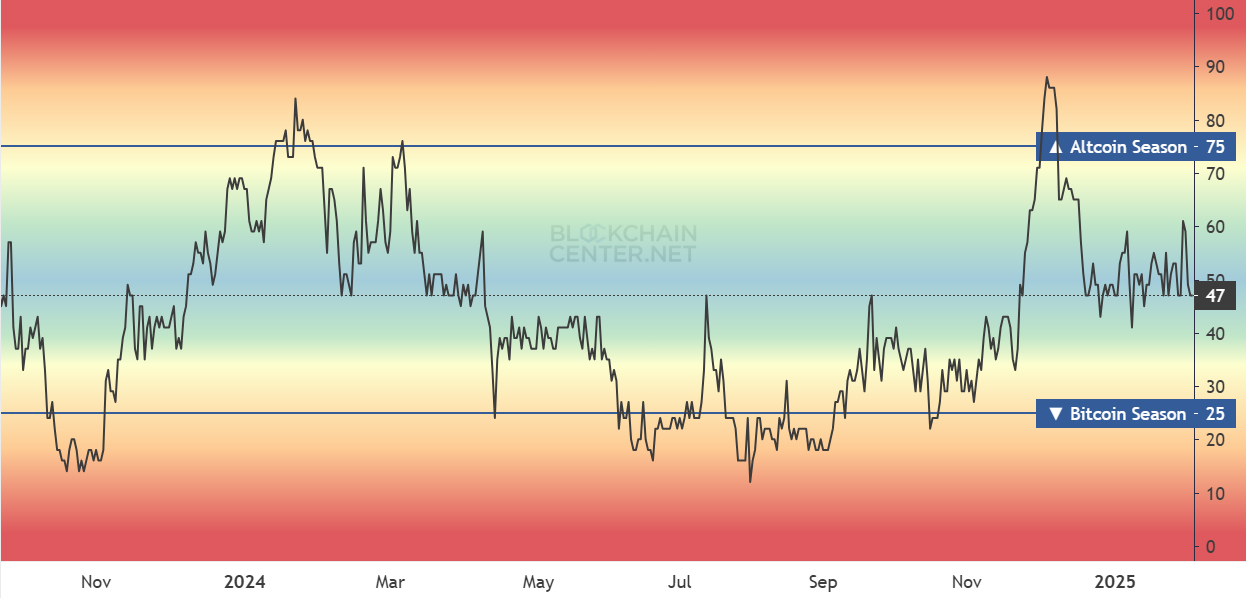
Crypto analysts are abuzz amid individual and joint attempts to dissect the impact of the Solana-based token-launching platform, Pump.fun, on the altcoin market.
Analysts and traders are divided over whether the platform has single-handedly derailed the much-anticipated altcoin season by diverting liquidity away from traditional crypto assets.
Analysts Make A Case Against Pump.fun
Miles Deutscher pointed to the Solana-based token generator as a major reason behind the delayed altcoin season. The renowned crypto analyst observes that the current market dynamic differs from previous cycles, where speculative capital flowed into altcoins with solid liquidity.
“The launch of Pump Fun is directly correlated to the destruction of the altcoin market vs. BTC. The reason we’ve seen no major ‘alt season’ across majors is because the speculative capital that would’ve once poured into top 200 assets instead flooded into on-chain low caps,” Deutscher articulated.
Instead, retail investors have been lured into illiquid on-chain meme coins, many of which have retraced 70-80% from their peaks. This aligns with a recent survey, which established that more than 60% of Pump.fun traders have lost money.
The shift led to significant losses for latecomers, exacerbating bearish sentiment in the market and postponing the colloquial altcoin season.
Historically, altcoin seasons follow Bitcoin’s price surges as capital rotates to projects with strong fundamentals. Ideally, the altcoin season was due a few months after Bitcoin’s then all-time high of $73,000 in January 2024. This was following the approval of BTC ETFs (exchange-traded funds) in the US.
Master of Crypto, a veteran trader, highlighted the staggering scale of Pump.fun’s impact. He notes that since April 2024, over 5.1 million tokens have been launched on the platform. This has generated $471 million in revenue.
As traders attempt to profit by chasing the platform’s products, this has created a fragmented market in which no single altcoin can gain traction.
Pump.fun As A Liquidity Blackhole
Pump.fun launched in April 2024, coinciding with the altcoin season, which contravened expected patterns. According to analysts, its meme coin mania progressively dominated speculative interest, causing traditional altcoins to struggle to attract liquidity.
“Pump Fun launched in April 2024 exactly when this Altcoin run deviated from past cycles,” EllioTrades stated.
Pump.fun, which allows users to launch tokens instantly with minimal effort, has surged in popularity. The platform began 2025 with a record $14 million in daily revenue. Nevertheless, critics argue that this success has been a liquidity black hole. Web3 researcher Mercek called the platform an insider-engineered liquidity heist.
“Stealing liquidity from the altcoin market? Pump.fun know how to do it. Meme mania or retail gambling are terms used just to avoid seeing the hard truth…Pump fun was never about decentralization or fun… but an insider-engineered liquidity heist,” the trader explained.
In their opinion, since its inception, Pump.fun has processed over $4.16 billion in transactions. It has also funneled the proceeds into centralized exchanges (CEXs), further draining the altcoin ecosystem.
Counterargument To Shifting Speculative Capital
Not everyone is convinced that Pump.fun is to blame for the sluggish altcoin market. Blockchain researcher Rasrm questioned the narrative. He argues that the market cap of Pump.fun tokens are insufficient to significantly affect broader altcoin liquidity.
“Total pumpfun coin MC is not nearly high enough to have affected this, surely?” he posted.
Others have emphasized that speculative capital does not always stay within the ecosystem. This means that not every winning trade repositions itself on another trade. It could exit the ecosystem entirely.
It appears establishing how much went into the Pump.fun’s ecosystem would be a more accurate metric.
Regardless of the cause for the delayed altcoin season, Pump.fun has fundamentally altered how capital moves in the crypto market. With Solana founders reportedly disliking the platform, according to a recent survey, Pump.fun’s long-term viability remains uncertain.
Meanwhile, Deutscher also associates Pump.fun’s rise to the stringent crypto regulations that have made fair project launches increasingly difficult. The US SEC’s (Securities and Exchange Commission) crackdown on CEXs and token offerings has forced market participants to explore decentralized alternatives.
This regulatory playing field has created an environment where meme tokens and gambling-style speculation thrive, turning crypto into a casino. Some see this as detrimental to the industry’s long-term growth. Meanwhile, others argue it serves as a powerful onboarding tool for new users.
Disclaimer
In adherence to the Trust Project guidelines, BeInCrypto is committed to unbiased, transparent reporting. This news article aims to provide accurate, timely information. However, readers are advised to verify facts independently and consult with a professional before making any decisions based on this content. Please note that our Terms and Conditions, Privacy Policy, and Disclaimers have been updated.

Ethereum Price Path to Recovery Blocked by Key Barriers

Shiba Inu Whales Move 15 Trillion SHIB Amid Market Crash, Are They Preparing For A Surge?

Dogecoin Price Prediction: ‘Channel Down’ Formation Shows Why A Bounce Above $0.3 Is Expected

SUI Trading Volume Hits $615 Million, Overtakes Avalanche
WazirX Creditors Weigh Restructuring Plan That Could Revive Trading

Did Pump.fun Derail Altcoin Season? Analysts Weigh In

2.52 Million Altcoins Are Ruining Crypto’s Future

Animoca Brands Valuation Tanks 75% In Two Years, Here’s Why

Crypto exchange BingX hacked for $43 million

Are The Big Players Losing Interest?

Hong Kong’s Securities Association Tips Authorities On Crypto Self-Regulation

Coinbase cbBTC Set to go Live on Solana
2.52 Million Altcoins Are Ruining Crypto’s Future
Animoca Brands Valuation Tanks 75% In Two Years, Here’s Why
Crypto exchange BingX hacked for $43 million
Are The Big Players Losing Interest?
Hong Kong’s Securities Association Tips Authorities On Crypto Self-Regulation
Coinbase cbBTC Set to go Live on Solana
-
 Bitcoin20 hours ago
US-China Trade War Rattles Crypto – What’s Next for Bitcoin?
-

 Market19 hours ago
ETHFI, TAO Prices Spike on Roadmap Update
-

 Market18 hours ago
Cryptos Dip Further on China’s Retaliatory Tariffs
-

 Market23 hours ago
Top 3 Smart Wallet Addresses To Monitor This Week
-
 Altcoin23 hours ago
BTC & Altcoins Recover Amid Pause On Trump’s Tariffs
-

 Market22 hours ago
XRP Price Explodes 25%: Will The Recovery Sustain or Fizzle Out?
-

 Market21 hours ago
HBAR Price Primed For Massive Rally, But Open Interest Declines
-

 Market20 hours ago
Cardano (ADA) at a Crossroads: Could Bears Take Control Again?