
Market
HBAR Price Drops 13%, Losing $10B in Market Cap

Hedera (HBAR) price has experienced a sharp decline, dropping more than 13% in the last 24 hours and 19% over the past week. This downturn has pushed HBAR’s market cap down to $9 billion, causing it to lose the crucial $10 billion threshold.
Technical indicators, including a rising ADX and a bearish Ichimoku Cloud setup confirm the increasing strength of the current downtrend. With a recent death cross forming on its EMA lines, HBAR now faces critical support levels. At the same time, any potential recovery would need to reclaim key resistances to reverse the current bearish momentum.
Hedera ADX Indicates the Current Downtrend Is Strong
Hedera Average Directional Index (ADX) is currently at 43.3, a sharp rise from 11.4 just three days ago. This significant increase suggests that the strength of HBAR’s current trend is intensifying.
The ADX indicator measures trend strength without indicating direction, meaning it can apply to both upward and downward trends. Given HBAR’s ongoing downtrend, this surge in ADX reflects growing momentum in the current price movement, reinforcing the prevailing bearish sentiment.
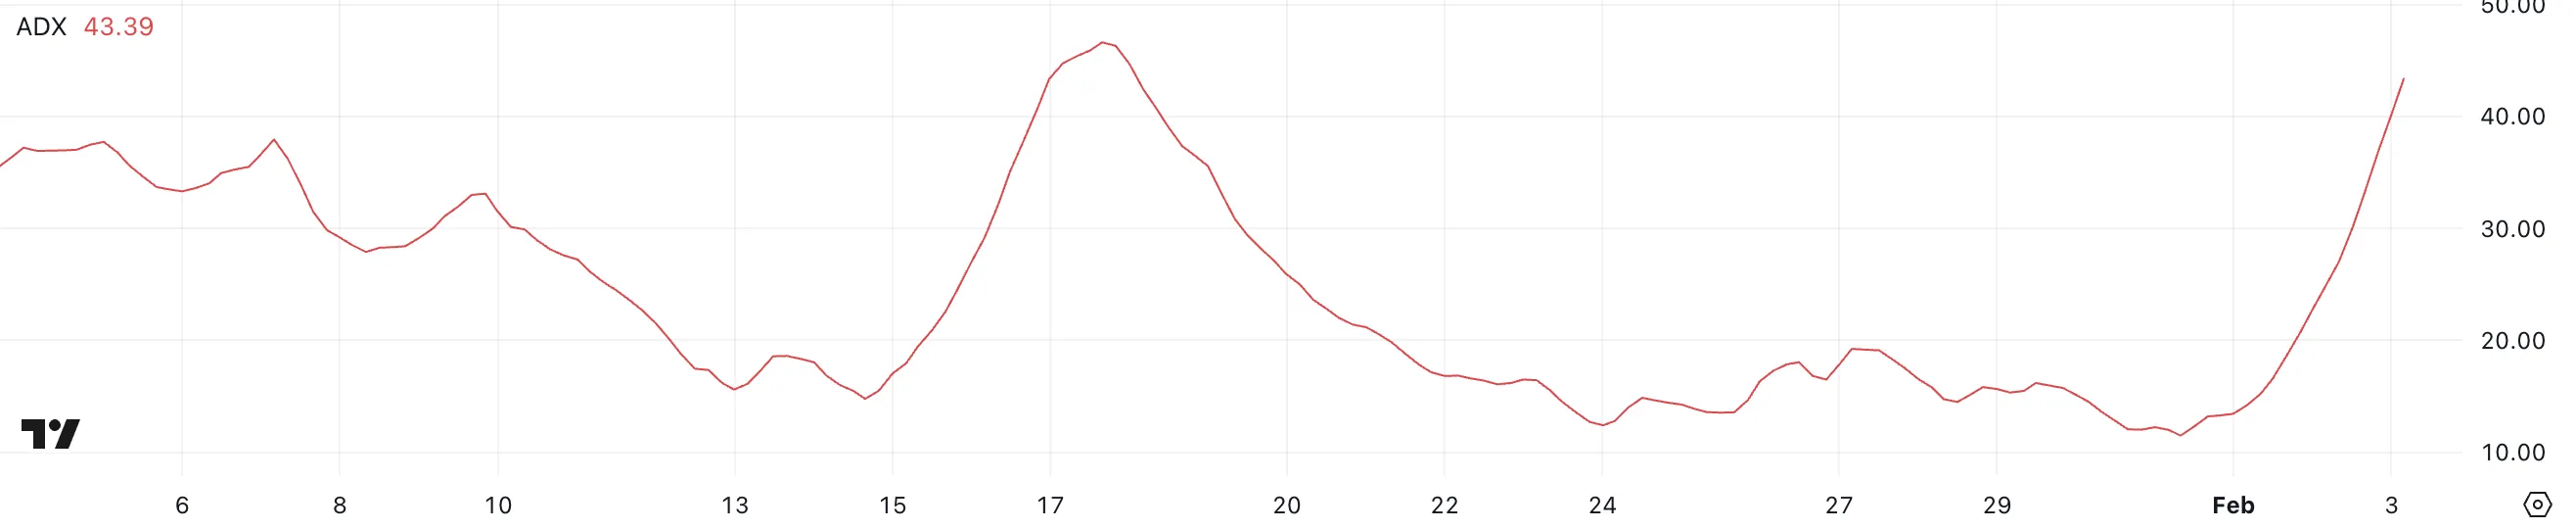
ADX values range from 0 to 100, with readings below 20 indicating a weak or non-existent trend, while values above 25 signal a strengthening trend. When ADX surpasses 40, it suggests a strong trend in place. With HBAR ADX now at 43.3, the downtrend appears to be gaining traction rather than weakening.
This could mean further downside pressure unless a significant shift in buying activity occurs. A high ADX in a downtrend often signals strong bearish momentum, making it difficult for the price to reverse in the short term without a clear change in market structure.
HBAR Ichimoku Cloud Shows a Bearish Setup
The Ichimoku Cloud on the HBAR chart signals a clear bearish trend. The price is currently trading below the cloud, which indicates a downtrend. Additionally, the cloud ahead is red, suggesting that bearish momentum is expected to continue. The Tenkan-sen (blue line) is below the Kijun-sen (red line), reinforcing the short-term bearish structure.
Meanwhile, the Chikou Span (green line) is also below the price action, confirming the overall downward bias. The recent sharp drop and subsequent weak rebound indicate that sellers remain in control.
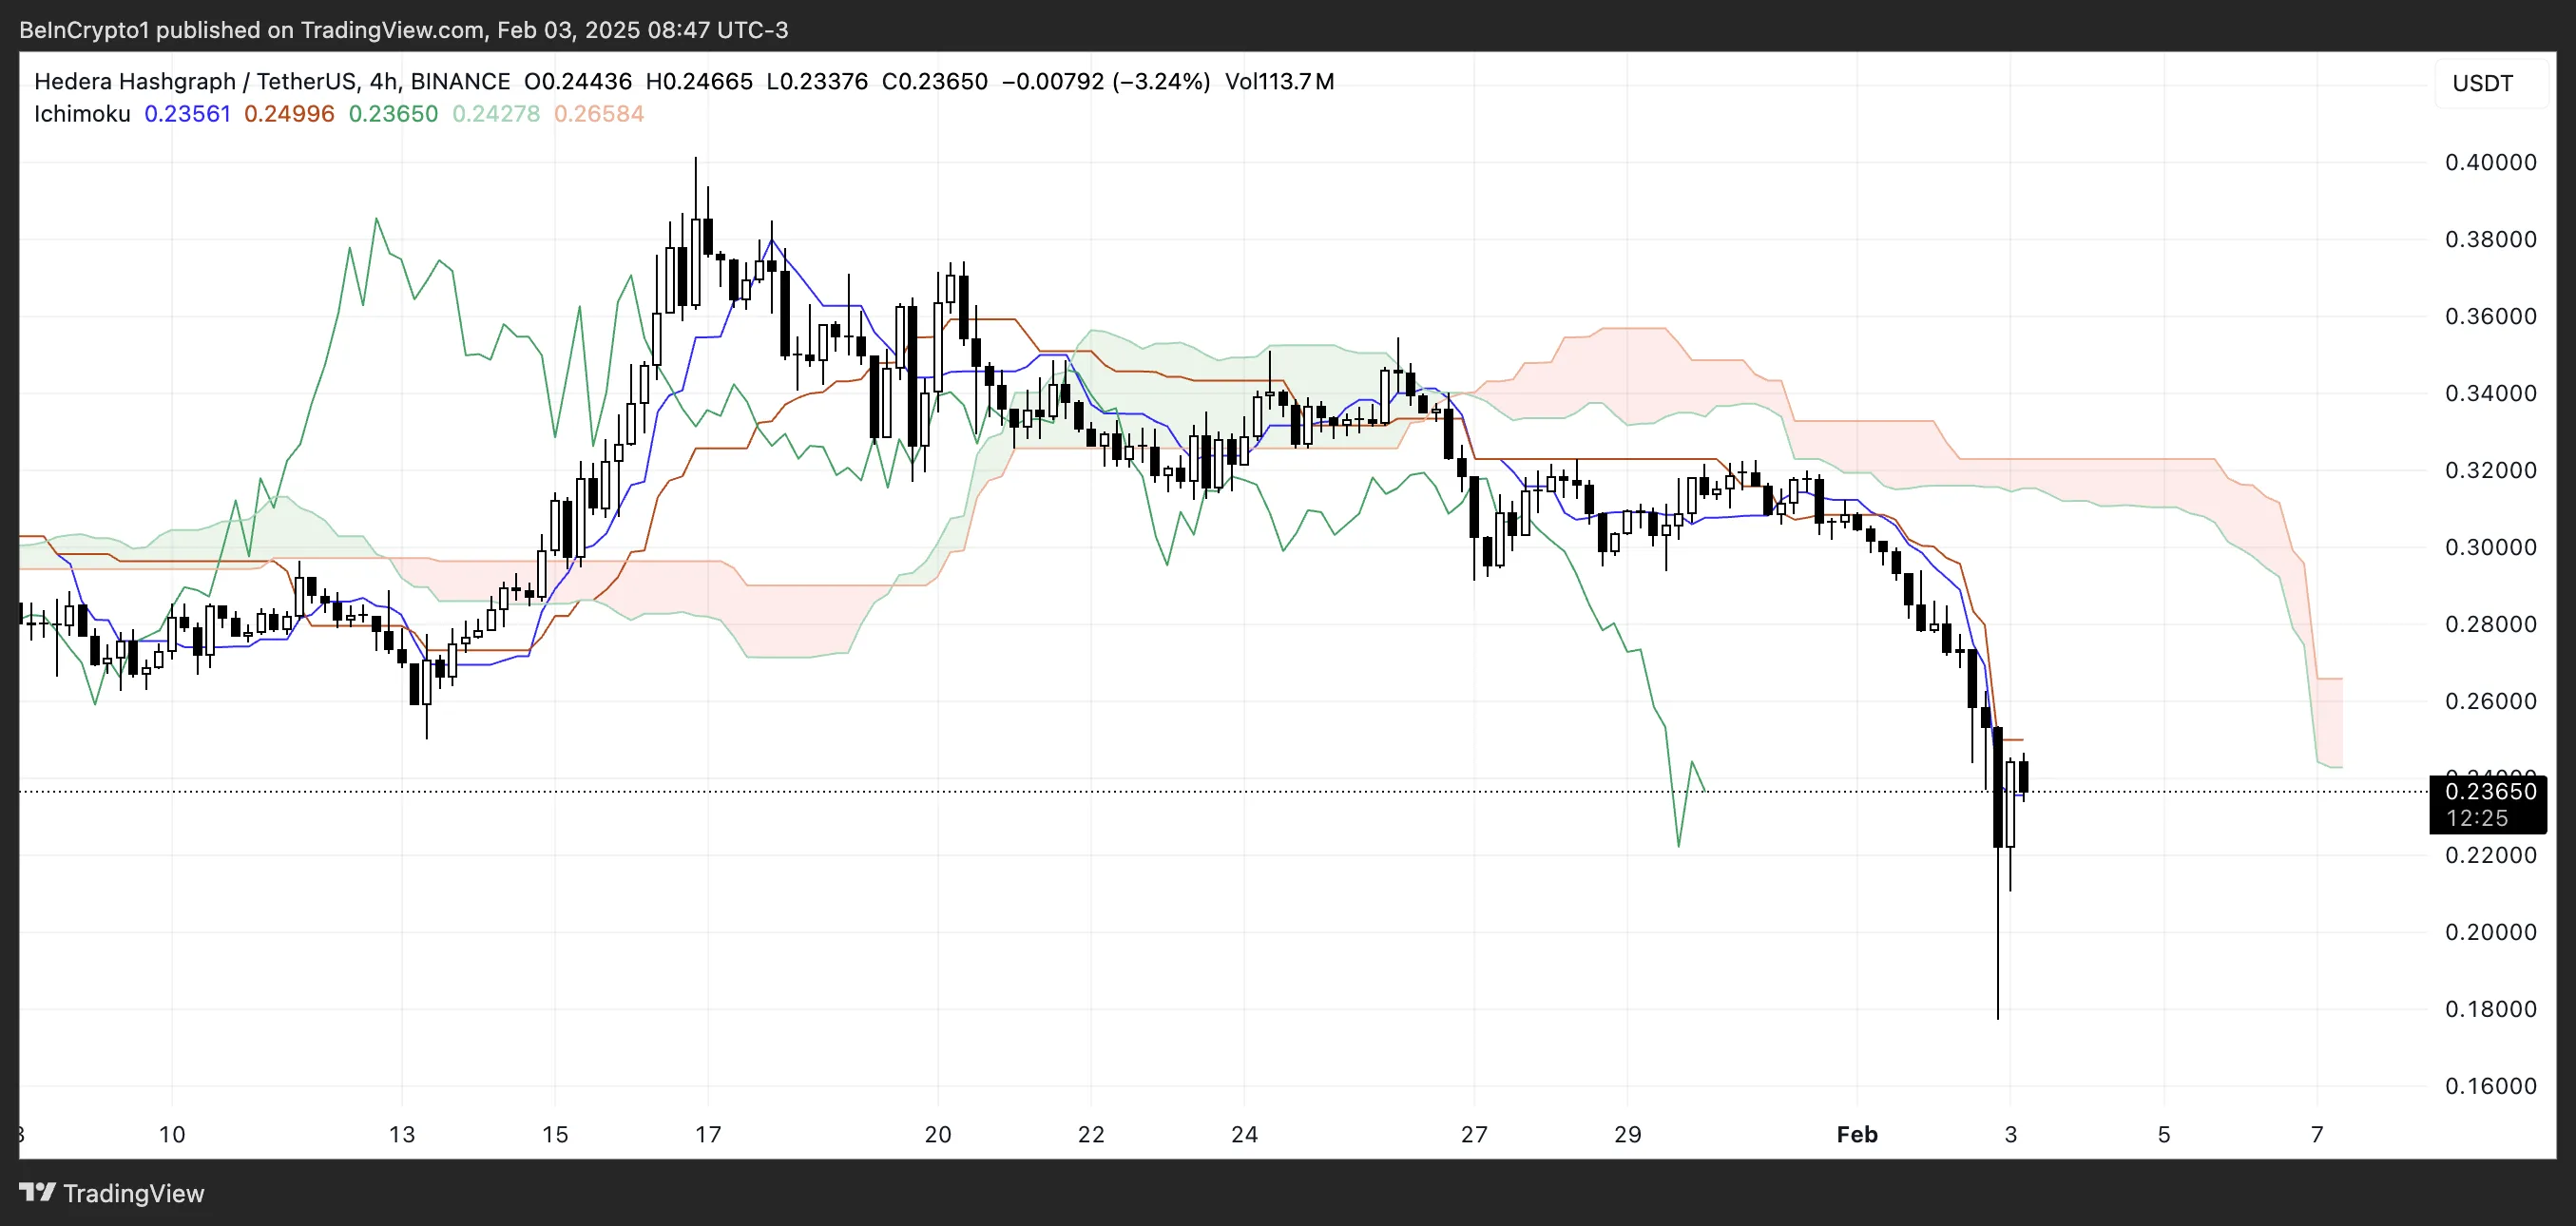
For HBAR price to reverse its bearish trend, it would need to reclaim the cloud and establish support above it. However, with the future cloud projected as bearish and the price failing to show signs of a strong reversal, further downside remains likely.
If selling pressure continues, HBAR may struggle to break above resistance levels near the Kijun-sen. On the other hand, a decisive push above the cloud could shift momentum, but at the moment, the Ichimoku Cloud setup favors continued downside movement.
HBAR Price Prediction: Can Hedera Fall Below $0.1 In February?
HBAR’s recent price action has taken a bearish turn, with its EMA lines forming a death cross in the last two days. This bearish crossover, where the short-term EMAs fall below the long-term EMAs, signals a potential continuation of the downtrend. If selling pressure persists, Hedera price could test its next key support at $0.125, a level that could determine whether further downside is imminent.
A break below this support would open the door for deeper declines, with $0.053 being the next major level of interest. Given the current structure, the bearish momentum remains strong unless a significant shift in trend occurs.
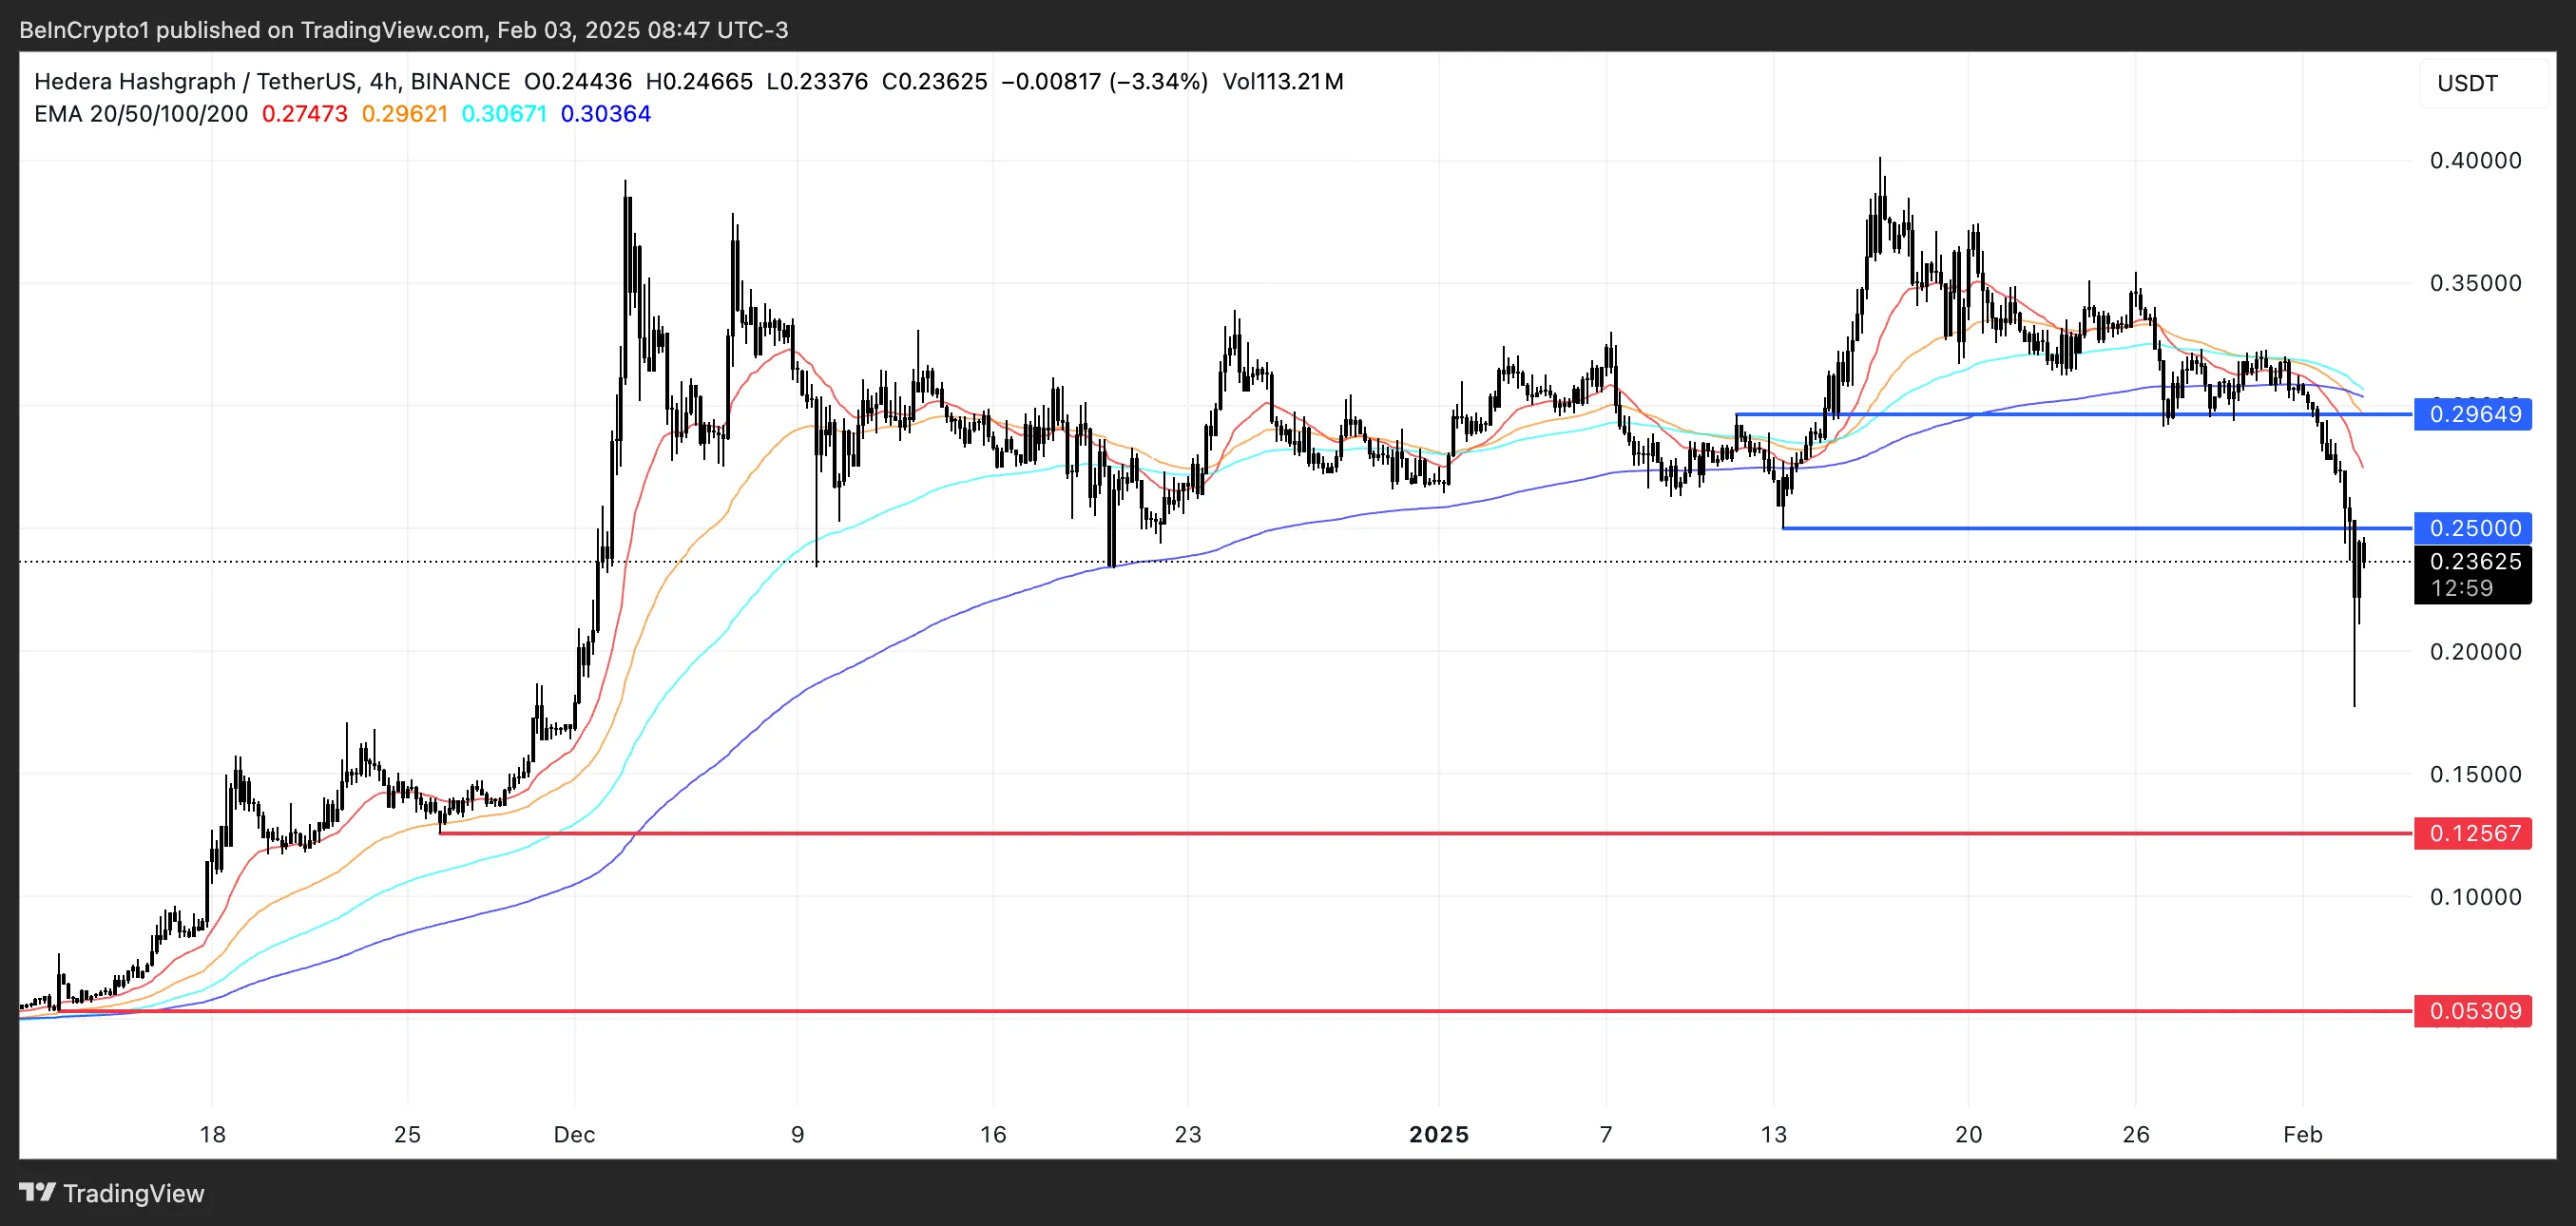
However, if HBAR price manages to regain its bullish momentum from previous months, reclaiming $0.25 as support would be the first sign of strength. A successful breakout above this level could lead to a move toward $0.29, a key resistance that, if breached, would likely fuel further upside.
Beyond that, HBAR could attempt to reclaim levels above $0.30 and even push toward $0.35, where stronger resistance would come into play. For this scenario to unfold, HBAR would need sustained buying pressure and a reversal in trend indicators, as the current setup still favors the downside.
Disclaimer
In line with the Trust Project guidelines, this price analysis article is for informational purposes only and should not be considered financial or investment advice. BeInCrypto is committed to accurate, unbiased reporting, but market conditions are subject to change without notice. Always conduct your own research and consult with a professional before making any financial decisions. Please note that our Terms and Conditions, Privacy Policy, and Disclaimers have been updated.


Smart wallets on Solana are securing massive profits by specializing in specific crypto sectors. One wallet focuses on newly launched tokens, accumulating $3.3 million in realized profit with trades like TRUMP and SOT.
Another dominates gaming tokens, boasting $4.3 million in PnL (Profit and Loss), with massive returns on ZAILGO and BARSIK. Meanwhile, another smart wallet specializes in AI coins, approaching $1 million in realized profits, including a 28,876% gain on CATG and strong holdings in WAIFU.
Solana New Tokens Specialist With More Than $3 Million In Realized Profits
A Solana smart wallet address, 3xqUaVuAWsppb8yaSPJ2hvdvfjteMq2EbdCc3CLguaTE, has accumulated a realized profit of $3.3 million.
Its most profitable trade came from TRUMP, where it turned an initial investment of $749,878 into $1,553,207.
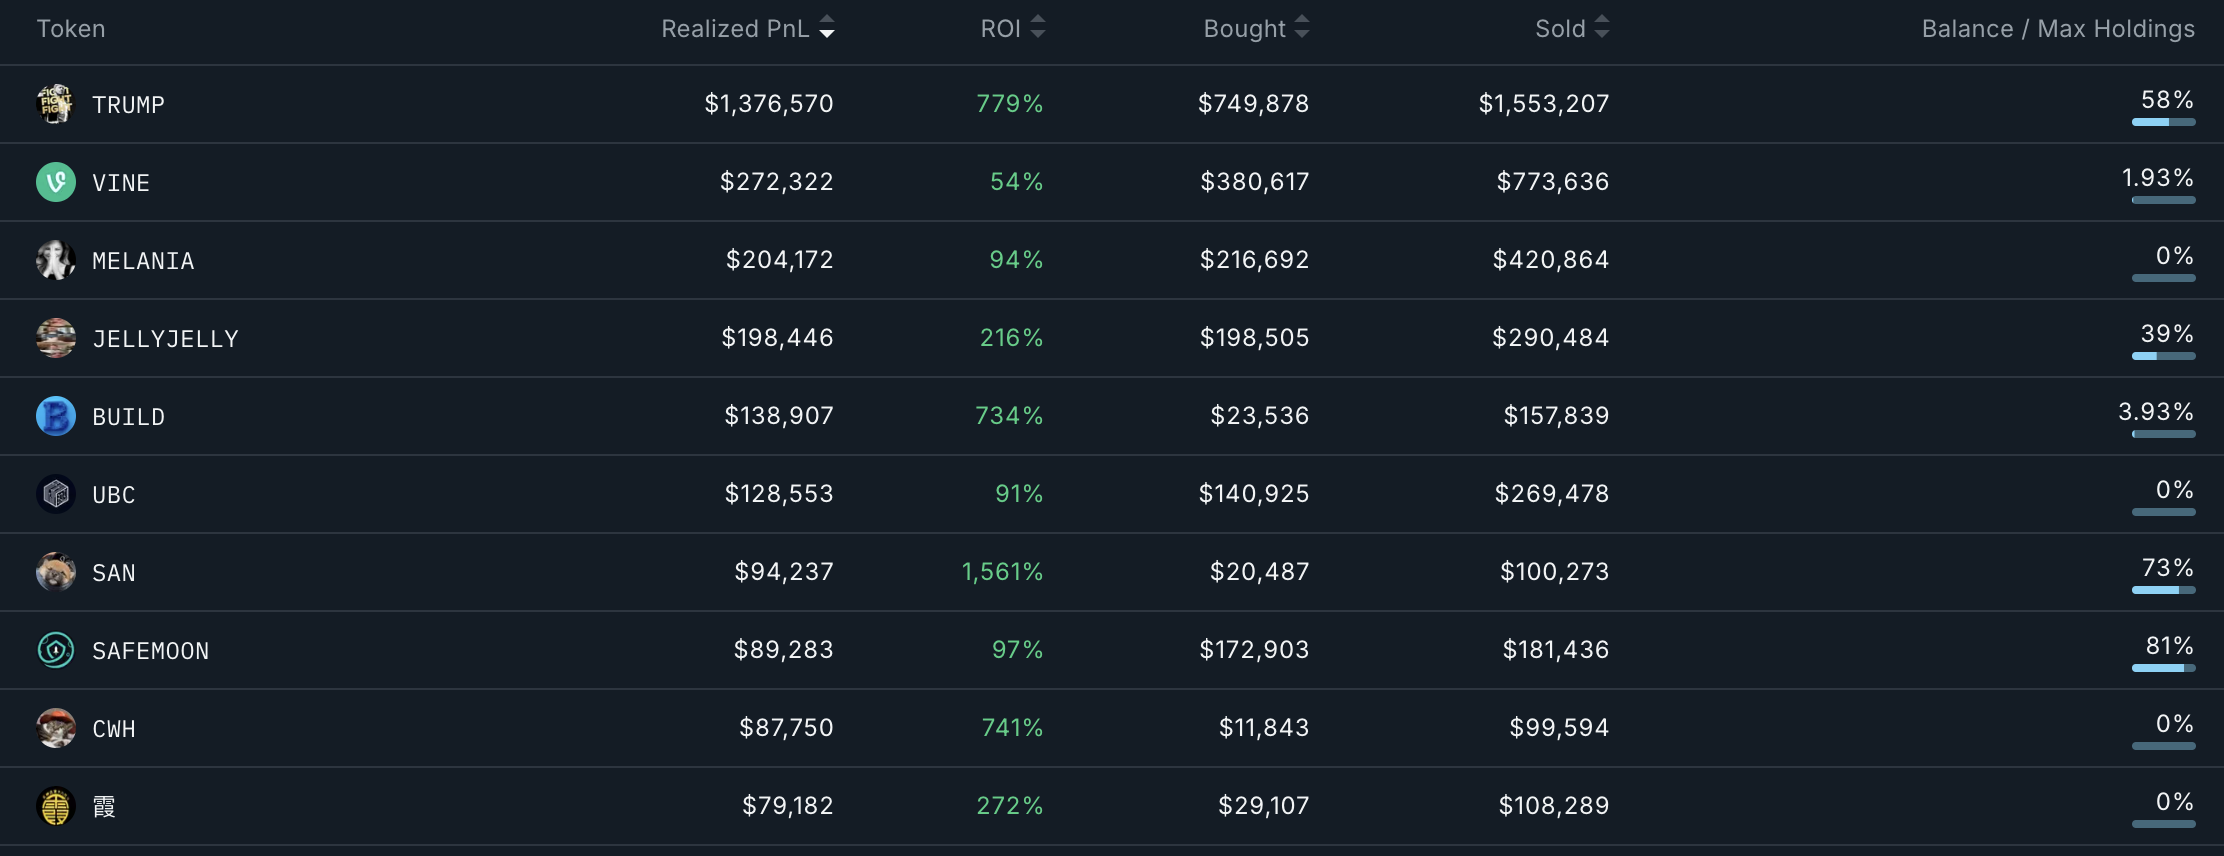
This wallet specializes in newly launched coins, often entering within the first hours after they are launched on launchpads like Pumpfun.
Over the past 90 days, it has executed approximately 4,300 trades, maintaining a win rate of 53% while trading across 510 different tokens.
One of its most remarkable trades was in SOT, where it achieved a staggering 6,732% return, turning just $197 into $5,435. Despite already realizing significant profits, the wallet still holds an unrealized profit of $515,116 in TRUMP, suggesting confidence in a recovery for the meme coin.
Gaming Coins Expert With 5,848% ROI In One Token
The Solana smart wallet 9UWZFoiCHeYRLmzmDJhdMrP7wgrTw7DMSpPiT2eHgJHe has established itself as a specialist in gaming tokens, boasting a realized PnL of $4.3 million.
With a win rate of 52%, it has actively traded 192 different tokens in the past 90 days.
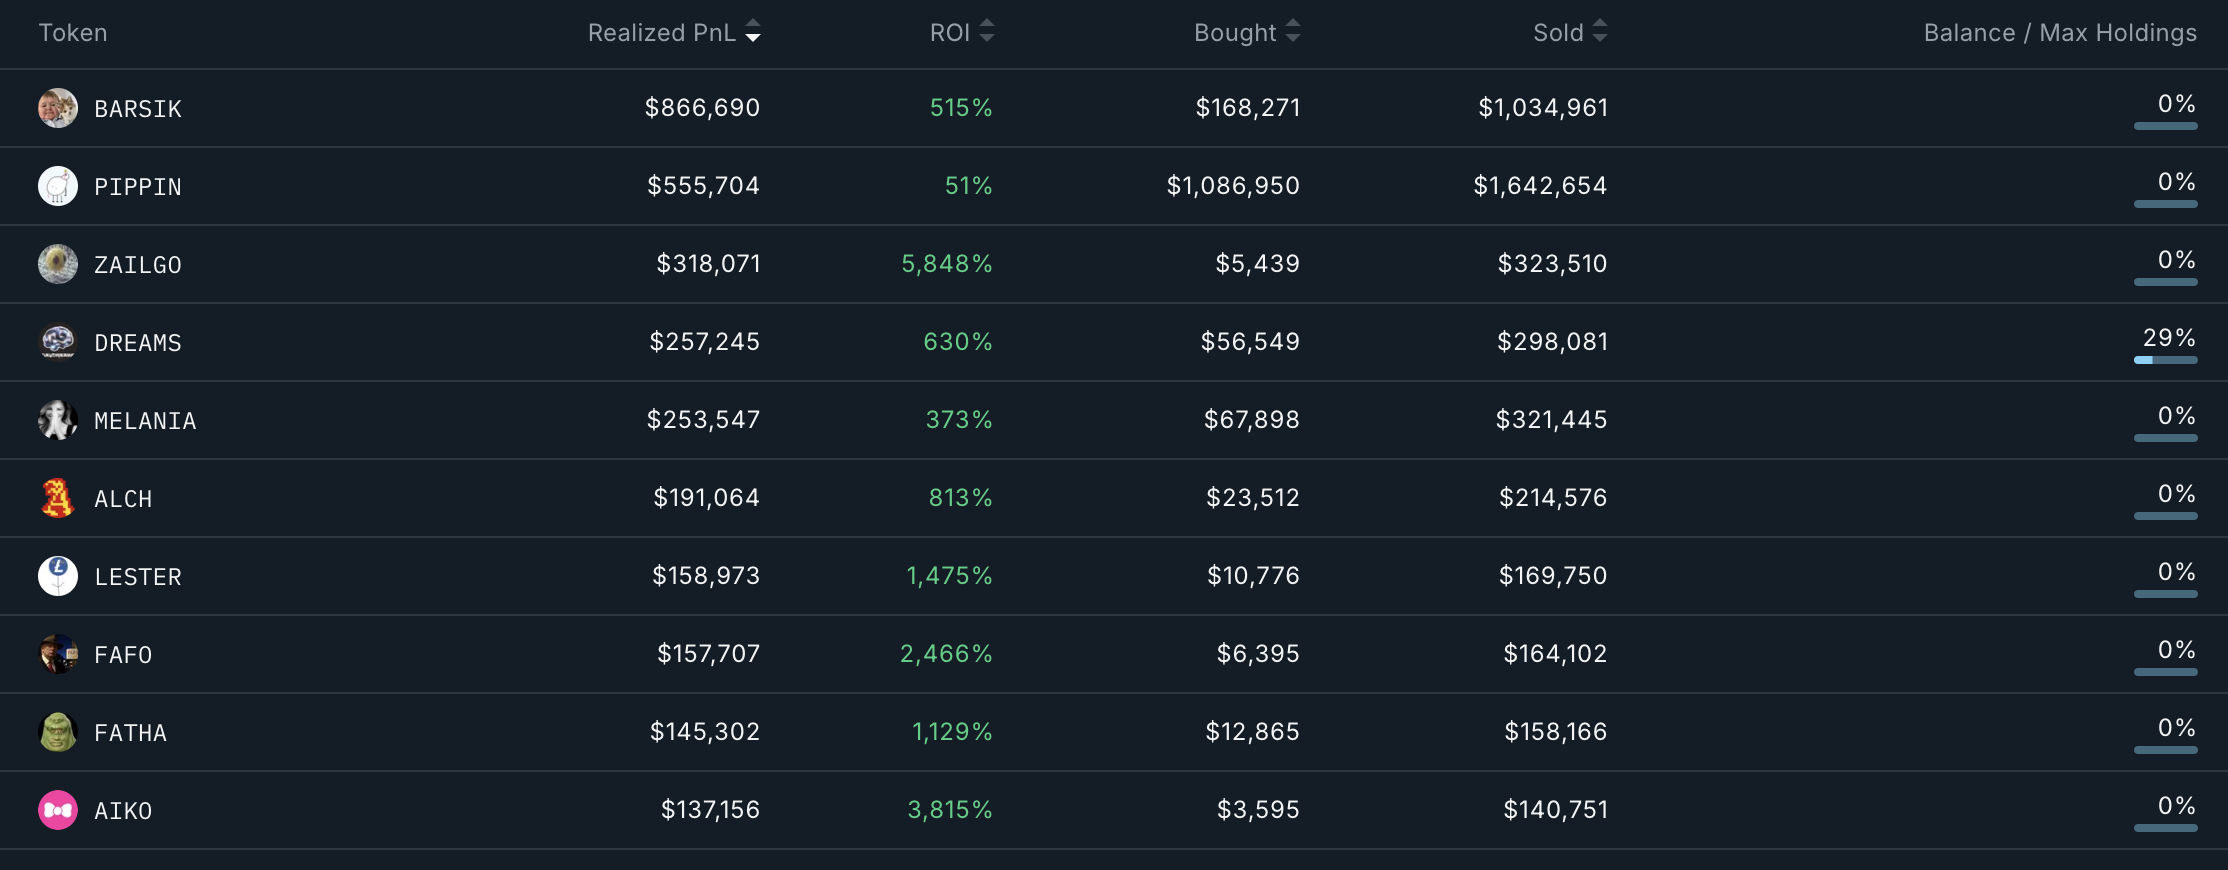
Among its most notable trades, the wallet turned $5,439 into $323,510 on ZAILGO and transformed $168,271 into $1,034,961 on BARSIK.
This wallet has also achieved over $100,000 in realized PnL on 13 different tokens and recorded 11 tokens with returns exceeding 1,000%.
Solana AI Coins Expert Approaching $1 Million In PnL
The Solana smart wallet address BKVaB3eNrGUVRCj3M4LiodKypBTzrpatoo7VBhmdv3eY is a specialist in artificial intelligence cryptos, with a realized profit of $990,000.
Maintaining a win rate of 68%, it has traded 111 different tokens in the last 90 days.
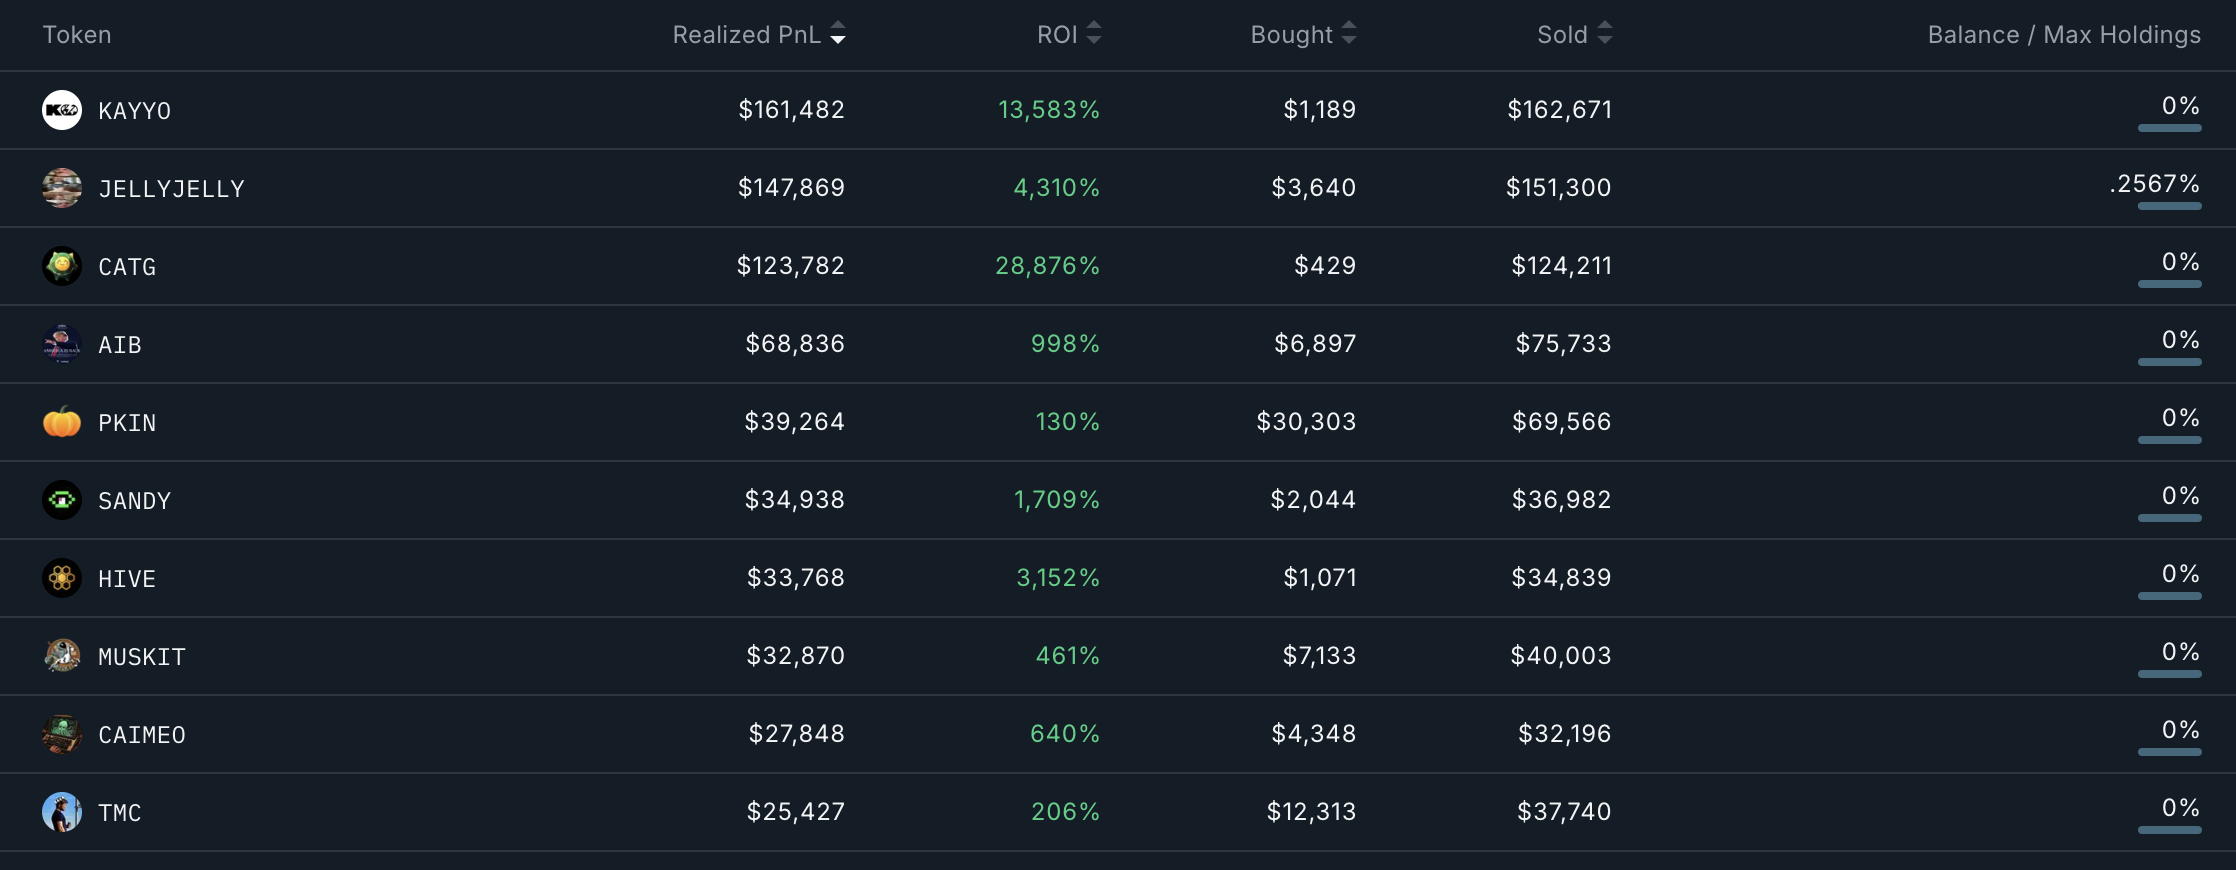
Its returns include some staggering gains, such as 28,876% on CATG, which turned $429 into $124,211, and 13,583% on KAYYO, which turned $1,189 into $162,671.
Beyond its realized profits, the wallet also holds nine tokens with returns exceeding 1,000% and has nearly $40,000 in unrealized profits on WAIFU.
Monitoring these wallets closely can offer key insights, especially for day traders who want to identify possible entry points into lower-cap tokens.
However, it’s important to remain cautious and adopt proactive risk management, as the majority of these assets are driven by speculative trading.
Disclaimer
In line with the Trust Project guidelines, this price analysis article is for informational purposes only and should not be considered financial or investment advice. BeInCrypto is committed to accurate, unbiased reporting, but market conditions are subject to change without notice. Always conduct your own research and consult with a professional before making any financial decisions. Please note that our Terms and Conditions, Privacy Policy, and Disclaimers have been updated.

Ethereum price started a recovery wave above the $2,500 zone. ETH is up nearly 10% and now faces a major resistance near $2,920.
- Ethereum started a decent upward move above the $2,500 support zone.
- The price is trading below $2,900 and the 100-hourly Simple Moving Average.
- There is a key bearish trend line forming with resistance at $2,920 on the hourly chart of ETH/USD (data feed via Kraken).
- The pair could start a fresh decline if it stays below the $2,920 level.
Ethereum Price Attempts Recovery
Ethereum price started a major decline below the $2,800 level, underperforming Bitcoin. ETH declined below the $2,650 and $2,500 levels to enter a bearish zone.
There was a clear move below the $2,200 level. The price declined over 25% and tested the $2,120 zone. A low was formed at $2,127 and the price recently started a fresh upward move. There was an increase above the $2,500 level.
The price surpassed the 50% Fib retracement level of the downward move from the $3,403 wing high to the $2,127 swing low. However, the bears are now active near the $2,900 zone. There is also a key bearish trend line forming with resistance at $2,920 on the hourly chart of ETH/USD.
Ethereum price is now trading below $2,900 and the 100-hourly Simple Moving Average. On the upside, the price seems to be facing hurdles near the $2,900 level. The first major resistance is near the $2,920 level and the trend line or the 61.8% Fib retracement level of the downward move from the $3,403 wing high to the $2,127 swing low.

The main resistance is now forming near $3,000. A clear move above the $3,000 resistance might send the price toward the $3,120 resistance. An upside break above the $3,120 resistance might call for more gains in the coming sessions. In the stated case, Ether could rise toward the $3,250 resistance zone or even $3,320 in the near term.
Another Drop In ETH?
If Ethereum fails to clear the $2,900 resistance, it could start another decline. Initial support on the downside is near the $2,765 level. The first major support sits near the $2,650.
A clear move below the $2,650 support might push the price toward the $2,500 support. Any more losses might send the price toward the $2,420 support level in the near term. The next key support sits at $2,350.
Technical Indicators
Hourly MACD – The MACD for ETH/USD is gaining momentum in the bullish zone.
Hourly RSI – The RSI for ETH/USD is now above the 50 zone.
Major Support Level – $2,765
Major Resistance Level – $2,920

FET price has been in a steep decline, dropping over 40% in the last 30 days and another 20% in the past week. This sharp correction follows the broader weakness in artificial intelligence tokens, with technical indicators pointing to continued bearish momentum.
While mid-sized whales have been selling, larger holders are accumulating, creating uncertainty about whether a bottom is forming. With a rising ADX confirming strong downside pressure and EMA lines maintaining a bearish structure, FET now faces key support and resistance levels that could determine its next major move.
FET Whales Are Sending Mixed Signals
FET whales have shown mixed signals recently. The number of addresses holding between 100,000 and 1,000,000 FET dropped from 404 to 389, while those holding 1,000,000 to 10,000,000 FET increased from 166 to 180.
This suggests that mid-sized holders are selling while larger FET whales are accumulating, leading to a shift in the market.
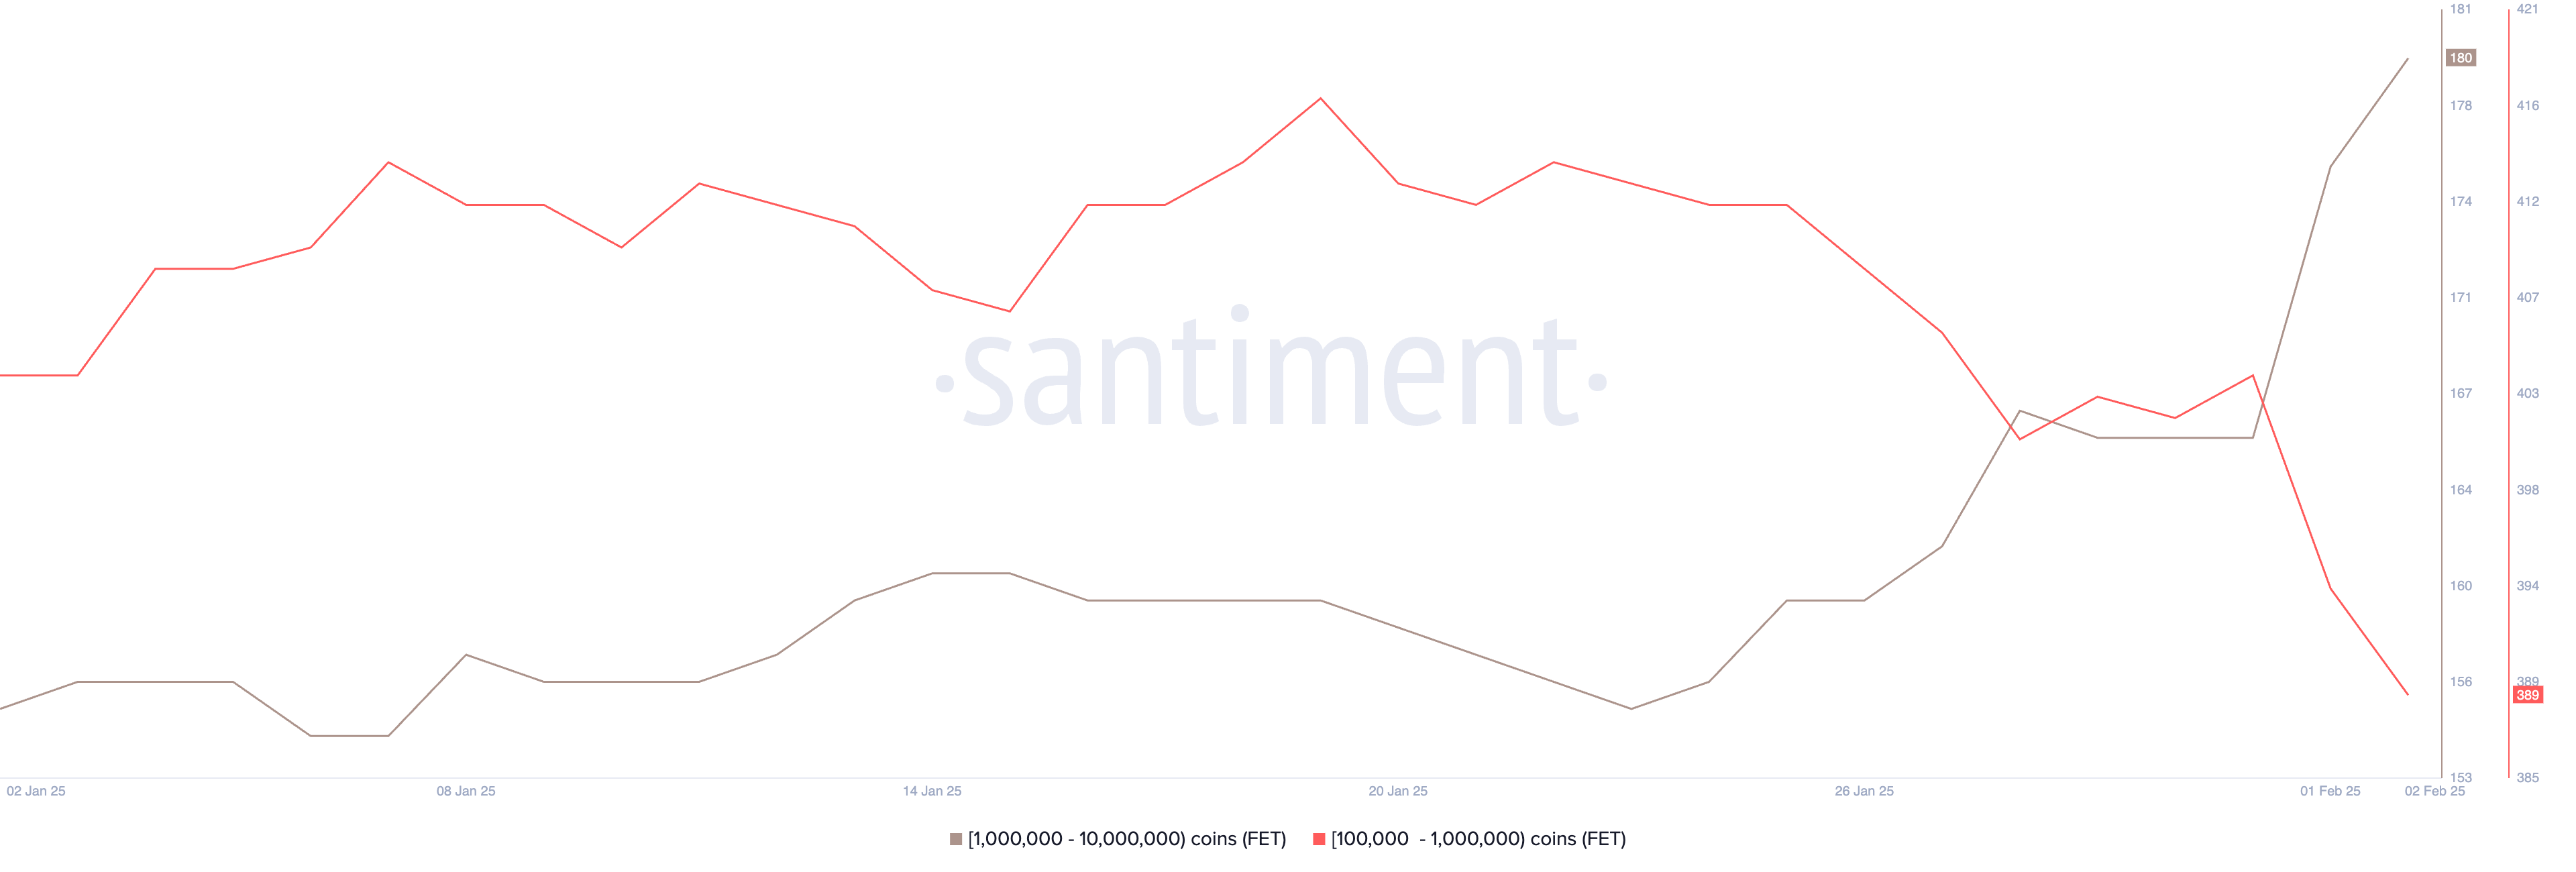
Tracking whale activity is crucial as their movements often impact price trends. With FET down 15% in the last 24 hours and nearly 50% in the past month, this pattern could indicate either a potential bottom or continued volatility.
If large whales keep buying, confidence in recovery may grow but sustained selling pressure could push prices lower.
FET DMI Shows the Downtrend Is Very Strong
FET’s ADX is currently at 49.4, nearly doubling from 24.8 in just two days. This sharp increase signals that the strength of the current trend is intensifying, reinforcing the ongoing market direction.
Given that FET is in a downtrend, the rising ADX suggests bearish momentum is getting stronger.
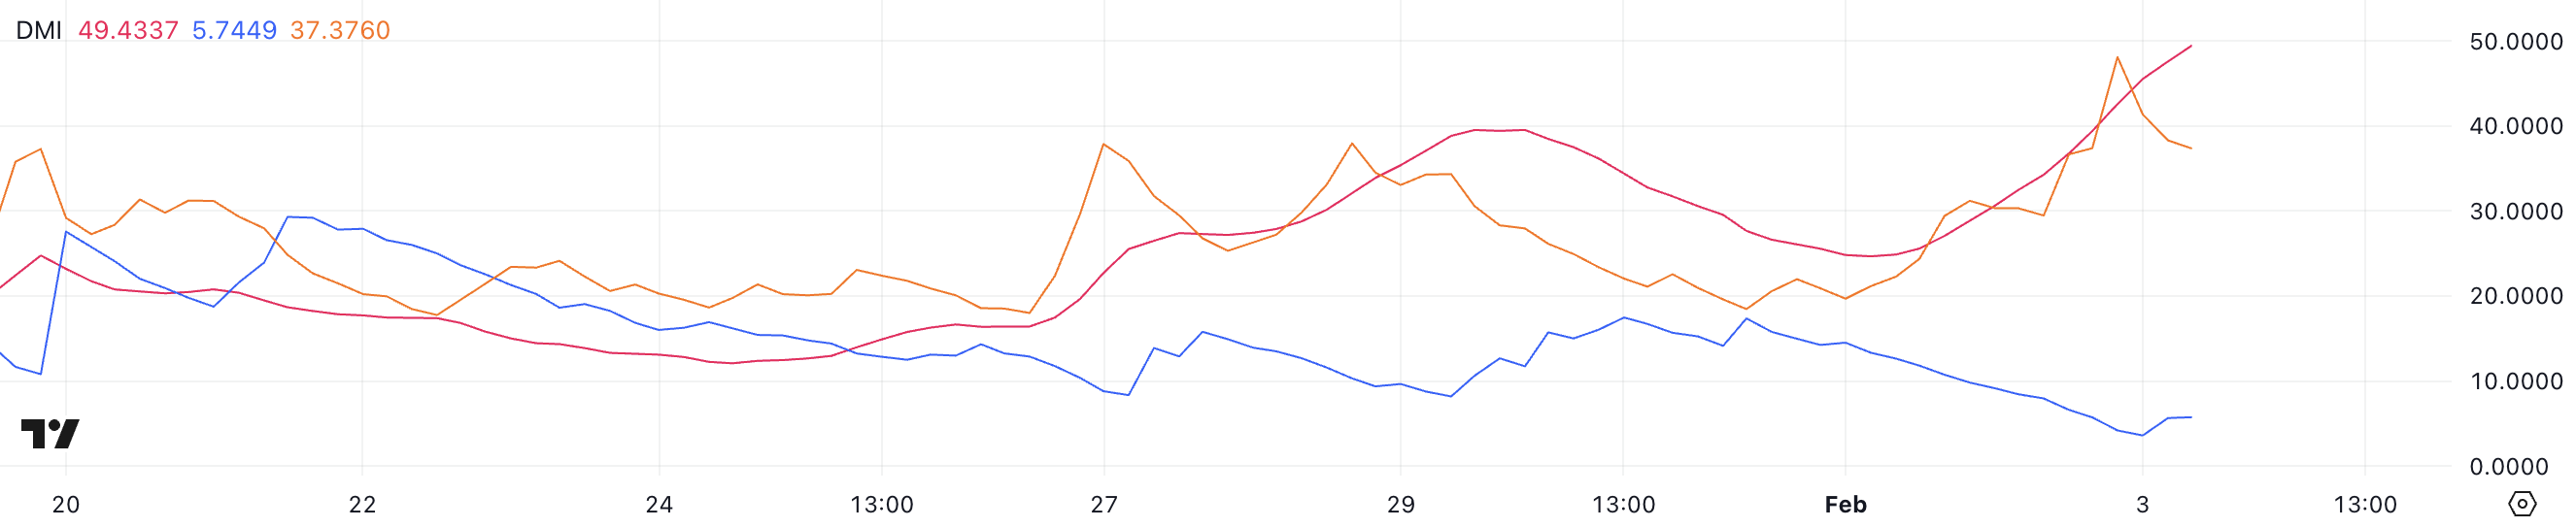
ADX measures trend strength, with values above 25 indicating a strong trend and those above 40 signaling an even more powerful move.
Meanwhile, +DI has dropped from 14.5 to 5.7, while -DI has surged from 19.6 to 37.3, peaking at 48.1 earlier. This confirms that sellers are firmly in control, and unless +DI starts rising, FET price could face further downside pressure.
FET Price Prediction: Will FET Reach Its Lowest Levels Since December 2023?
FET’s EMA lines are in a bearish formation, with all short-term lines below the long-term ones. If the current downtrend remains strong, FET could test support at $0.69, and a breakdown below that could lead to $0.59.
If selling pressure persists, the price could drop below $0.50 for the first time since December 2023, threatening its position as one of the most relevant artificial intelligence cryptos in the market.
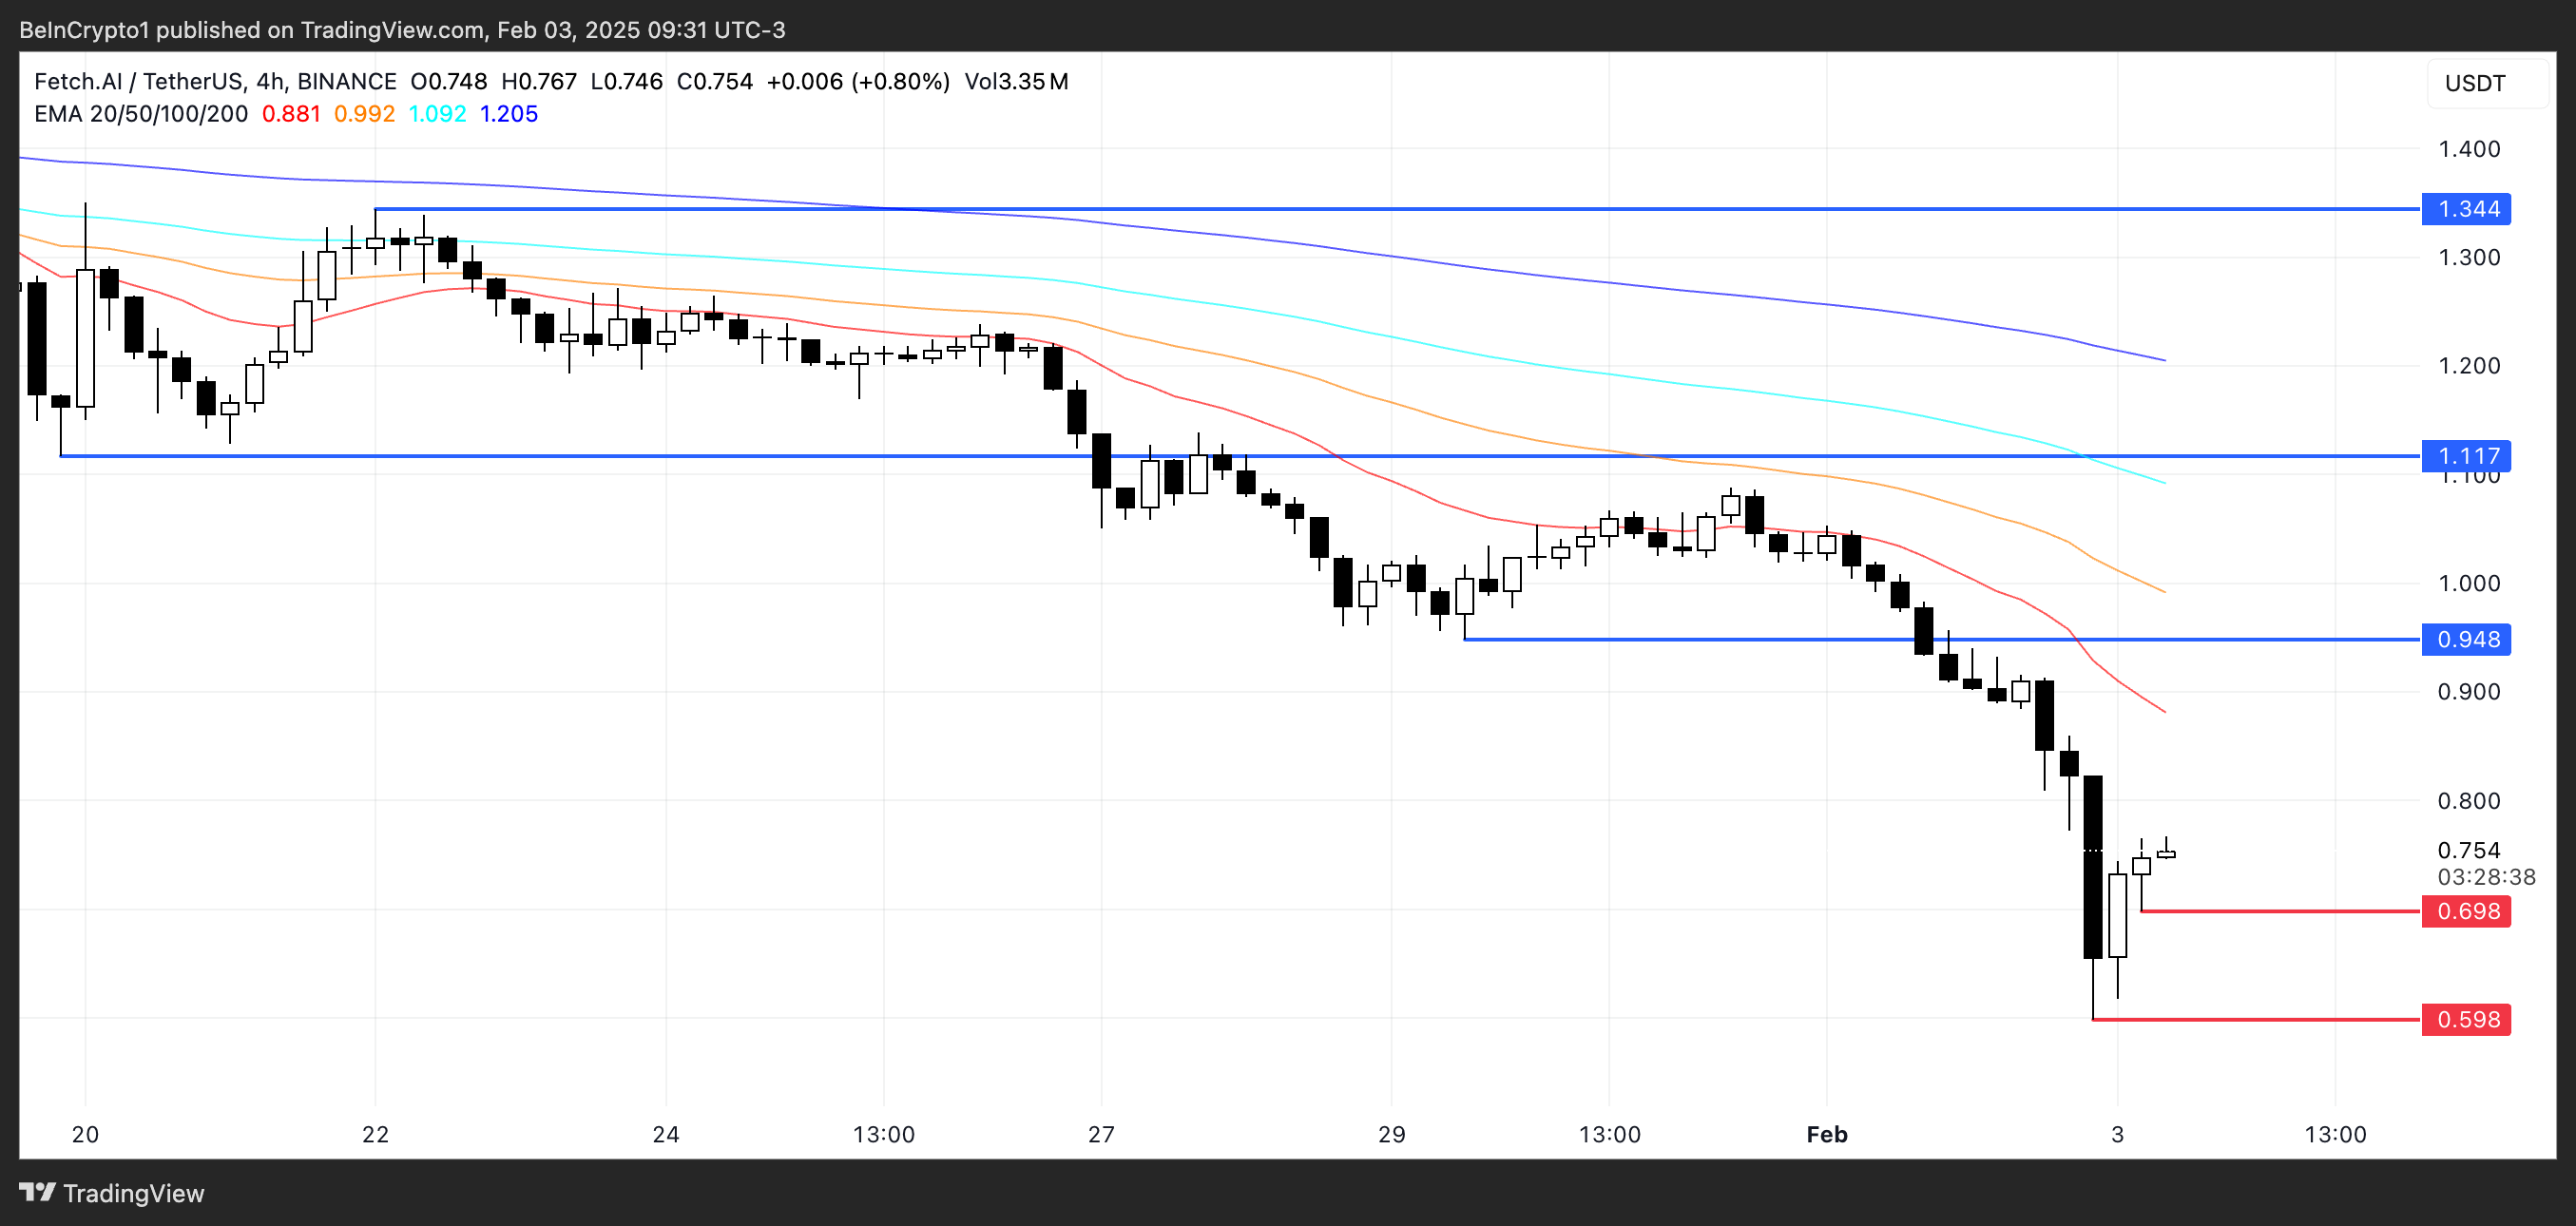
However, a shift in momentum could push FET price toward resistance at $0.94.
A breakout above this level could see it test $1.11, with further upside potentially bringing it back to $1.34.
Disclaimer
In line with the Trust Project guidelines, this price analysis article is for informational purposes only and should not be considered financial or investment advice. BeInCrypto is committed to accurate, unbiased reporting, but market conditions are subject to change without notice. Always conduct your own research and consult with a professional before making any financial decisions. Please note that our Terms and Conditions, Privacy Policy, and Disclaimers have been updated.

BTC & Altcoins Recover Amid Pause On Trump’s Tariffs

Top 3 Smart Wallet Addresses To Monitor This Week

Ethereum Price Recovery Stalls at Resistance: Can Bulls Break Through?

FET Price Falls 20% in a Week as AI Crypto Sell-Off Intensifies

ADA Price Drops 18% as Bearish Pressure Dominates

Bitcoin Rebounds to $100,000 as US-Canada Postpones Tariffs

2.52 Million Altcoins Are Ruining Crypto’s Future

Animoca Brands Valuation Tanks 75% In Two Years, Here’s Why

Crypto exchange BingX hacked for $43 million

Are The Big Players Losing Interest?

Hong Kong’s Securities Association Tips Authorities On Crypto Self-Regulation

Coinbase cbBTC Set to go Live on Solana
2.52 Million Altcoins Are Ruining Crypto’s Future
Animoca Brands Valuation Tanks 75% In Two Years, Here’s Why
Crypto exchange BingX hacked for $43 million
Are The Big Players Losing Interest?
Hong Kong’s Securities Association Tips Authorities On Crypto Self-Regulation
Coinbase cbBTC Set to go Live on Solana
-

 Altcoin24 hours ago
Dogecoin Price Bullish Ahead Of Important Date, Why Is February 4th So Important?
-

 Bitcoin23 hours ago
Bitcoin Crashes To $93K In Market Shake-Up
-
 Market23 hours ago
Cutting US Debt? Senator Lummis Bets on Bitcoin Reserve
-
 Altcoin23 hours ago
Why Are Dogecoin and Shiba Inu Price Crashing Over 25% Today?
-

 Market22 hours ago
Dogecoin (DOGE) Plunges to $0.20: Is This the Bottom or More Pain Ahead?
-

 Market24 hours ago
XRP Price Crashes Hard: Is There a Recovery in Sight?
-

 Ethereum17 hours ago
Ethereum Uptrend Weakens: ETH Faces Pullback Risks As Selling Pressure Intensifies
-

 Market10 hours ago
Dogizen readies for open market as crypto majors rebound