
Bitcoin
MicroStrategy Buys No Bitcoin, Breaking 12-Week Streak

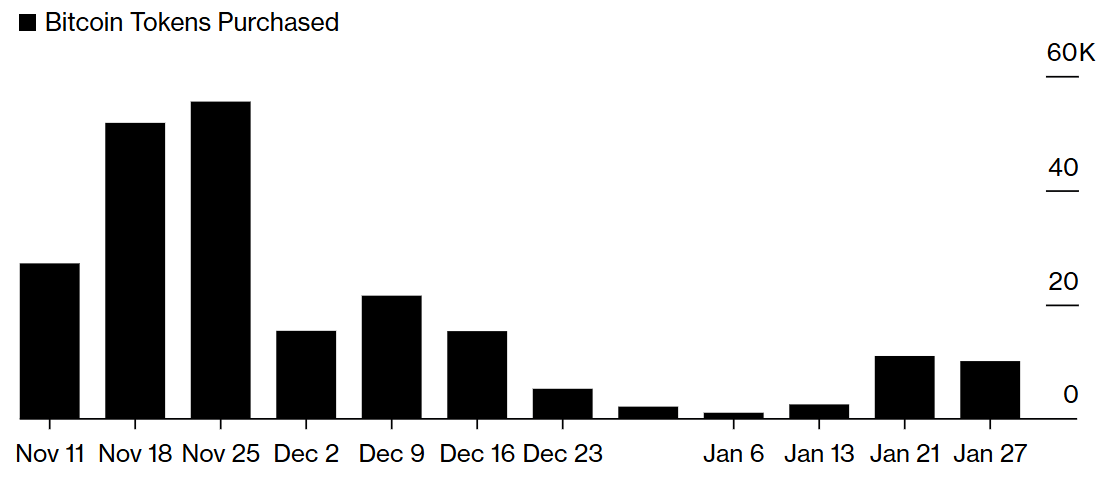
According to Michael Saylor, MicroStrategy finally broke its 12-week streak of consecutive weekly Bitcoin purchases. The firm did not sell any shares of Class A common stock this week, nor did it use proceeds to buy BTC.
The firm may owe billions of taxes on its unrealized gains, and Bitcoin’s price is proving extremely volatile due to US tariffs and political instability. However, Saylor gave very little indication of MicroStrategy’s next move.
MicroStrategy Stops Buying Bitcoin
Since Michael Saylor began directing MicroStrategy to acquire Bitcoin, the firm has become one of the world’s largest BTC holders.
Since late October, the firm has made at least one purchase every week, going from huge buys to slowly diminishing acquisition sizes. MicroStrategy began issuing more shares to ramp up the acquisitions, but Saylor just announced a general pause:
“Last week, MicroStrategy did not sell any shares of Class A common stock under its at-the-market equity offering program, and did not purchase any Bitcoin. As of February 2, 2025, we hold 471,107 BTC acquired for ~$30.4 billion at ~$64,511 per Bitcoin,” Saylor claimed.
This announcement has left the community somewhat confused. In December, there were credible rumors that MicroStrategy may pause its Bitcoin purchases in January.
However, this pause did not happen, and the company’s acquisitions actually increased towards the end of the month. So, it’s surprising that the firm halted its purchases, seemingly when the BTC price presented notable buying opportunities last week.
A few factors may have contributed to this switch in tactics. For one thing, Bitcoin’s value is in a tough spot. Since the threat of US tariffs against Mexico, Canada, and China, it and the broader crypto market took a nosedive.
With further economic chaos looming on the horizon, MicroStrategy may take a conservative approach to Bitcoin investment.
There is also another factor. Although BTC took a dive today, it’s been in a sustained bull market otherwise. MicroStrategy may owe billions in unreleased gains regarding its Bitcoin prices, which would add more complexity to a delicate situation.
For now, it’s difficult to predict where the company will go from here.
One important consideration is the pause on stock sales alongside BTC buys. MicroStrategy has been using these to fund its Bitcoin accumulation, and the firm may stop committing so heavily to the asset.
Michael Saylor did not give any direct indication of whether it will resume these purchases soon. Many factors are in the air right now, but the firm remains committed to its Bitcoin-first strategy.
Disclaimer
In adherence to the Trust Project guidelines, BeInCrypto is committed to unbiased, transparent reporting. This news article aims to provide accurate, timely information. However, readers are advised to verify facts independently and consult with a professional before making any decisions based on this content. Please note that our Terms and Conditions, Privacy Policy, and Disclaimers have been updated.


The Bitcoin (BTC) market is showing an extended sideways movement with no significant price action over the past day. Notably, the premier cryptocurrency has lost all market gains from its sudden 11% price surge from last week returning to previous consolidation levels around $86,000. According to popular crypto analyst Burak Kesmeci, Bitcoin is now set between two important price levels wielding sufficient potential for a substantial price swing.
Bitcoin Faces Make-Or-Break At $84k And $87k Liquidation Zones
Using a liquidation heatmap, Burak Kesmeci has highlighted two critical price levels that could be influential on Bitcoin’s next move. Generally, a liquidation heatmap visually represents the levels where leveraged positions, both long and short, are at risk of liquidation. The presence of dense clusters indicates that much liquidity is concentrated at a price, meaning many stop losses and liquidation orders are stacked there.
Regions with these massive liquidity often attract price movements as market makers and institutional traders tend to target these liquidity pockets to trigger liquidations thereby allowing them to buy at a discount or sell at a premium. According to Burak Kesmeci, the BTC 24-hour liquidation heatmap from CoinGlass suggests the flagship crypto asset is now between $84,849 and $87,043 representing two key price points crucial to its move.

Based on the analysis presented, $87,043 is serving as resistance suggesting that a price break above this level could trigger a short squeeze as short traders are forced to buy back their positions at higher prices contributing to the demand for a price rally. In this bullish case, BTC could rise to around $90,000 but will require strong buying pressure to push to higher price targets at $94,000 and $99,000.
Meanwhile, the $84,849 price region presents a crucial support zone that a price fall below which would cause the liquidation of a significant amount of long positions thus inducing a substantial selling pressure. If this projection occurs, BTC could find immediate support around $84,000 However, a potential dip to lower levels such as $83,000 or $80,000 may be feasible.
Bitcoin Price Overview
At the time of writing, Bitcoin is trading at $86,389 reflecting a minor 0.11% gain in the past day and a 0.76% gain in the last seven days. However, the premier cryptocurrency is down by 10.84% in the last month leaving most new market entrants in a deep loss.
Meanwhile, the BTC market trading market volume has crashed by 72.39% in the past day indicating a fall in market participation. While the liquidation heatmap analysis presented by Burak Kesmeci shows two likely pathways, investors should also note Bitcoin could remain range-bound between both liquidation zones barring the introduction of a significant market catalyst.
Featured image from Investopedia, chart from Tradingview
Editorial Process for bitcoinist is centered on delivering thoroughly researched, accurate, and unbiased content. We uphold strict sourcing standards, and each page undergoes diligent review by our team of top technology experts and seasoned editors. This process ensures the integrity, relevance, and value of our content for our readers.

The Bitcoin price started the week on a strong footing, jumping back above $90,000 following the announcement of a strategic crypto reserve by US President Donald Trump. However, the flagship cryptocurrency barely sustained this momentum, dropping back beneath the $90,000 level before midweek.
The recent market uncertainty is mirrored in the Bitcoin action, as the price has moved mostly sideways (after the initial pump) within the $82,000 – $92,000 range. The question now is — who is behind the constant price retracement and consolidation?
Short-Term Sell-Offs Meet Long-Term Confidence: Analyst
In a Quicktake post on the CryptoQuant platform, an analyst with the pseudonym ShayanBTC discussed the divergence in investor behavior while using on-chain data to evaluate current market sentiment. The relevant on-chain indicator here is the Spent Output Age Bands (SOAB) metric, which sorts spent coins into categories depending on their age and as a proportion of total coins moved.
ShayanBTC specifically analyzed the bags of investors between the 1-week and 6-month cohorts (short-term holders) using the Spent Output Age Bands. Data from CryptoQuant shows that the selling activity of short-term investors drove the recent Bitcoin downturn.
These investors, known for their rapid reactions to market fluctuations, have been actively depositing BTC onto exchanges — which can be associated with selling pressure. Considering the sensitive nature of short-term holders to market sentiment and technical resistance levels, their selling behavior aligns with Bitcoin’s recent struggle to sustain any bullish momentum.

Source: CryptoQuant
On the other hand, long-term investors (those holding BTC for more than 6 months) have shown no signs of capitulation. While some level of profit-taking can be seen among this group of Bitcoin holders, it seems to be rather gradual and consistent with the behavior seen in healthy bull markets rather than mass liquidations.
The activity of long-term Bitcoin investors suggests that they anticipate future price appreciation before offloading larger portions of their holdings, thereby reducing the BTC supply in the open market. ShayanBTC added that “if sufficient demand enters the market, this supply shrinkage could fuel further price appreciation.”
Interestingly, the latest on-chain data shows that Bitcoin’s long-term investors are not the only market participants refraining from offloading their assets. Crypto pundit Ali Martinez revealed in a post on X that the BTC miners have recorded zero selling activity since February 28.
Bitcoin Price At A Glance
As of this writing, the premier cryptocurrency is valued at around $86,200, reflecting a mere 0.5% price decline in the past 24 hours.
The price of BTC on the daily timeframe | Source: BTCUSDT chart on TradingView
Featured image from iStock, chart from TradingView
Editorial Process for bitcoinist is centered on delivering thoroughly researched, accurate, and unbiased content. We uphold strict sourcing standards, and each page undergoes diligent review by our team of top technology experts and seasoned editors. This process ensures the integrity, relevance, and value of our content for our readers.

The US-based Bitcoin ETFs (exchange-traded funds) have continued to struggle in terms of investor participation and interest over the last few weeks. In the last week of February, the crypto-based financial products witnessed a record-breaking $1.14 billion single-day withdrawal.
The story wasn’t any much different for the Bitcoin ETFs to start the month of March, registering a net outflow of nearly $800 million in the past week. This growing trend reflects the shift in the appetite and sentiment of institutional investors, especially in the United States.
Bitcoin ETFs Post $409 Million Daily Net Outflow
According to the latest market data, the United States Bitcoin ETF market posted a daily net outflow of roughly $409 million on Friday, March 7. This marked the fifth consecutive day of withdrawals for the Bitcoin exchange-traded funds.
Ark & 21 Shares Bitcoin ETF (with the ticker ARKB) saw the largest volume of withdrawals (over $160 million) on Friday. This was followed closely by Fidelity Wise Origin Bitcoin Fund (FBTC), which posted net outflows of approximately $155 million to close the week.
BlackRock’s Bitcoin Trust (IBIT), the largest Bitcoin exchange-traded fund by net assets, declined in net value by $39.85 million on Friday. Meanwhile, Grayscale’s Bitcoin Trust (GBTC) and Bitwise’s BTC fund (BITB) followed with total outflows of roughly $36.5 million and $18.6 million, respectively, on the day.
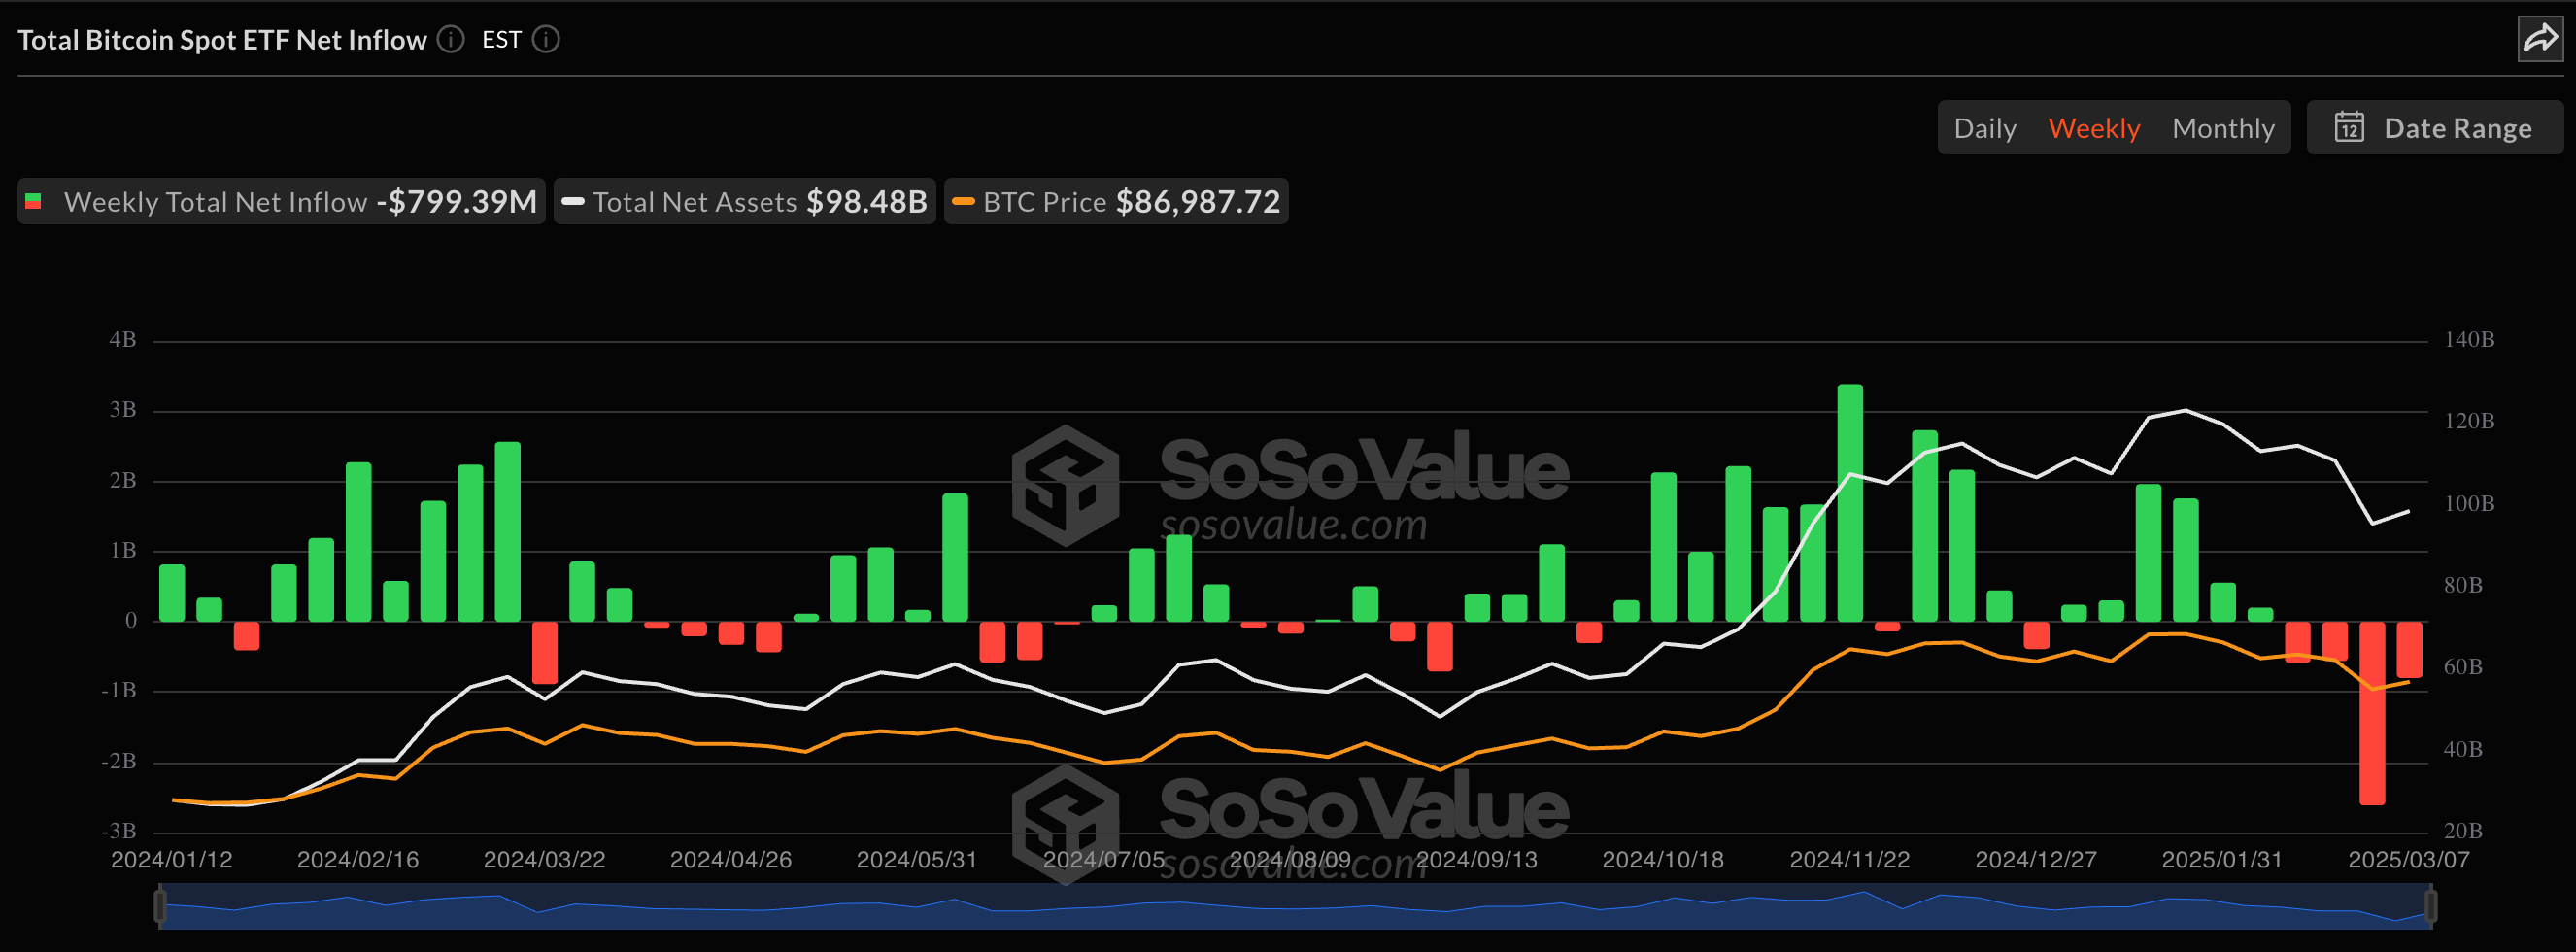
Source: SoSoValue
Interestingly, VanEck’s Bitcoin fund (with the ticker HODL) was the only one of the US-based Bitcoin ETFs that recorded a net inflow on Friday. The exchange-traded fund added about $617,500 in value to close the week.
As already mentioned, this single-day performance marked the fifth straight day of net outflows for the Bitcoin ETFs. The crypto-based products are yet to record an inflow day in March, as they last posted a net daily inflow on Friday, February 28.
This $409 million single-day withdrawal put the Bitcoin ETFs’ weekly performance at a net outflow of $799.9 million in the past week. Interestingly, this represents the fourth consecutive week (and the second-highest ever) of net outflows for the crypto exchange-traded funds.
Bitcoin Price At A Glance
The performance of the BTC exchange-traded funds in recent weeks somewhat mirrors the sluggish Bitcoin price action within this same period. The price of Bitcoin has been unable to sustain any positive momentum from the somewhat improving crypto climate in the United States.
As of this writing, the premier cryptocurrency is valued at around $86,100, reflecting an over 1% price decline in the past 24 hours. On the weekly timeframe, though, the Bitcoin price is up by more than 2%, according to data from CoinGecko.
The price of BTC on the daily timeframe | Source: BTCUSDT chart on TradingView
Featured image from iStock, chart from TradingView
Editorial Process for bitcoinist is centered on delivering thoroughly researched, accurate, and unbiased content. We uphold strict sourcing standards, and each page undergoes diligent review by our team of top technology experts and seasoned editors. This process ensures the integrity, relevance, and value of our content for our readers.

Pro XRP Lawyer Outlines Reasons To Accumulate Despite Crypto Market Crash

Arkham Can Now Track Crypto Influencer Wallets

Shiba Inu Whales Cut Holdings—Is a Bigger Price Drop Ahead?

SafeMoon (SFM) Selling Pressure Threatens Previous Gains

Bitcoin Liquidation Heatmap Signals Potential Bitcoin Price Swings – What’s Next

Berachain Price Drops 30%—More Losses Ahead?

2.52 Million Altcoins Are Ruining Crypto’s Future

Animoca Brands Valuation Tanks 75% In Two Years, Here’s Why

Crypto exchange BingX hacked for $43 million

Are The Big Players Losing Interest?

Hong Kong’s Securities Association Tips Authorities On Crypto Self-Regulation

Coinbase cbBTC Set to go Live on Solana
2.52 Million Altcoins Are Ruining Crypto’s Future
Animoca Brands Valuation Tanks 75% In Two Years, Here’s Why
Crypto exchange BingX hacked for $43 million
Are The Big Players Losing Interest?
Hong Kong’s Securities Association Tips Authorities On Crypto Self-Regulation
Coinbase cbBTC Set to go Live on Solana
-

 Ethereum21 hours ago
330,000 Ethereum Withdrawn From Exchanges In 72 Hours – Supply Squeeze Incoming?
-

 Market21 hours ago
Bitcoin Pepe maintains its shine as Bitcoin price bleeds further
-
 Altcoin24 hours ago
Tron Founder Justin Sun Asserts TRX Price Will Hit New ATH
-
 Altcoin22 hours ago
Analyst Confirms Dogecoin Price Can Reach $90, Here’s When
-

 Altcoin21 hours ago
Andre Cronje Outlines Reasons For Ethereum’s Underperformance This Cycle
-

 Altcoin18 hours ago
Cardano Price Could Be On Its Way To $2 — Here’s How
-
 Regulation17 hours ago
Gemini Cofounder Reveals How Much David Sacks Will Lose In Crypto Gains In Four Years
-

 Ethereum14 hours ago
Ethereum Breaks Out Of Descending Triangle Pattern – Fakeout Or Recovery Rally?