
Market
Dogizen readies for open market as crypto majors rebound


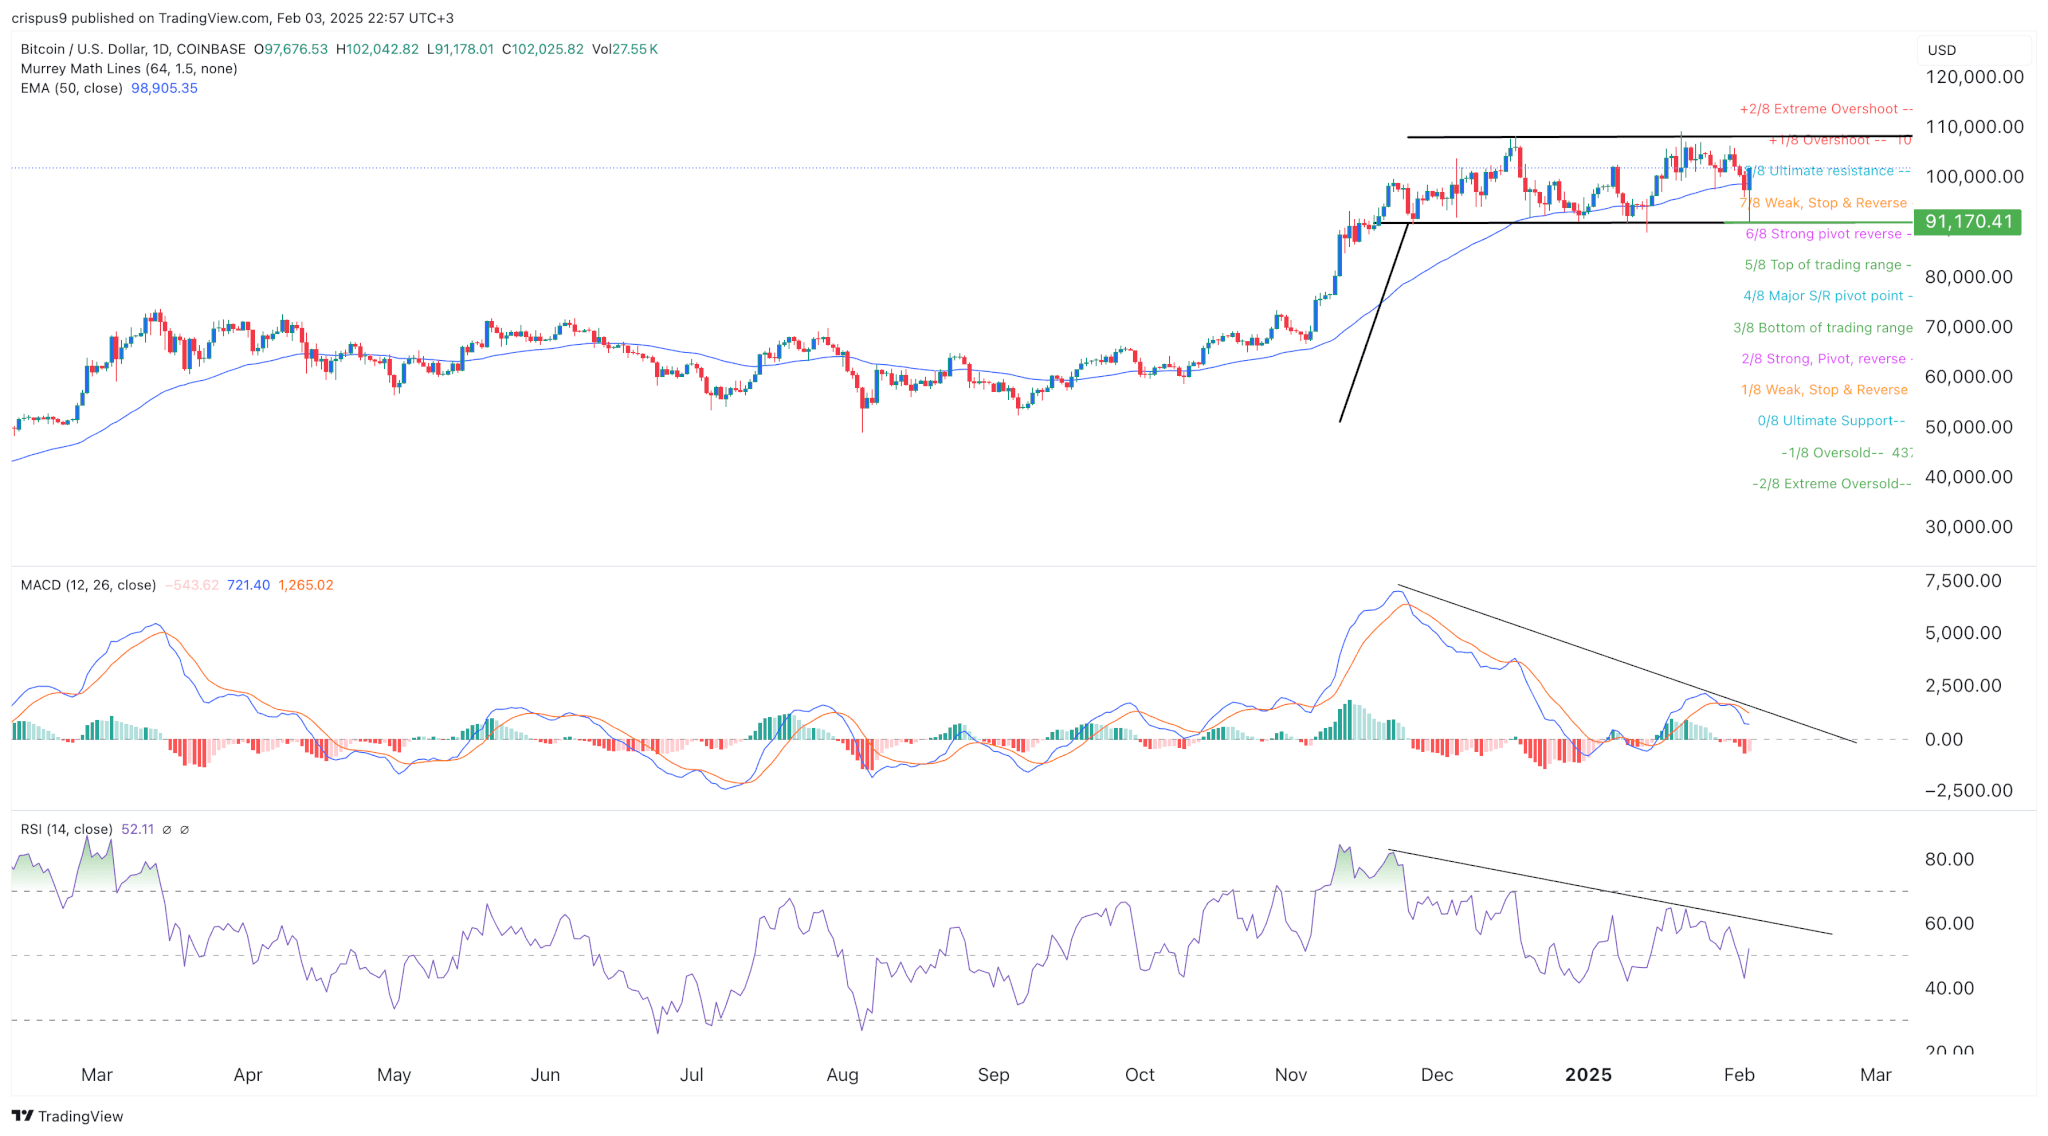
Crypto majors crumbled in early Monday session as financial markets reacted to President Trump’s decision to impose hefty tariffs on its key trade partners. While the risk-off mood pushed the digital assets to multi-month lows, savvy investors saw an opportunity to ‘buy the dip’. Subsequently, the likes of Ripple and Bitcoin have recorded impressive rebounds with the latter getting back above the psychologically crucial zone of $100,000.
Meanwhile, crypto projects in innovative subsectors are reaping big from the positive market sentiment and appetite for revolutionary projects. Dogizen, a new kid on the block in GameFi is set for explosive success asit leverages on Telegram’s wide reach and the expected pro-crypto environment.
With less than a week left before it hits the open market, DOGIZ tokens are on high demand. Crypto enthusiasts acknowledge that its current price may be the lowest the project ever reaches on its path to explosive growth.
Ripple price impressive rebound as investors buy the dip
Earlier on Monday, Ripple price extended its losses from the previous session; plunging below the ascending trendline connecting several of its lows since mid November 2024. It has dropped to a two-month low at $1.7610 before reversing some of those losses to trade at $2.6902 as at the time of writing.
Similar to most other cryptocurrencies, ripple price was reacting to President Trump’s decision to impose 25% tarriffs on imports from its key trading partners; Canada and Mexico. He has also signed an order imposing a 10% duty on goods from China as from 4th February.
Following the rebound, the altcoin has gone back to trading above the medium-term 50-day EMA even as it remains below the short-term 20-day EMA. At its current level, it will likely find support along the 50-day EMA at $2.6255 as the bulls gather enough momentum to break the resistance along the 20-day EMA at $2.9000. Notably, this thesis will hold for a long as ripple price remains above the crucial zone of $2.5000.
Dogizen enters the home stretch as a broad playing field awaits
Dogizen is on its home stretch with the presale slated to end on Friday, 7th February. In a span of 4 months, the project has already raised $3.86 million.
With this trend, it will likely surpass its target as more savvy investors rush to amass some Dogiz tokens in time. With its apt timing and immense growth potential, its current price of $0.000085 may be the lowest it will ever get to.
As a small-cap cryptocurrency, it has a wider room for growth and is set to secure its early adopters hefty profits upon hitting the open market.
Besides, its listing comes at a time when cryptocurrencies are expected to benefit from President Trump’s policies. In fact, less than a week after his inauguration, he ordered for the establishment of a task force mandated to propose regulations on digital assets and consider the creation of the country’s crypto stockpile.
In addition to the pro-crypto environment, Dogizen is also set to benefit from its positioning in the Telegram gaming sunsector. To start with, Telegram has over 950 million monthly active users. Couple this with the anticipated crypto bull run in 2025 and expected explosion of the GameFi sector and Dogizen is bound to reach new heights.
What’s more, the project has insured itself against the wave of dumps that has impacted its rivals in the past. Unlike tokens like Catizen and Hamster Kombat, Dogizen embraced a well-organized presale as opposed to airdrops. This strategy has beared the desired fruits with its holders comprising of long-term loyal investors. Learn more abouut how to buy Dogizen here.
Ethereum price nears oversold territory as crypto majors crumble
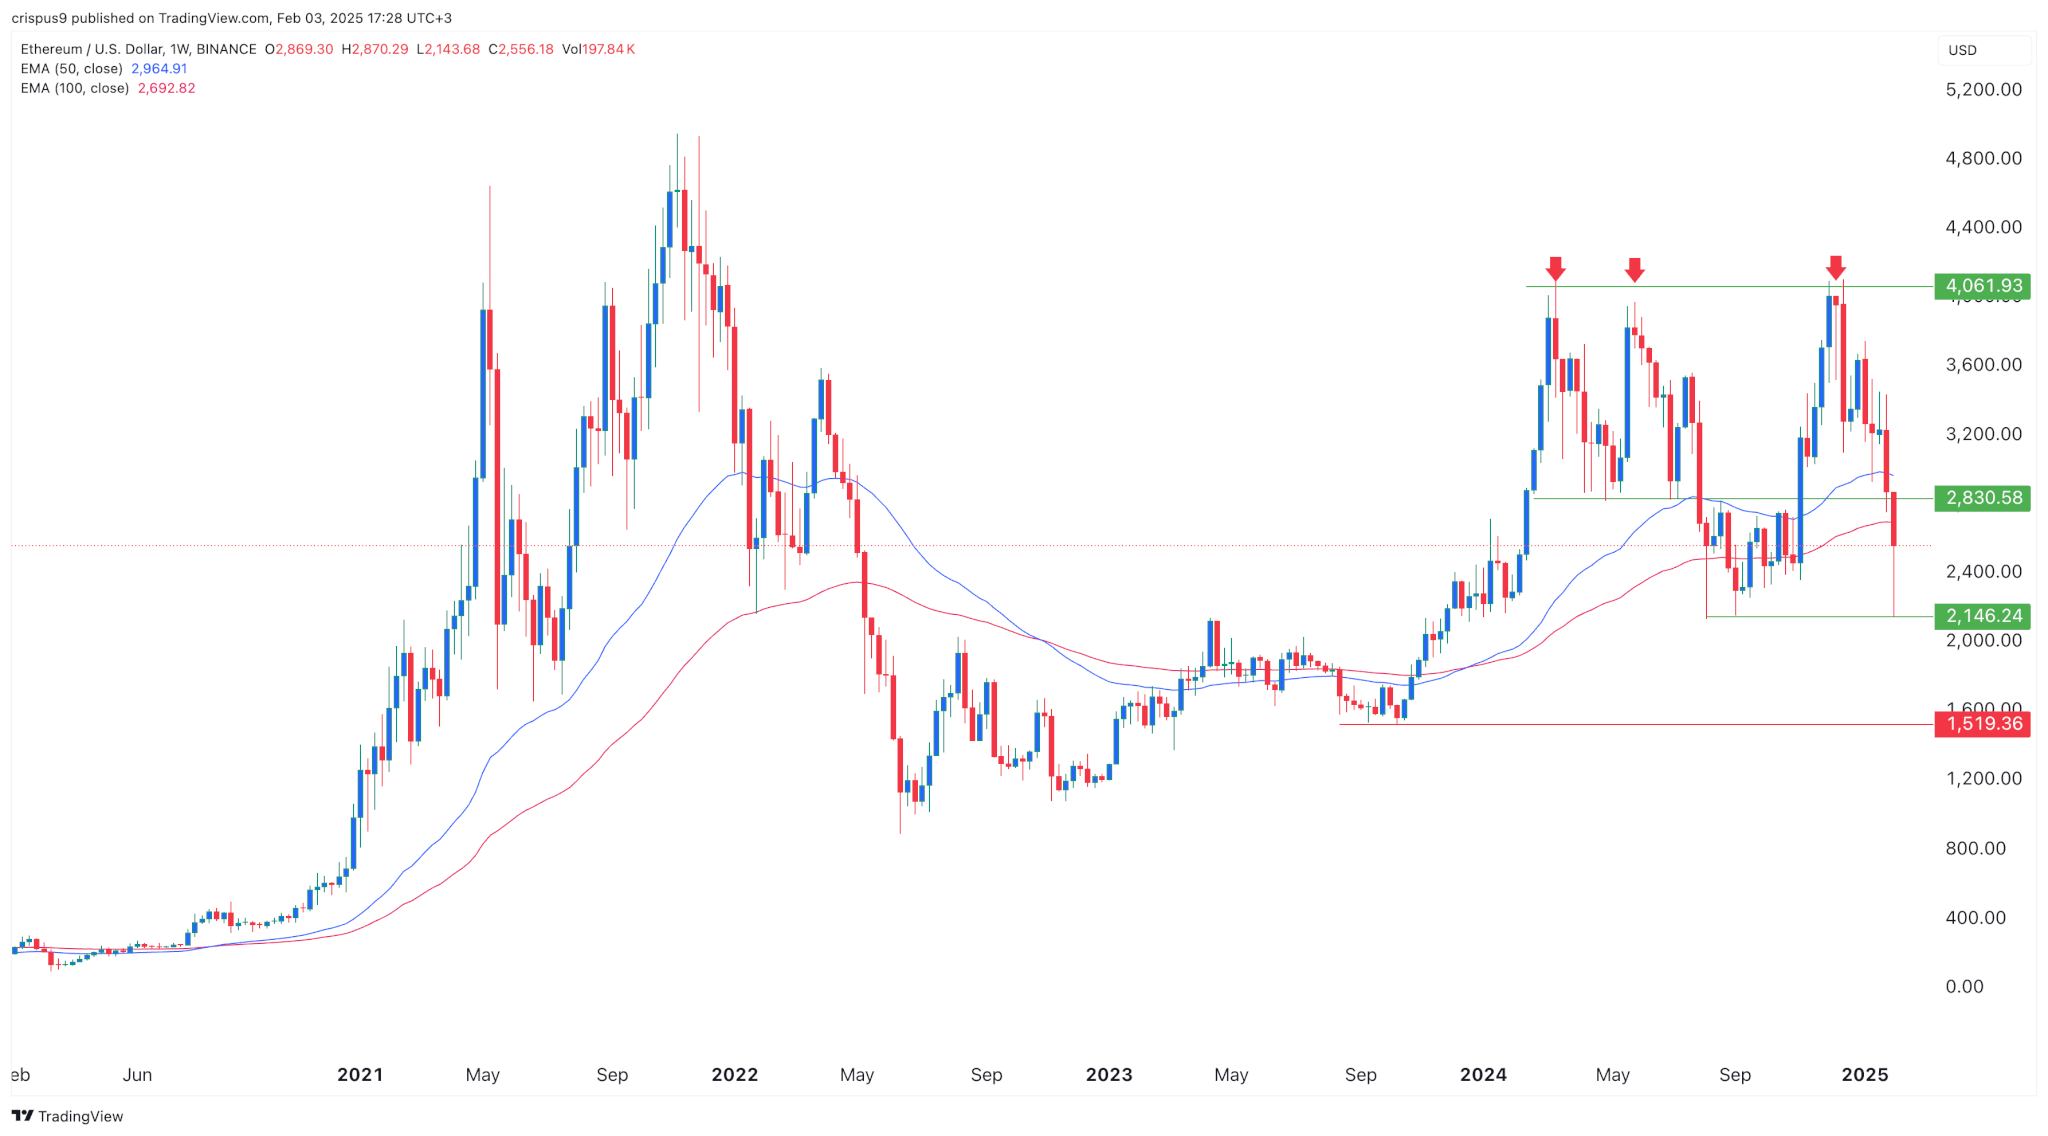
Earlier on Monday’s session, Ethereum price plunged to a 6-month low as the markets reacted to Trump’s decision on tariffs. It has since rebounded to $2,732.53 as at the time of writing.
A look at its daily chart shows the altcoin approaching the oversold territory at an RSI of 32. Besides, the indicator is facing downwards, pointing to the continuation of the current selling pressure.
At its current level, it is hovering around the previously steady support zone of $2,750. Further rebounding will have the bulls eyeing the next target at $2,926.18. On the flip side, further elling pressure may have Ethereum price retest the support level at $2,581.58.


Since the implementation of MiCA in the EU and the shift in US policy under President Trump, both jurisdictions have progressed in crypto legislation, albeit with distinct approaches. Europe got a head start by becoming the first to establish a comprehensive and unified regulatory framework for crypto-assets. Meanwhile, the US is catching up, with more capital to offer and a larger user base.
Manouk Termaaten, CEO of Vertical Studio AI, and Erwin Voloder, Head of Policy at the European Blockchain Association, shared their perspectives with BeInCrypto on the areas where the EU and the US are demonstrating leadership in the high-stakes development of crypto legislation and who will ultimately set the pace for global crypto regulation.
EU’s MiCA and Early Regulatory Certainty
By implementing the Markets in Crypto-Assets (MiCA) regulation on December 30, 2024, the European Union made history as the first jurisdiction to create a complete regulatory structure for crypto-assets that applies to all its member nations.
Since then, leading companies like Standard Chartered, MoonPay, BitStaete, Crypto.com, and OKX, to name a few, have secured their licenses.
The United States, in turn, was slower to act. Instead of lobbying for comprehensive crypto legislation, industry leaders have concentrated on getting approval from the US Securities and Exchange Commission (SEC). Under the Biden administration, that turned out to be a particularly hard feat.
“The EU definitely had a first-mover advantage in getting regulatory certainty out the gate with MiCA. Especially since at the time, the US was retreating from leadership in the digital asset space and the industry was facing what amounted to persecution back home in many cases,” Voloder told BeInCrypto.
Former SEC Chair Gary Gensler became known within the walls of the crypto industry as being particularly hostile toward the technology, taking a controversial regulation-by-enforcement policy stance. Crackdowns became common, and many innovators packed their bags and moved abroad, seeking opportunities in friendlier jurisdictions.
“The US relied on existing agencies like the SEC instead of building a unified crypto law. Remember, Gary Gensler almost cracked down on the market and caused massive fear but never managed to get anything through. This does not mean regulation will never come and creates legal uncertainty that’s driven many projects overseas,” Termaaten said.
Now, under Trump, things have taken quite a turn.
How Does the US Approach Crypto Innovation?
The Trump administration aims to foster a predictable environment for US crypto innovation and expansion through clear regulatory frameworks. It strongly emphasizes keeping that innovation within the United States to establish its global leadership.
In pursuit of this goal, the administration has created working groups and task forces to develop detailed regulatory frameworks, including stablecoins and crypto asset classification guidelines.
“What we’ve seen under the Trump administration so far has been a complete roll-back of Biden-era regulations and weaponization of the agencies against crypto in favour of a light- touch, pro-innovation stance. He’s dismantling the DOJ’s Crypto Enforcement Team, the SEC’s new Crypto-Asset Task Force has a new mandate, under new leadership in Commissioner Pierce, and there’s ongoing investigations in the House against the systematic de-banking of digital assets businesses, and banks with revelations coming to light almost weekly,” Voloder explained.
As part of this new chapter in crypto regulation, the United States intends to forge its path, developing distinct crypto regulations rather than adopting the EU’s MiCA framework. Its intent diverges significantly from the European approach.
MiCA’s Regulatory Framework in the EU
MiCA provides the EU with a comprehensive and unified regulatory framework for crypto assets, extending bank-like rules focused on financial stability and consumer protection.
The regulation mandates licensing for crypto service providers and stablecoin issuers, aligning them with traditional finance and supporting the creation of a Central Bank Digital Currency (CBDC) as a digital euro to safeguard monetary sovereignty.
“The EU treats crypto as part of its traditional financial system– it’s cautious, centralized, and prioritizes regulation through MiCA and the upcoming digital euro (CBDC),” Termaaten told BeInCrypto.
The US, however, operates with a contrasting attitude.
US Focus on Private Innovation and Opposition to CBDCs
Trump has clearly stated that he intends to eliminate any regulations that promote CBDCs, citing concerns about government overreach and the erosion of financial freedom.
The United States now charts a policy course that champions blockchain technology through private innovation while firmly opposing CBDCs. This stance is underscored by a recent executive order in which the White House argues that CBDCs “threaten the stability of the financial system, individual privacy, and the sovereignty of the United States.”
Trump has also clarified that stablecoins are the priority for innovation, as they can help reinforce US dollar dominance.
Meanwhile, a notably fragmented approach has characterized the advancement of crypto legislation in the US. The absence of nationwide regulations has allowed certain states to establish an early lead, but others continue to lag in pursuing crypto innovation.
“The US, especially under Trump’s recent shift, is leaning harder into private-sector innovation, explicitly opposing a CBDC and focusing on blockchain as a new tech frontier, which the USA will be the capital from. The EU’s approach is about control and stability; the US’s is about flexibility and economic leadership through innovation. Both aim to protect consumers, but through very different methods,” Termaaten said.
These fundamentally different philosophies also allow for the analysis of which regulations yield the most favorable outcomes.
What are the Financial Burdens of MiCA Compliance?
The significant investment companies must make to obtain a MiCA operating license has drawn scrutiny. Though member states set varying fees, these are generally steep.
“[There are] high costs that are not in proportion compared to the gain for a business. It also just adds a layer of legal complexity most projects dont want to bring into their project. At Vertical AI, we decided it’s strategic to proceed with becoming compliant, but others could just geo-block EU users to avoid the burden,” Termaaten told of his personal experience.
MiCA mandates minimum capital requirements based on the crypto services offered. These range from €50,000 for advisory and order-related services to €125,000 for exchange and trading platforms and up to €150,000 for custody services. Businesses must maintain this capital as a financial safeguard.
Beyond minimum capital requirements, companies must factor in government and legal fees, local presence costs, bank setups, and ongoing operational costs.
“MiCA is an expensive regulation. Compliance in Europe can be an exorbitant expense and I think the main challenge going forward at least for start-ups is justifying the high up-front costs of advisory, licensing, auditing etc., when many of these companies have a fixed burn they need to manage. The last thing you want to be doing as a start-up is piling all of your capital into compliance when that money could have been put to better use developing/refining your product and your GTM,” Voloder told BeInCrypto.
In contrast, the US allows crypto companies greater leeway to innovate.
Flexible Regulatory Stance and Private Sector Innovation in the US
While the European Union’s MiCA regulation establishes a comprehensive and structured regulatory environment, the United States has opted for a more flexible regulatory stance.
This approach prioritizes the growth of private blockchain innovation, aiming to encourage rapid development and technological advancement within the crypto industry by providing a less restrictive regulatory environment.
“The US favors letting the private sector innovate, especially with USD-backed stablecoins, which it believes can expand dollar dominance globally. This approach avoids centralization while still enabling digital payments innovation. It’s very much a “let the market lead” philosophy. In my opinion, the way to go with crypto,” Termaaten told BeInCrypto.
Should the US continue developing crypto-friendly legislation, it will quickly position itself to outpace Europe in this regulatory race.
“The EU still leads in terms of finalized law (MiCA), but the US is regaining ground by openly backing the crypto industry and promising regulatory clarity. If that clarity turns into actual, friendly regulation, the US will become more attractive than the EU– especially for developers and fintech firms who value speed and scale + access to more venture capital,” Termaaten said, adding that, “While the EU is a large crypto market, the US still dominates in capital, user base, and market liquidity.”
This contrasting approach, favoring a more agile and less burdensome regulatory environment, illustrates the fundamental differences in how each jurisdiction envisions the future of digital finance.
Will the US or EU Ultimately Secure Global Leadership?
While the European Union secured an early advantage in the global crypto regulatory landscape through the comprehensive and unified framework of MiCA, its thoroughness and the significant financial investment required for licensing have inadvertently created barriers to rapid innovation.
This situation has opened a window of opportunity for the United States, particularly with the shift in administration under Trump. By adopting a more permissive and innovation-centric approach, dismantling perceived regulatory obstacles, and prioritizing private blockchain development, the US is quickly emerging as the preferred jurisdiction for crypto innovation.
Despite Europe’s regulatory clarity, the US’s focus on flexibility, coupled with its robust capital markets and extensive user base, positions it to potentially eclipse the EU as the true leader in fostering the next wave of crypto advancements, provided it can deliver on its promise of clear and supportive legislation.
Disclaimer
Following the Trust Project guidelines, this feature article presents opinions and perspectives from industry experts or individuals. BeInCrypto is dedicated to transparent reporting, but the views expressed in this article do not necessarily reflect those of BeInCrypto or its staff. Readers should verify information independently and consult with a professional before making decisions based on this content. Please note that our Terms and Conditions, Privacy Policy, and Disclaimers have been updated.

Canary Capital has filed a Form S-1 registration with the US Securities and Exchange Commission (SEC) to launch a spot exchange-traded fund (ETF) focused on Tron (TRX).
The proposal, submitted on April 18, is the first of its kind to offer investors exposure to TRX’s market performance while also providing staking rewards. This sets the fund apart from previous spot crypto ETF proposals.
Canary Capital’s TRX ETF Could Test SEC Stance on Staking Assets
The filing designates BitGo Trust Company as the custodian for TRX holdings and appoints Canary Capital as the fund’s sponsor.
Justin Sun, the founder of Tron, weighed in on the development, encouraging US investors to act promptly. He emphasized TRX’s potential for long-term growth and suggested institutional interest would likely surge if the ETF is approved.
“US VCs should start buying TRX — and fast. Don’t wait until it’s too late. TRX is a price that only moves one way: up,” Sun said on X.
According to BeInCrypto data, TRX is currently the ninth-largest crypto by market capitalization, valued at approximately $22.94 billion.
Moreover, Tron’s blockchain has gained strong traction in stablecoin settlements, ranking second only to Ethereum. Its efficiency in processing fast and low-cost transactions has made it a preferred choice for Tether’s USDT, based on data from DeFiLlama.

While the proposal has created a buzz in the market, questions remain over its chances of gaining regulatory approval. The inclusion of staking within the ETF is a bold move, but the SEC has historically opposed similar features in other crypto funds.
The SEC has flagged staking services within investment products as potential unregistered securities, leading to increased scrutiny.
Due to this, past Ethereum ETF proposals were forced to remove staking components to align with regulatory expectations.
Nonetheless, several firms, including Grayscale, continue to push for altcoin ETFs that incorporate staking or offer broader asset exposure.
Still, regulatory uncertainty clouds the Canary TRX ETF proposal, especially in light of past controversies involving Justin Sun. The network has also faced allegations of being used by illicit actors, claims it has publicly denied.
If approved, Canary Capital’s ETF would mark a historic milestone by combining exposure to TRX with staking rewards. This structure could attract both retail and institutional investors seeking yield alongside market performance.
Disclaimer
In adherence to the Trust Project guidelines, BeInCrypto is committed to unbiased, transparent reporting. This news article aims to provide accurate, timely information. However, readers are advised to verify facts independently and consult with a professional before making any decisions based on this content. Please note that our Terms and Conditions, Privacy Policy, and Disclaimers have been updated.
Reason to trust
![]()
Strict editorial policy that focuses on accuracy, relevance, and impartiality
Created by industry experts and meticulously reviewed
The highest standards in reporting and publishing
Strict editorial policy that focuses on accuracy, relevance, and impartiality
Morbi pretium leo et nisl aliquam mollis. Quisque arcu lorem, ultricies quis pellentesque nec, ullamcorper eu odio.
XRP is still in consolidation mode after hitting a new seven-year high in January 2025. This consolidation has seen the price drop slowly, but steadily, losing around 40% of its value since then. Currently, bulls seem to have created support for the altcoin at $2, as this level continues to hold even through crashes. Thus, it has created the expectation that the bottom could be close for the XRP price, and this could serve as a bounce-off point.
XRP Price Consolidation Could Be Over Soon
Taking to X (formerly Twitter), crypto analyst Dark Defender revealed that the consolidation that the XRP Price has been stuck in for months now is coming to an end. The analyst used the monthly chart for the analysis, calling out an end and a bottom for the XRP price. According to him, this is actually the “Final Consolidation” for XRP, suggesting that this is where a breakout would start from.
Related Reading
With the consolidation expected to come to an end soon, the crypto analyst highlights what could be next for the altcoin using the 5-Wave analysis. Now, in total, these five waves are still very bullish for the price and could end up marking a new all-time high.
For the first wave, Dark Defender calls it the Impulsive Wave 1, which is expected to begin the uptrend. This first wave is expected to push the price back to $3 before the second wave starts, and this second wave is bearish.
The second wave would trigger a crash from $3 back toward $2.2, providing the setup for the third wave. Once the third wave begins, this is where the crypto analyst expects the XRP price to hit a new all-time high. The target for Wave 3 puts the XRP price as high as $5, clearing the 2017 all-time high of $3.8.
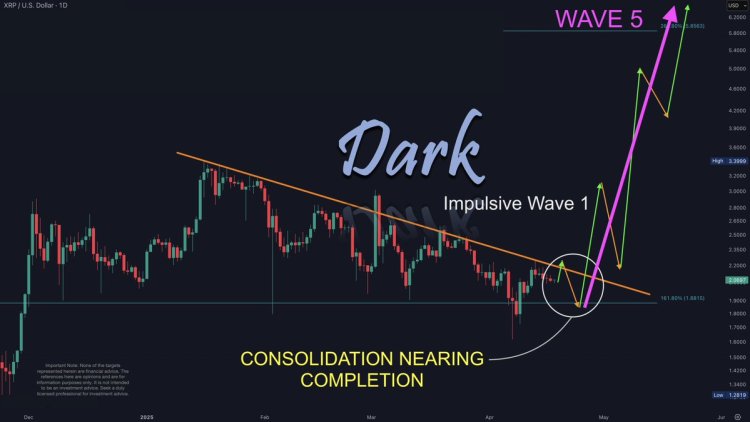
Next in line is the fourth wave, which is another bearish wave. This wave will cause at least a 30% crash, according to the chart shared by the crypto analyst, taking it back toward the $3 territory once again. However, just like the second bearish wave, the fourth bearish wave is expected to set up the price for a final and more explosive Wave 5.
Related Reading
Once the fifth wave is in action, a brand-new all-time high is expected to happen, with the price rising over 100% from the bottom of the fourth wave. The target for this, as shown in the chart, is over $6.
As for the crypto analyst, the major targets highlighted during this wave action are $3.75 and $58.85. Then, for major supports and resistances, supports are $1.88 and $1.63, while resistances lie at $2.22 and $2.30.
Featured image from Dall.E, chart from TradingView.com

MiCA vs Trump’s Crypto Policy: Battle for Crypto Dominance

Ethereum Trades At Bear Market Lows: Fundamentals Signal Major Undervaluation

Canary Capital Aims to Launch TRON-Focused ETF

Cardano Price To Hit $4 If This Happens, Analyst Says Despite 180M ADA Dump

XRP Consolidation About To Reach A Bottom, Wave 5 Says $5.85 Is Coming
Chainlink Price To Hit $26 If LINK Breaks Past This Crucial Level

2.52 Million Altcoins Are Ruining Crypto’s Future

Animoca Brands Valuation Tanks 75% In Two Years, Here’s Why

Crypto exchange BingX hacked for $43 million

Are The Big Players Losing Interest?

Hong Kong’s Securities Association Tips Authorities On Crypto Self-Regulation

Coinbase cbBTC Set to go Live on Solana
2.52 Million Altcoins Are Ruining Crypto’s Future
Animoca Brands Valuation Tanks 75% In Two Years, Here’s Why
Crypto exchange BingX hacked for $43 million
Are The Big Players Losing Interest?
Hong Kong’s Securities Association Tips Authorities On Crypto Self-Regulation
Coinbase cbBTC Set to go Live on Solana
-
 Altcoin22 hours ago
Ethereum ETFs Record $32M Weekly Outflow; ETH Price Crash To $1.1K Imminent?
-

 Market14 hours ago
Pi Network Roadmap Frustrates Users Over Missing Timeline
-

 Market15 hours ago
MEME Rallies 73%, BONE Follows
-

 Ethereum21 hours ago
Ethereum Price Stalls In Tight Range – Big Price Move Incoming?
-
 Market20 hours ago
How $31 Trillion in US Bonds Could Impact Crypto Markets in 2025
-
 Altcoin18 hours ago
XRP Price History Signals July As The Next Bullish Month
-

 Market21 hours ago
Are Ethereum Whales Threatening ETH Price Stability?
-

 Market13 hours ago
Solana (SOL) Price Rises 13% But Fails to Break $136 Resistance