
Ethereum
Ethereum Long-Term Bullish Structure At Risk – $2,700 Support Is Key for a $7K Target

Ethereum faced a brutal capitulation event on Sunday, plummeting over 30% in less than 24 hours as market-wide panic took hold. The dramatic sell-off was fueled by growing fears of a U.S. trade war, sending shockwaves across the crypto space and causing Bitcoin and major altcoins to drop significantly. ETH, which had been struggling to reclaim key levels, saw a sharp decline, shaking investor confidence and raising concerns about its long-term trend.
Related Reading
Top analyst Ali Martinez shared a technical analysis, revealing that Ethereum is forming a long-term head-and-shoulders pattern. According to Martinez, ETH must hold above the crucial $2,700 level to maintain its bullish structure and prevent a deeper correction. A breakdown below this level could trigger an extended bearish phase, further delaying ETH’s potential rally toward new highs.
With volatility at extreme levels and uncertainty dominating the market, Ethereum’s next move will be critical. If bulls manage to defend key support, ETH could stage a strong recovery, but failure to hold could lead to even more downside. As investors assess the damage from this weekend’s crash, all eyes remain on whether ETH can stabilize and reclaim momentum in the coming days.
Ethereum Faces A Key Challenge
Yesterday, the crypto market witnessed the largest liquidation event in its history, with over $2 billion wiped out in just a few hours. Fear has taken over, and investors are bracing for extreme volatility this week as the U.S. market reacts to escalating trade war tensions. With uncertainty dominating the landscape, Ethereum has been one of the most impacted assets, shedding a significant portion of its value as panic selling intensified.
Ethereum’s price plummeted over 37% since last Friday, marking one of its sharpest declines in recent years. The dramatic downturn has led analysts to question whether ETH can maintain its long-term bullish structure or if a deeper correction is imminent.
Top crypto expert Ali Martinez shared a technical analysis on X, revealing that Ethereum appears to be forming a long-term head-and-shoulders pattern. If this pattern is confirmed, ETH must hold above the critical $2,700 mark to keep its bullish structure intact. Losing this level could trigger a deeper selloff, potentially pushing prices toward lower demand zones before any recovery takes place.
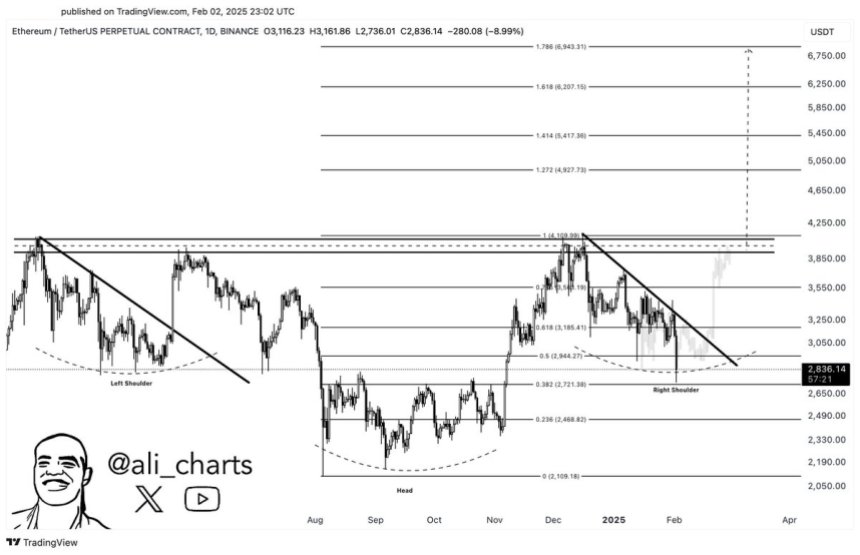
However, if bulls successfully defend this crucial support, Ethereum could still have a shot at reclaiming lost ground and targeting its long-term goal of $7,000. The coming days will be pivotal in determining ETH’s trajectory as traders assess whether this is a temporary shakeout or the beginning of a prolonged downtrend.
Related Reading
As macroeconomic fears and trade war tensions continue to influence market conditions, Ethereum’s price action will be a key indicator of broader investor sentiment. This week will likely set the tone for ETH’s movement in the coming months, making it a defining moment for the second-largest cryptocurrency.
Price Action Details: Key Levels To Watch
Ethereum (ETH) is currently trading at $2,595 after an extremely volatile Sunday that saw its price plummet to as low as $2,150. The drastic drop has left bulls in a precarious position, as ETH has lost all major support levels and is now searching for demand to stabilize.
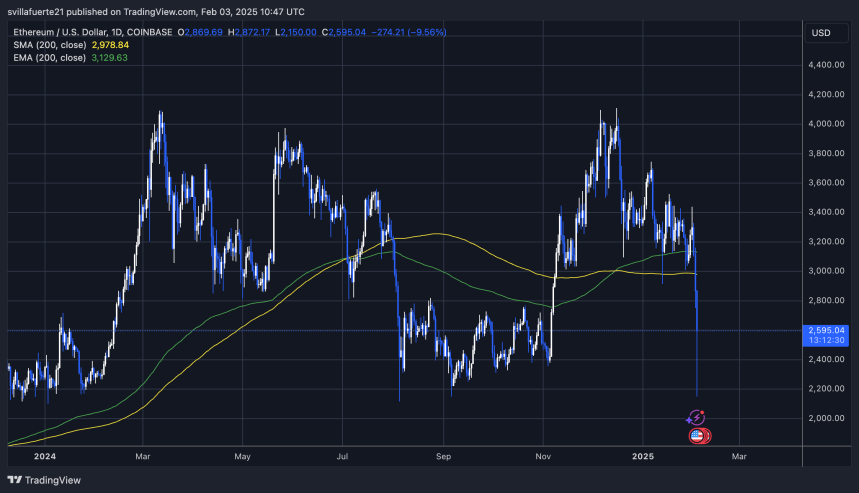
With the market shaken and fear-dominant sentiment, ETH must hold above the $2,600 mark in the coming days to have a chance at recovery. However, after such a massive liquidation event, regaining bullish momentum may take time, and the likelihood of further downside remains high. Traders and investors are watching key levels closely as Ethereum struggles to find its footing.
Related Reading
If ETH manages to reclaim the $2,800 level and push above $3,000, confidence could return to the market, signaling the first steps of a recovery. Until then, uncertainty remains the dominant force, and the potential for another leg down cannot be ruled out. The next few days will be crucial in determining whether Ethereum can bounce back or if it will continue its decline toward lower support levels.
Featured image from Dall-E, chart from TradingView


Reason to trust
![]()
Strict editorial policy that focuses on accuracy, relevance, and impartiality
Created by industry experts and meticulously reviewed
The highest standards in reporting and publishing
Strict editorial policy that focuses on accuracy, relevance, and impartiality
Morbi pretium leo et nisl aliquam mollis. Quisque arcu lorem, ultricies quis pellentesque nec, ullamcorper eu odio.
Ethereum (ETH) is facing significant selling pressure, trading below the $1,900 mark as market uncertainty continues to weigh on price action. After losing the critical $2,000 level, ETH plunged as low as $1,750, marking its lowest point since October 2023. Bulls are now under pressure, as they must defend the current demand zone to prevent further downside and restore investor confidence.
Related Reading
Market conditions remain fragile, with Ethereum struggling to find strong buying interest. If bulls fail to hold current support levels, ETH could see further declines, adding to the bearish sentiment that has dominated the market in recent weeks.
On-chain data from CryptoQuant reveals that Ethereum’s Net Taker Volume remains at a low level, indicating that selling pressure is still strong. This suggests that market participants are leaning bearish, with more sell orders than buy orders dominating Ethereum’s price action.
With ETH trading in a vulnerable position, the next few days will be crucial. If bulls can stabilize the price and push ETH back above $1,900, a potential recovery could begin. However, if selling pressure persists, Ethereum may continue its downward trend, testing lower support levels in the coming weeks.
Ethereum Faces Heavy Selling Pressure
Ethereum has lost over 57% of its value, creating an extremely difficult environment for bulls as the market remains in a deep downtrend. Currently, ETH is trading below a multi-year support level, which has now turned into a strong resistance zone. As ETH struggles to break back above the $1,900–$2,000 range, the bearish trend continues, with bulls failing to regain momentum.
Related Reading
The entire crypto market has suffered a breakdown, mirroring weakness in the U.S. stock market, as global trade war fears and growing uncertainty surrounding U.S. President Trump’s policies shake investor confidence. Since the U.S. elections in November 2024, macroeconomic volatility and uncertainty have been the dominant forces in driving markets lower. With no clear resolution in sight, investors remain cautious, as the U.S. stock market has now reached its lowest levels since September 2024.
Top analyst Quinten Francois shared data on X, revealing that Ethereum’s Net Taker Volume is at historic lows, signaling intense selling pressure. This indicates that sellers continue to dominate the market, preventing ETH from staging any meaningful recovery. Until buyers step in with strong demand, ETH may remain stuck in a bearish phase, with further downside risk if key support levels fail.

With Ethereum struggling below critical resistance and selling pressure increasing, the next few weeks will be pivotal in determining whether ETH can stabilize or if the market will see further losses. If bulls cannot reclaim lost ground, Ethereum could face even deeper corrections in the near term.
ETH Stuck In Range As Bulls Fight to Reclaim $2,000
Ethereum is currently trading at $1,880, remaining range-bound between $1,750 and $1,950 since last Monday. This tight trading range has kept ETH in a consolidation phase, with neither bulls nor bears gaining full control over price action.
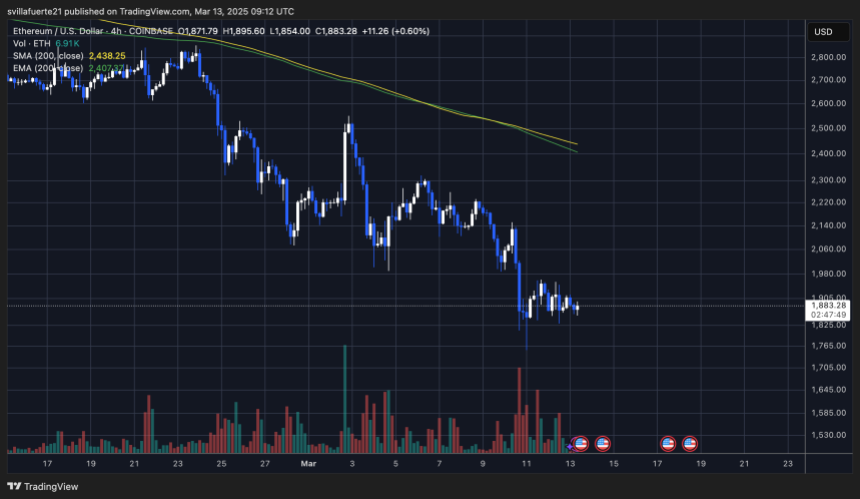
For Ethereum to start a recovery rally, bulls must push the price back above $2,000 as soon as possible. A break and close above this psychological level would indicate renewed buying momentum, allowing ETH to potentially test higher resistance levels. However, Ethereum remains in a fragile position, as selling pressure continues to weigh on the market.
If ETH fails to hold its current levels and breaks below $1,750, it could result in a steady continuation of the downtrend, with further downside risks emerging. Bears would likely target lower support zones, extending the bearish phase and delaying any chance of a sustained recovery.
Related Reading
With uncertainty still dominating the market, traders are closely watching whether Ethereum can break out of this range or if it will extend its decline, following the broader market’s risk-off sentiment. The next few trading sessions will be critical for ETH’s short-term direction.
Featured image from Dall-E, chart from TradingView


Ethereum is still under significant bearish pressure, with the possibility that the downward trend might continue in the coming days or weeks as the market struggles to recover. After dropping sharply over the last few days, ETH may have finally reached that crucial moment that could trigger a significant upward surge.
A Strong Rally To New Highs On The Horizon For Ethereum?
During negative market conditions, Ethereum, the second-largest crypto asset, tends to decline along with other major digital assets like Bitcoin and Solana. ETH’s price has now fallen below $2,000 once again, raising uncertainty about a short-term upside breakout and reversal.
However, seasoned market expert and investor Trader Tardigrade points to a bullish development on the ETH’s chart that could lay the groundwork for a rebound and a rally. His prediction suggests that ETH is gearing up for a significant recovery as the altcoin enters a crucial oversold zone.
With Ethereum trending in an oversold zone, this implies that selling pressure may have reached exhaustion, which could pave the way for buying pressure. Once buying pressure returns, a new wave of optimism will be introduced to the market, increasing the likelihood of another rally.
According to the analyst, Ethereum has entered the oversold zone on the Stochastic indicator in a 3-year span. Besides determining overbought and oversold conditions, the key indicator is also used to gauge trend reversals and divergences.

Considering the development, Trader Tardigrade believes that the altcoin may have reached the bottom at the current level. Historically, ETH has seen notable growth from the bottom, as seen in the monthly chart. The chart shows a similar trend in 2019 and 2022, in which each cycle spurred a strong rally.
These past scenarios provide more confirmation of Trader Tardigrade’s upsurge expectation. Should it mirror previous trends, the analyst foresees a move toward new all-time highs, mainly targeting the $11,500 mark. Many crypto experts have predicted that ETH’s path to the $10,000 milestone and beyond is programmed and natural.
ETH’s Upside Momentum Hinges On This Key Area
Ethereum is witnessing another day of bearish movement as its price loses the $1,900 support level. Delving into ETH’s current price action, Ali Martinez, a crypto expert and trader, has predicted the next possible move for the altcoin using the Market Value to Realized Value (MVRV) Pricing Bands.
After examining the MVRV Extreme Deviation Pricing Bands metric, Ali Marinez highlighted that ETH is testing key support levels that are crucial for its next move. If the realized price of $2,060 fails to hold, Martinez noted that the next significant support is located at $1,440, suggesting a potential deeper decline in ETH’s price.
At the time of writing, Ethereum was trading at $1,892, displaying a 0.30% drop in the last 24 hours. With ETH falling below the $1,900 mark, bearish sentiment has risen around the asset, as evidenced by a more than 37% decrease in its daily trading volume.
Featured image from Unsplash, chart from Tradingview.com
Editorial Process for bitcoinist is centered on delivering thoroughly researched, accurate, and unbiased content. We uphold strict sourcing standards, and each page undergoes diligent review by our team of top technology experts and seasoned editors. This process ensures the integrity, relevance, and value of our content for our readers.
Ethereum
This Ethereum Monthly RSI Chart Just Crashed To New Lows To Break 2022 Records, What Happened Last Time?

Reason to trust
![]()
Strict editorial policy that focuses on accuracy, relevance, and impartiality
Created by industry experts and meticulously reviewed
The highest standards in reporting and publishing
Strict editorial policy that focuses on accuracy, relevance, and impartiality
Morbi pretium leo et nisl aliquam mollis. Quisque arcu lorem, ultricies quis pellentesque nec, ullamcorper eu odio.
Ethereum’s price has been facing significant downward pressure in recent days, with the cryptocurrency even dipping below the $2,000 mark for the first time since December 2023. The crash below $2,000 has done more harm to the already declining bullish sentiment, and the next outlook is whether there will be more incoming declines or whether the leading altcoin is already nearing a bottom.
Notably, an interesting signal of a probable outcome has been revealed through the Ethereum CME Futures chart, where the monthly Relative Strength Index (RSI) just reached its lowest level on record, surpassing the readings from the 2022 bear market.
Ethereum’s Monthly RSI Drops Below 2022 Levels
Crypto analyst Tony “The Bull” Severino has highlighted a significant development in Ethereum’s technical indicators, pointing out that the cryptocurrency’s monthly Relative Strength Index (RSI) on the CME Futures chart has now fallen to its lowest level on record.
Related Reading
This decline has pushed the RSI below the 2022 bear market bottom, a period that saw Ethereum reach multi-year lows before eventually staging a recovery. Severino shared this observation in a detailed technical analysis post on social media platform X, using Ethereum’s Futures monthly candlestick timeframe chart.
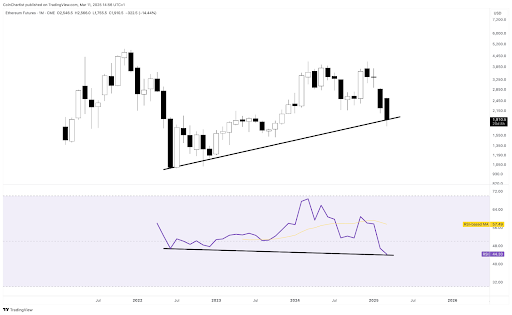
The analyst noted that although this drop suggests strong selling momentum, it could also be forming a hidden bullish divergence. This is because the last time Ethereum’s RSI dropped to such extreme lows, it eventually found its footing around $900 and embarked on a price uptrend in the months that followed. This previous performance raises the possibility of Ethereum approaching a bottom, despite its current downward momentum. It is possible that Ethereum has now found a footing around $1,900 and is now gearing up for another uprend in the coming months.
However, Severino remained cautious about the situation, stating that the reading could also mean that the selling pressure is at its strongest and could continue driving Ethereum lower into oversold conditions. Interestingly, he also made it clear that despite the potential for a reversal, he is currently leaning more toward a bearish outlook on Ethereum.
Stochastic Indicator Points To A Deeper Bearish Phase
Beyond the RSI levels, another key indicator that Severino highlighted is Ethereum’s one-month Stochastic oscillator, which has now dropped below the 50 mark. In a previous analysis, he noted that Ethereum’s drop below the 50 mark is characteristic of a bear maket territory. However, it typically does not find a bottom until the Stochastic indicator reaches below 20 and is in extreme oversold conditions.
Related Reading
As shown by the chart below, past trends indicate that when Ethereum’s Stochastic oscillator enters bear market territory, it often takes months before the asset stabilizes and begins a strong recovery.
At the time of writing, Ethereum is trading at $1,920, having recently reached a low of $1,851 in the past 24 hours.
Featured image from Unsplash, chart from Tradingview.com

Ripple Secures DFSA License in the UAE

Altcoins At Risk Of More Losses As Market Shifts Heavily Toward A Bitcoin Season

XRP Jumps 5% as Bulls Target Breakout Above $3

Analyst Explains Why An XRP Price Rally To $10 Is ‘Reasonable’

Ethereum Staking Surges Despite Market Dip

Altcoin Season: Crypto Expert Reveals Why $425 Billion Is Important

2.52 Million Altcoins Are Ruining Crypto’s Future

Animoca Brands Valuation Tanks 75% In Two Years, Here’s Why

Crypto exchange BingX hacked for $43 million

Are The Big Players Losing Interest?

Hong Kong’s Securities Association Tips Authorities On Crypto Self-Regulation

Coinbase cbBTC Set to go Live on Solana
2.52 Million Altcoins Are Ruining Crypto’s Future
Animoca Brands Valuation Tanks 75% In Two Years, Here’s Why
Crypto exchange BingX hacked for $43 million
Are The Big Players Losing Interest?
Hong Kong’s Securities Association Tips Authorities On Crypto Self-Regulation
Coinbase cbBTC Set to go Live on Solana
-

 Ethereum23 hours ago
Ethereum Poised For A Strong Comeback: Key Oversold Zone Hints At A Potential Breakout
-
 Altcoin21 hours ago
Solana Price At Risk As Alameda Unstakes $23 Million SOL
-
 Bitcoin11 hours ago
US Strategic Bitcoin Reserve Sparks Crypto Regulation Surge
-

 Market10 hours ago
PEPE Whales Propel 11% Rally, Fueling Market Optimism
-

 Market15 hours ago
Solana (SOL) Faces Many Challenges—Can Bulls Hold the Line?
-
 Altcoin24 hours ago
Analyst Reveal How Ethereum Price $8,000 Move Could Be In Play
-

 Market23 hours ago
Hedera (HBAR) Price Surge Incoming? Buyers Gain Momentum
-

 Market8 hours ago
Solana Hit by Bearish Signal After 3 Years, Price at Risk