
Ethereum
Ethereum Uptrend Weakens: ETH Faces Pullback Risks As Selling Pressure Intensifies

The general crypto market has experienced a strong downward movement. Ethereum is no exception to this bearish development since the digital asset has experienced a pullback below key support levels. With waning market performances hindering investors’ sentiment toward ETH, the altcoin is likely to undergo an extended pullback in the upcoming days.
Bearish Forces Weigh On Ethereum’s Price
Recent price action shows that Ethereum could be gearing up for a correction phase as heightened selling pressure begins to weigh on the asset. Informative platform IC News predicted after examining investors’ behavior and price performances in the 1-day time frame.
IC News report indicates that bullish momentum is slowing down and investors are considering profit-taking in order to minimize losses. Thus ETH might experience further decline, hitting key support levels if the sell-off keeps increasing.
According to the platform, ETH saw strong selling pressure at the $3,500 price level, indicating a lack of purchasing power from investors. While the platform considers this development a false breakout, it raises the possibility of a rejection shortly.
Considering the price movements, IC News believes that the altcoin will probably see a bullish trend if only it breaks above key thresholds and eventually regains the $3,500 mark. On the other hand, a rejection can cause more volatility and a price decline.
As ETH price fluctuates, investors continue to navigate the development to determine whether the asset can recover its uptrend or if a broader market correction will occur.
However, certain indications cited on ETH’s chart show that it might resume its upward movement to crucial resistance zones close to its all-time high. Titan of Crypto, a technical expert and trader predicts a notable rally for Ethereum as it prepares for a key breakout.
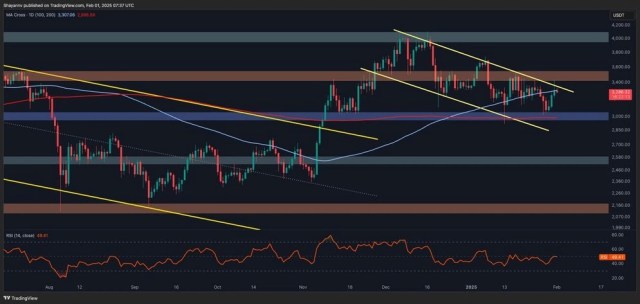
The expert identified a Falling Wedge pattern on the 1-day chart, in which a breakout from the pattern is expected to cause renewed momentum and trigger an upswing for Ethereum. “As anticipated, the bullish divergence kicked in, and ETH’s falling wedge has now played out,” he stated.
Looking at the chart, Titan of Crypto expects the altcoin to surge as high as $4,500 in the upcoming weeks once a breakout happens. Such a rally may attract new and old investors, which will spark an additional uptrend toward a new all-time high.
ETH’s Underperformance Linked To Reduced Whale Transactions
While major altcoins have performed remarkably this cycle, ETH continues to fail to initiate a major price rally. ETH’s underperformance could be linked to sluggish large transaction volumes compared to previous bull cycles.
Historically, a surge in large transaction volume has preceded significant price growth as seen in the 2017 and 2021 market cycles. Meanwhile, Ethereum constantly sees small spikes in whale activity in this cycle, which are unable to signal a parabolic move. For ETH to witness a strong rebound toward key resistance levels, there should be a rise in large transaction volume.
Featured image from Unsplash, chart from Tradingview.com


Ethereum faced a brutal capitulation event on Sunday, plummeting over 30% in less than 24 hours as market-wide panic took hold. The dramatic sell-off was fueled by growing fears of a U.S. trade war, sending shockwaves across the crypto space and causing Bitcoin and major altcoins to drop significantly. ETH, which had been struggling to reclaim key levels, saw a sharp decline, shaking investor confidence and raising concerns about its long-term trend.
Related Reading
Top analyst Ali Martinez shared a technical analysis, revealing that Ethereum is forming a long-term head-and-shoulders pattern. According to Martinez, ETH must hold above the crucial $2,700 level to maintain its bullish structure and prevent a deeper correction. A breakdown below this level could trigger an extended bearish phase, further delaying ETH’s potential rally toward new highs.
With volatility at extreme levels and uncertainty dominating the market, Ethereum’s next move will be critical. If bulls manage to defend key support, ETH could stage a strong recovery, but failure to hold could lead to even more downside. As investors assess the damage from this weekend’s crash, all eyes remain on whether ETH can stabilize and reclaim momentum in the coming days.
Ethereum Faces A Key Challenge
Yesterday, the crypto market witnessed the largest liquidation event in its history, with over $2 billion wiped out in just a few hours. Fear has taken over, and investors are bracing for extreme volatility this week as the U.S. market reacts to escalating trade war tensions. With uncertainty dominating the landscape, Ethereum has been one of the most impacted assets, shedding a significant portion of its value as panic selling intensified.
Ethereum’s price plummeted over 37% since last Friday, marking one of its sharpest declines in recent years. The dramatic downturn has led analysts to question whether ETH can maintain its long-term bullish structure or if a deeper correction is imminent.
Top crypto expert Ali Martinez shared a technical analysis on X, revealing that Ethereum appears to be forming a long-term head-and-shoulders pattern. If this pattern is confirmed, ETH must hold above the critical $2,700 mark to keep its bullish structure intact. Losing this level could trigger a deeper selloff, potentially pushing prices toward lower demand zones before any recovery takes place.
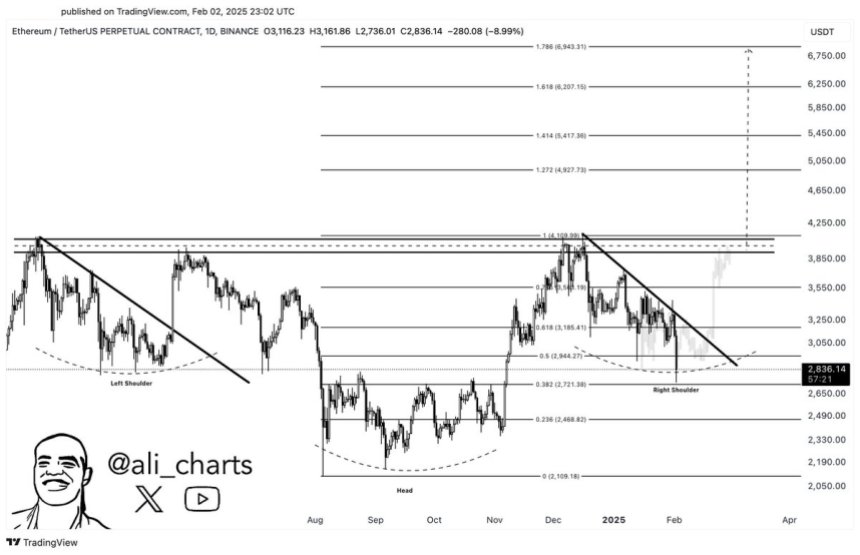
However, if bulls successfully defend this crucial support, Ethereum could still have a shot at reclaiming lost ground and targeting its long-term goal of $7,000. The coming days will be pivotal in determining ETH’s trajectory as traders assess whether this is a temporary shakeout or the beginning of a prolonged downtrend.
Related Reading
As macroeconomic fears and trade war tensions continue to influence market conditions, Ethereum’s price action will be a key indicator of broader investor sentiment. This week will likely set the tone for ETH’s movement in the coming months, making it a defining moment for the second-largest cryptocurrency.
Price Action Details: Key Levels To Watch
Ethereum (ETH) is currently trading at $2,595 after an extremely volatile Sunday that saw its price plummet to as low as $2,150. The drastic drop has left bulls in a precarious position, as ETH has lost all major support levels and is now searching for demand to stabilize.
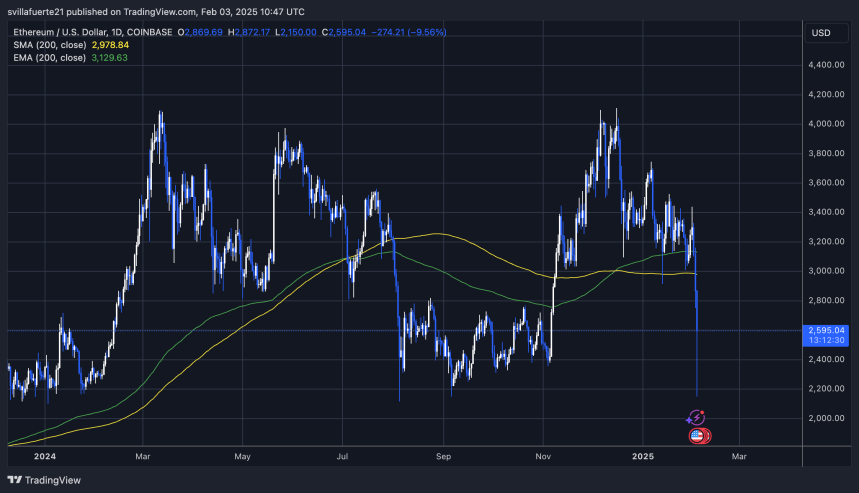
With the market shaken and fear-dominant sentiment, ETH must hold above the $2,600 mark in the coming days to have a chance at recovery. However, after such a massive liquidation event, regaining bullish momentum may take time, and the likelihood of further downside remains high. Traders and investors are watching key levels closely as Ethereum struggles to find its footing.
Related Reading
If ETH manages to reclaim the $2,800 level and push above $3,000, confidence could return to the market, signaling the first steps of a recovery. Until then, uncertainty remains the dominant force, and the potential for another leg down cannot be ruled out. The next few days will be crucial in determining whether Ethereum can bounce back or if it will continue its decline toward lower support levels.
Featured image from Dall-E, chart from TradingView

Ethereum (ETH) has been in a downtrend since late December, facing significant selling pressure and negative market sentiment regarding its performance this year. Despite Bitcoin and other altcoins showing signs of recovery, ETH has struggled to gain momentum, leaving investors questioning whether it will underperform this cycle.
However, top analyst Carl Runefelt shared valuable insights on X, revealing that historical data suggests Ethereum tends to perform very bullishly in key phases of the market cycle. While sentiment remains bearish in the short term, Runefelt believes ETH is still poised for significant upside if it follows past market trends.
The coming weeks will be crucial in determining Ethereum’s next major move. If ETH can reclaim key resistance levels, it could reverse its downtrend and align with the broader bullish momentum seen in the market. However, failure to gain traction could see ETH continue its underperformance, leading to further doubts about its role in this cycle’s rally.
With historical trends pointing toward a potential breakout, all eyes are now on Ethereum’s ability to recover and confirm a bullish trajectory.
February Could Spark An Ethereum Rally
Ethereum has struggled to gain momentum for the past several months, lagging behind Bitcoin and many altcoins. Compared to previous cycles, ETH has remained underwhelming, leading to growing concerns that it might continue to underperform throughout the year. With several fast-growing altcoins emerging and gaining market share, some analysts even speculate that ETH’s position as the second-largest cryptocurrency could be at risk.
Despite the negative sentiment, Ethereum could be approaching a key opportunity for investors. Historically, February has been a strong month for ETH, often marking the start of its parabolic move in the fourth year of the Bitcoin halving cycle. If this trend holds, ETH could be on the verge of a bullish turnaround despite its weak performance so far.
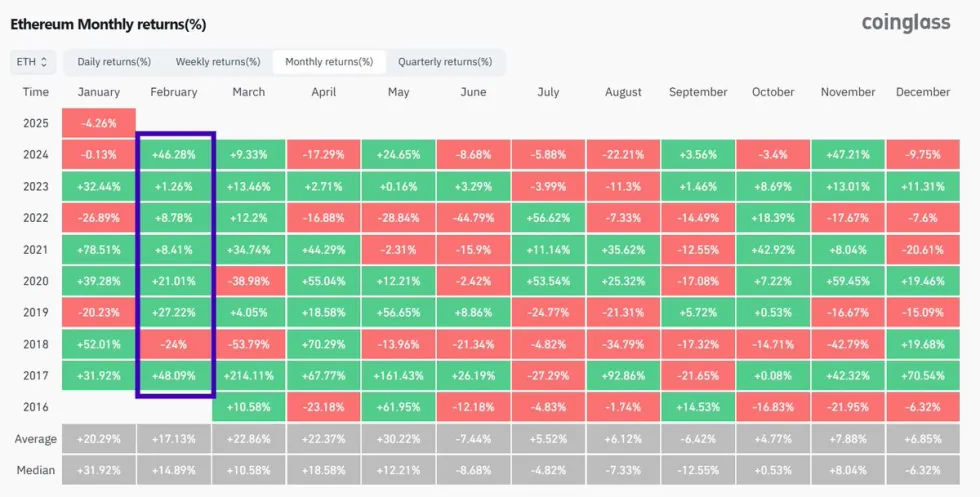
Top analyst Carl Runefelt recently shared a chart on X highlighting Ethereum’s historical monthly returns, revealing that February has consistently been one of ETH’s best months across past cycles. If ETH follows this historical pattern, it could be gearing up for a significant rally, reversing its downtrend and aligning with the broader bullish sentiment in the market.
For now, Ethereum must break out of its bearish structure and reclaim key resistance levels. If it can do so, a major rally could be on the horizon.
Ethereum Struggles at $3,220
Ethereum is trading at $3,220 after enduring days of negative sentiment, volatility, and uncertainty. Despite Bitcoin and other altcoins showing signs of strength, ETH has yet to confirm a trend reversal, leaving investors cautious about its next move.
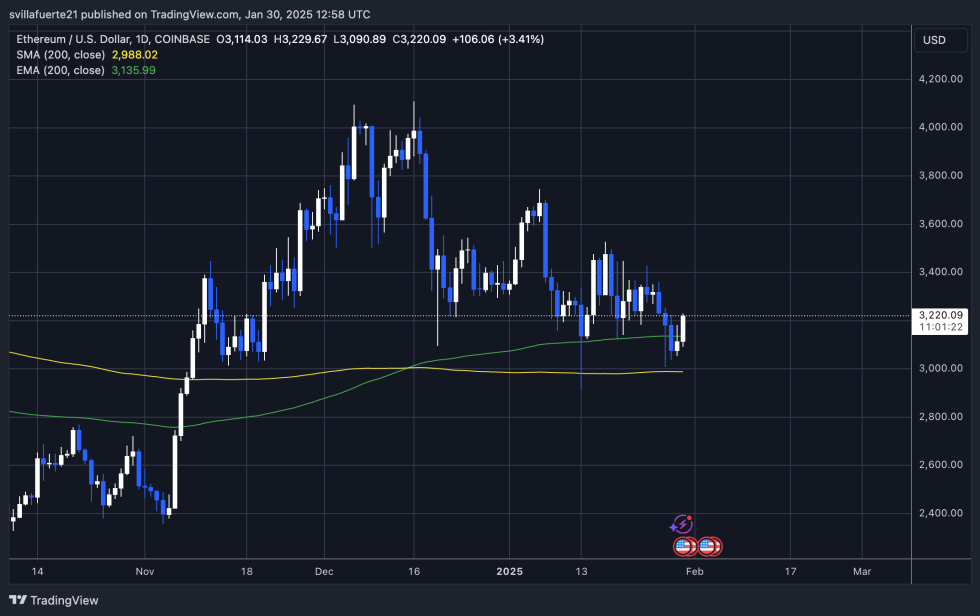
To break out of its bearish structure, ETH must push above $3,220 and reclaim key resistance levels that previously acted as strong support for weeks. The critical zone to watch is $3,500, as a breakout above this mark would confirm bullish momentum and signal the start of a new uptrend.
However, failure to hold current levels could lead to further downside pressure. If ETH drops below $3,000, it could trigger a deeper correction, shaking investor confidence and extending Ethereum’s underperformance relative to Bitcoin and other leading altcoins.
For now, Ethereum remains in a crucial consolidation phase, and the coming weeks will determine whether ETH can reclaim its strength or continue to struggle below key resistance levels.
Featured image from Dall-E, chart from TradingView

Ethereum (ETH) has been under intense selling pressure, raising concerns among investors about the coming weeks. The trend remains bearish, and if this momentum continues, ETH could struggle to find support at key levels. Compared to Bitcoin and other altcoins, ETH has been underperforming, fueling a negative outlook among traders.
Unlike previous market cycles where ETH moved in sync with Bitcoin, recent price action suggests a disconnect between the two assets. Key metrics from IntoTheBlock reveal that ETH remains largely uncorrelated to BTC, showing a 30-day price correlation of just -0.06. This lack of correlation means that Bitcoin’s bullish momentum hasn’t translated into strength for ETH, adding to investor uncertainty.
With Ethereum lagging behind other major cryptocurrencies, analysts warn that further downside is possible unless ETH can reclaim critical resistance levels. The market is closely watching whether ETH can find support and reverse this underwhelming price action or if the bearish trend will continue in the coming weeks. As ETH struggles to regain momentum, investors remain cautious, waiting for a clearer signal before making their next move.
Ethereum Correlation With The Market
Ethereum has been stuck in a downtrend since late December, dropping over 28% from its local high of $4,100. Despite Bitcoin’s bullish momentum, ETH has failed to gain traction, leaving investors concerned about its underwhelming price action. Many are now speculating whether Ethereum could face another disappointing year, as altcoins like Solana, Avalanche, and Polygon continue to outperform ETH in terms of price movement and investor interest.
Key metrics from IntoTheBlock provide an interesting insight into Ethereum’s market behavior. Unlike in previous cycles where ETH closely followed BTC, it now appears largely uncorrelated, with a 30-day price correlation of just -0.06.
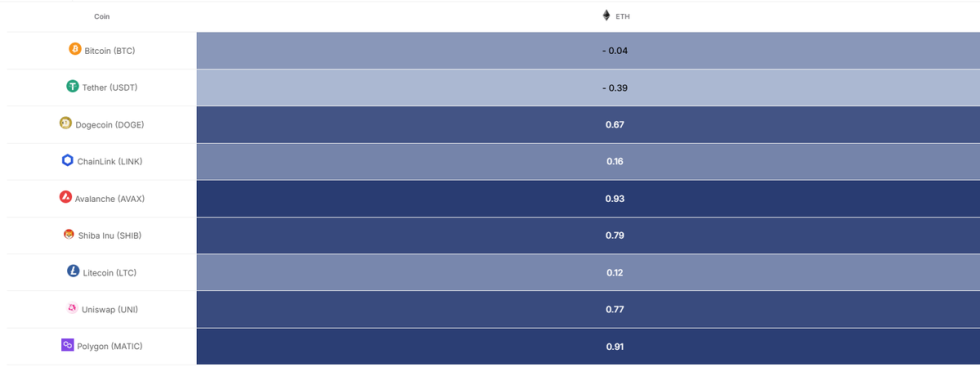
This means that even as Bitcoin moves higher, Ethereum has struggled to gain momentum. However, other major assets like Polygon (0.91) and Avalanche (0.93) remain closely correlated, suggesting that ETH’s price action is unique in this cycle.
Looking ahead, February could be a pivotal month for Ethereum. Historically, this has been a bullish period for ETH, and many investors are hoping for a trend reversal. If ETH can break key resistance levels and reclaim lost ground, the sentiment around its performance this cycle could quickly shift. However, failure to gain momentum could lead to continued stagnation, allowing other altcoins to take the spotlight.
Ethereum Struggles Below Key Support As Bears Take Control
Ethereum is trading at $3,090 after failing to hold above the 200-day Exponential Moving Average (EMA) at $3,137. This key level was a crucial support zone for bulls, but now that it has been lost, bearish pressure is mounting.
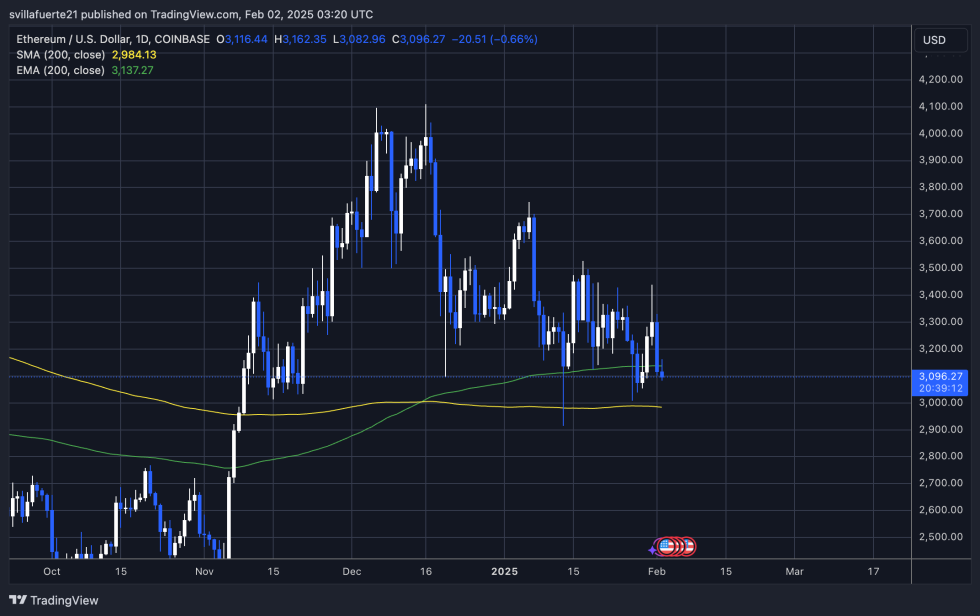
Bulls are in trouble, as the price action suggests ETH is gearing up for another leg down. If this selling pressure continues, ETH could set a new local low and test lower demand around the $2,900 mark. A breakdown below this level would signal a deeper correction, potentially leading to extended consolidation or further declines.
For Ethereum to regain momentum, bulls must reclaim the $3,300 level and push higher. This zone has acted as a strong resistance in recent weeks, and flipping it into support would confirm a trend reversal. However, if ETH fails to reclaim this mark, the next critical level to watch is below $3,000, where additional buying interest may emerge.
With market sentiment leaning bearish, ETH must hold above key demand zones to avoid a more significant downturn. If bulls cannot step in soon, Ethereum could continue to lag behind Bitcoin and other top altcoins.
Featured image from Dall-E, chart from TradingView

XRP Traders See 6-Month High Liquidation, Price Falls Under $2

5 Events To Shake Crypto Markets This Week

Ethereum Long-Term Bullish Structure At Risk – $2,700 Support Is Key for a $7K Target

Kraken Expands In Europe With Regulated Derivatives
3 Altcoins That Reached All-Time Low Today — February 3

Robert Kiyosaki Says Bitcoin Crash Is a Buying Opportunity

2.52 Million Altcoins Are Ruining Crypto’s Future

Animoca Brands Valuation Tanks 75% In Two Years, Here’s Why

Crypto exchange BingX hacked for $43 million

Are The Big Players Losing Interest?

Hong Kong’s Securities Association Tips Authorities On Crypto Self-Regulation

Coinbase cbBTC Set to go Live on Solana
2.52 Million Altcoins Are Ruining Crypto’s Future
Animoca Brands Valuation Tanks 75% In Two Years, Here’s Why
Crypto exchange BingX hacked for $43 million
Are The Big Players Losing Interest?
Hong Kong’s Securities Association Tips Authorities On Crypto Self-Regulation
Coinbase cbBTC Set to go Live on Solana
-

 Bitcoin21 hours ago
Bitcoin Will Be ‘Worthless’ In 10 Years, Finance Nobel Prize Winner Says
-

 Market23 hours ago
5 Token Unlocks to Watch Next Week
-
 Market22 hours ago
TRUMP Price Turns Bearish After 72% Crash From All-Time High
-
 Altcoin11 hours ago
Why Are Dogecoin and Shiba Inu Price Crashing Over 25% Today?
-

 Market10 hours ago
Dogecoin (DOGE) Plunges to $0.20: Is This the Bottom or More Pain Ahead?
-

 Altcoin14 hours ago
Analyst Says Dogecoin Is Yet To Complete 5th Wave, Here’s How High It Must Go
-

 Market13 hours ago
What’s Next After the Major Decline?
-

 Market12 hours ago
XRP Price Crashes Hard: Is There a Recovery in Sight?