
Bitcoin
US Economic Data to Watch: Bitcoin Volatility Expected

Crypto market participants have a lot to look forward to this week, with 5 US economic data due for release starting Tuesday. The market is already abuzz, anticipating the implication of these events on Bitcoin (BTC) and crypto markets in general.
The influence of US macro data on Bitcoin continues to remain apparent after a period of dissipated or dried-up effect in 2023.
Consumer Confidence
The first US economic event with crypto implications this week is the consumer confidence survey on Tuesday, January 28. This survey reflects likely spending trends, showcasing consumer attitudes, buying intentions, and vacation plans, among other things.
There is a median forecast of 106.3 after the previous 104.7. Enhanced consumer confidence would suggest that people are open to spending more money, hence increasing economic activity. This would potentially drive more investments into cryptocurrencies like Bitcoin.
Conversely, a pullback in consumer confidence could lead to decreased spending and investment. It would support a more dovish path for the Federal Reserve (Fed), leading to increased liquidity in the financial system.
This may be favorable for Bitcoin as investors seek alternative stores of value and hedges against inflation. Therefore, the Tuesday data will be important for crypto markets, measuring how optimistic or pessimistic consumers are about the overall state of the economy.
FOMC and Fed Chair’s Speech
Beyond consumer confidence, crypto markets are also watching the Federal Open Market Committee (FOMC) interest rate decision on Wednesday, January 29. It marks the first FOMC decision after President Donald Trump took office, making it an interesting watch.
“Trump is demanding rate cuts, but Powell’s signaling no change. This showdown could rock the markets,” crypto trader Roger Smith quipped.
Policymakers recently expressed concerns about inflationary pressures, particularly tied to Trump’s proposed fiscal policies. During their last meeting, FOMC minutes provided little indication of a potential rate cut in the near term, further solidifying the Fed’s hawkish stance. As BeInCrypto reported, this stance exerted downward pressure on risk assets, including cryptocurrencies.
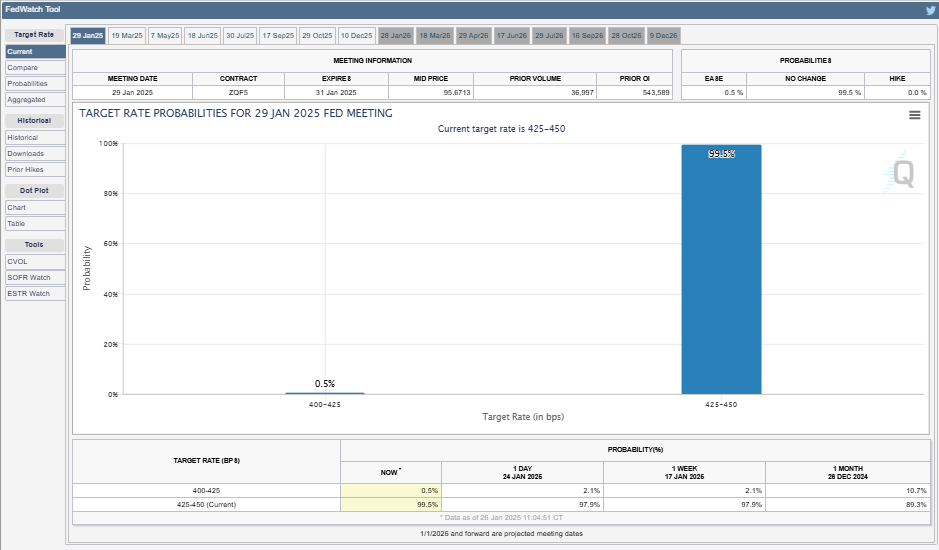
Against this backdrop, the CME FedWatch tool shows a 99.5% probability of a 25-basis-point (0.5% bps) rate cut. As this would signify a no rate change, the focus will be on the press conference with Fed Chair Jerome Powell. With these, traders and investors are expecting higher volatility amid market-moving insights from the Fed chair.
“I’ll decide that after Wednesday, January 29, 2024, FOMC interest-rate decision 2:00 pm ET – Fed Chair Powell press conference 2:30 pm ET. No position at the moment but I see a small chance for positive,” one trader said.
Noteworthy, the Fed has a dual mandate — to keep the Consumer Price Index (CPI), a measure of inflation, increasing by 2% per year and to maintain full employment in the economy.
GDP
The US GDP (Gross Domestic Data) report will be out on Thursday, January 30, adding to the list of US economic data to watch this week. The median forecast is 2.5% after the previous reading of 3.1%. This data measures the total value of goods and services produced in a country.
A positive GDP revision could signal a strong and growing economy. This would prompt investors to allocate more capital towards riskier assets such as Bitcoin and cryptocurrencies. Conversely, a downward revision may lead to a shift in investor sentiment, resulting in a temporary decline in crypto prices.
Initial Jobless Claims
Crypto markets will also be keen on the initial jobless claims report on Thursday, which will provide insight into the health of the US labor market. Notably, the number of Americans filing new applications for unemployment benefits recently ticked up. However, it appeared to be steadying near a level consistent with a gradual cooling of the labor market. This is what set the stage for the Fed’s openness to rate cuts.
The previous data came in at 223,000, with a current middle projection of 225,000. A higher-than-expected number of jobless claims could indicate economic instability and uncertainty. In turn, this would lead investors to seek alternative assets like Bitcoin as a form of hedging against traditional markets.
On the other hand, a decrease in jobless claims could boost investor confidence in traditional markets, potentially diverting funds away from cryptocurrencies. Fed officials are also keen on the labor market, cognizant of the risks that come with waiting too long to cut rates.
Personal Income and PCE Index
The US Bureau of Economic Analysis (BEA) will release the personal income, spending, PCE index, and core PCE on Friday. Weaker personal income and spending, coupled with softer inflation figures, could signal a slowdown in economic activity.
In response to this, the Federal Reserve may consider pausing interest rates to stimulate borrowing and spending and boost economic growth.
Meanwhile, the Personal Consumption Expenditures (PCE) index, excluding volatile food and energy prices, will be a key indicator of inflation. A higher-than-expected core PCE index could indicate rising inflationary pressures.
This would prompt investors to diversify their portfolios by investing in assets like Bitcoin, which is seen as a hedge against inflation. Conversely, a lower core PCE index could lead to a decrease in demand for cryptocurrencies as investors flock to more stable investment options.
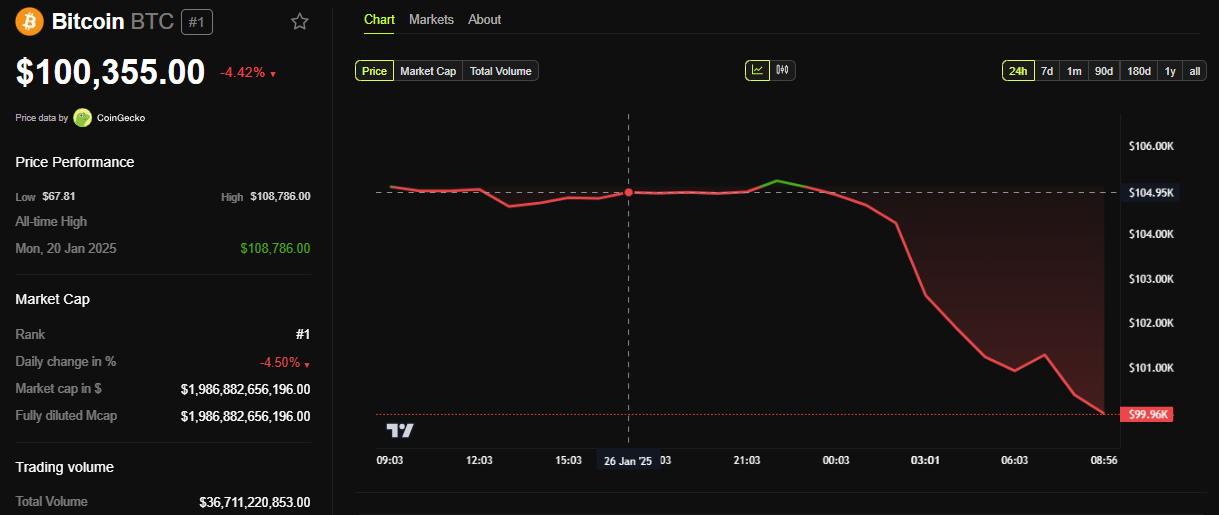
Ahead of these US economic events, BeInCrypto data shows BTC was trading for $100,355, down almost 5% since Monday’s session opened.
Disclaimer
In adherence to the Trust Project guidelines, BeInCrypto is committed to unbiased, transparent reporting. This news article aims to provide accurate, timely information. However, readers are advised to verify facts independently and consult with a professional before making any decisions based on this content. Please note that our Terms and Conditions, Privacy Policy, and Disclaimers have been updated.


Bitcoin has produced a range-bound movement recently, with prices oscillating between $83,000 and 86,000. Interestingly, popular crypto analyst Burak Kesmeci has identified the important price levels for any short-term action.
Support At 82,800, Resistance At 92,000 – But Where Is Bitcoin Headed?
In a new post on X, Kesmeci shared an interesting on-chain analysis of the Bitcoin market. Using the short-term investor cost basis, the analyst identified two key price levels that could prove critical to Bitcoin’s next major move.
Firstly, Burak Kesmeci focuses on the average cost prices of new traders over the past 1-4 weeks, which are likely the most reactive to price changes. The realized price for these traders currently stands at $82,800, forming a near-term support that indicates many recent buyers are still in profit and may defend this level as a psychological floor.
Meanwhile, Kesmeci also highlights the $92,000 price level, which marks the average cost basis for BTC holders for 1-3 months. This price point has emerged as an important resistance zone, as investors are likely to exit the market once they break even. Furthermore, the $92,000 price level is also marked by a confluence with various technical indicators.
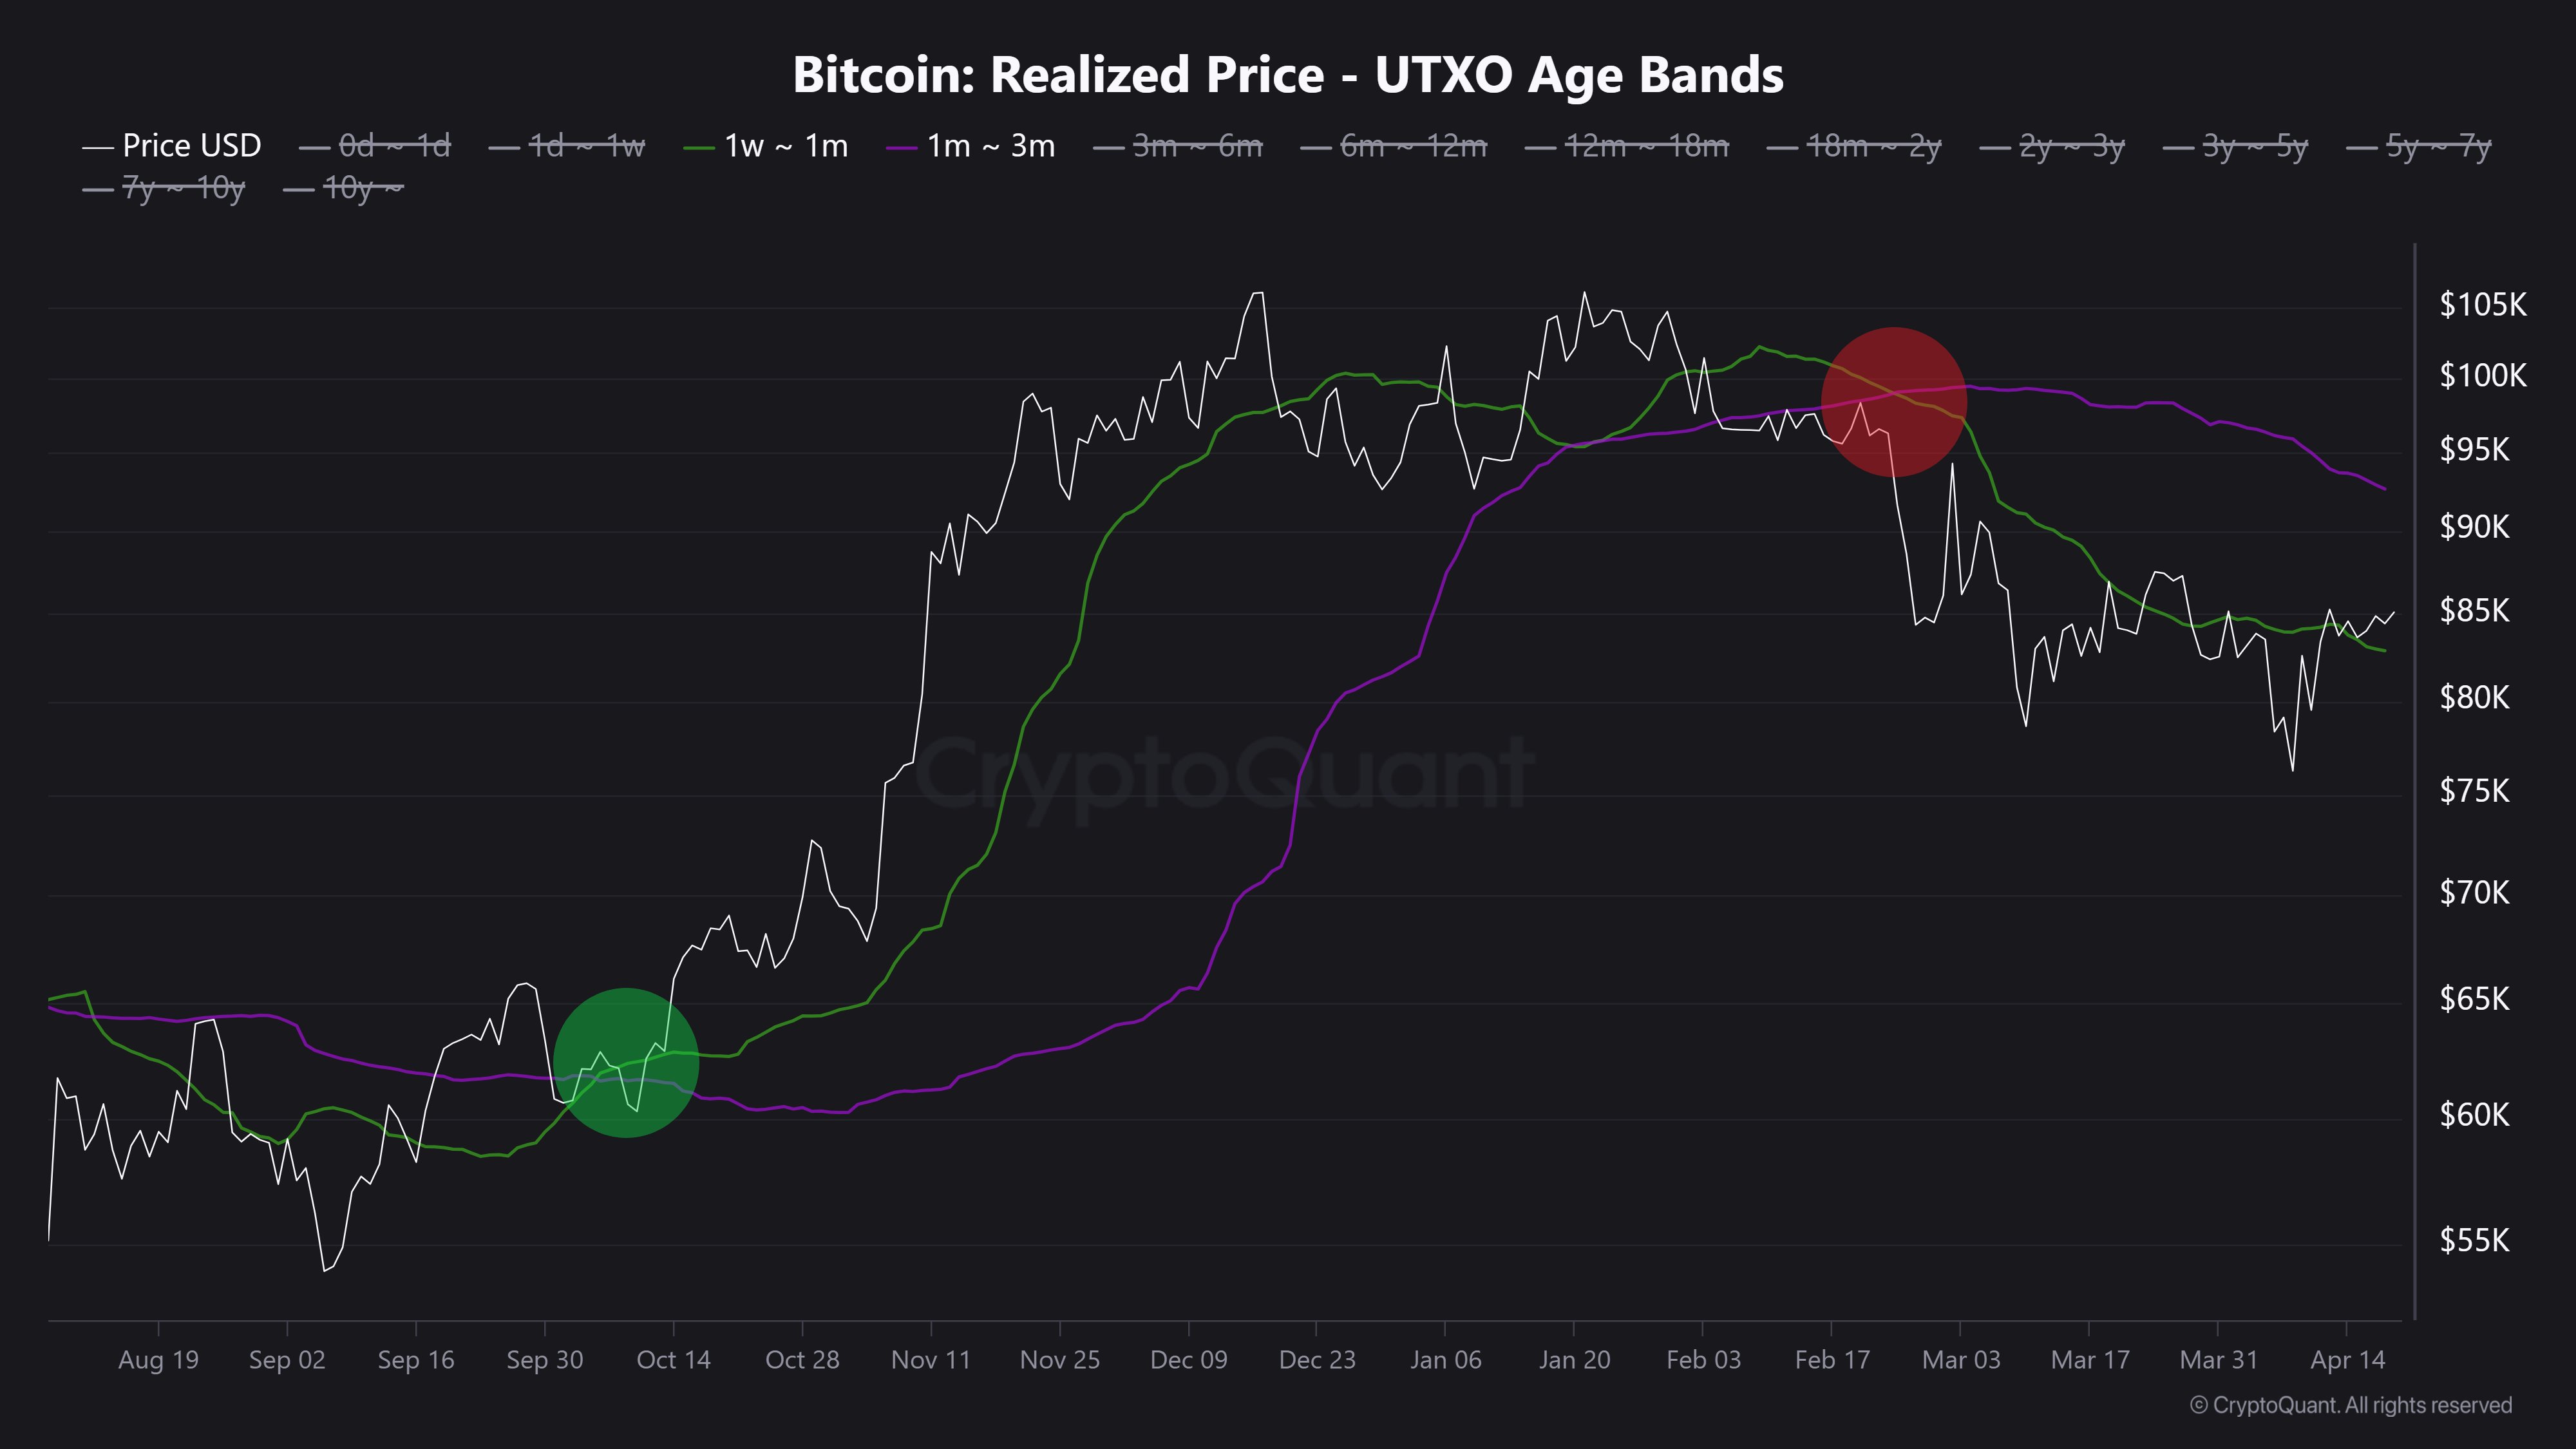
The interplay between these two levels is significant. Historically, short-term bullish trends in BTC tend to begin when the cost basis of more recent investors, 1–4 weeks, crosses above that of the 1–3 BTC holders. This shift signals increased confidence and willingness to buy at higher levels, which often fuels broader rallies.
However, that dynamic remains to play out in the current market. As of now, Bitcoin is trading around 85,000, positioning it above its support at the 1–4 week average of $82,800 but still below the 1–3 month resistance of $92,000. Furthermore, both cost basis levels have been declining over the past two months, reflecting hesitation or a lack of aggressive buying from new entrants.
Notably, Kesmeci states that BTC must surge above $92,000 to confirm a strong bullish momentum for a price reversal.
Bitcoin ETFs Offload 1,725 BTC
In other news, Ali Martinez reports that the Bitcoin ETFs have suffered withdrawals of 1,725 Bitcoin, valued at $146.92 million, over the past week. This development illustrates a high level of negative sentiment among institutional investors, adding to market uncertainty around the BTC market.
Meanwhile, Bitcoin trades at $85,249 following a price change of 0.89% in the past day. The premier cryptocurrency also reflects a 0.58% loss on the weekly chart and a 1.06% gain on a monthly chart.
Feature image from Adobe Stock, chart from Tradingview
Editorial Process for bitcoinist is centered on delivering thoroughly researched, accurate, and unbiased content. We uphold strict sourcing standards, and each page undergoes diligent review by our team of top technology experts and seasoned editors. This process ensures the integrity, relevance, and value of our content for our readers.

Following an extensive price correction in the past three months, the Bitcoin bull market continues to hang in the balance. Despite a modest price rebound in April, the premier cryptocurrency is yet to display a strong intent to resume its bull rally amidst a lack of positive market factors. However, crypto analyst Axel Adler Jr. has highlighted a promising development that could signal major upside potential for Bitcoin.
Bitcoin Long-Term Holders Looking To Halt Selling Pressure
In a recent post on X, Adler Jr. shared an important update in Bitcoin long-term holders (LTH) activity, which could prove significantly positive for the broader BTC market.
Using on-chain data from CryptoQuant, the renowned analyst reports that selling pressure by long-term holders, i.e. amount of LTH holdings on exchanges, has now hit its lowest point at 1.1% over the past year. This development indicates that Bitcoin LTH are now opting to hold on to their assets rather than take profits.
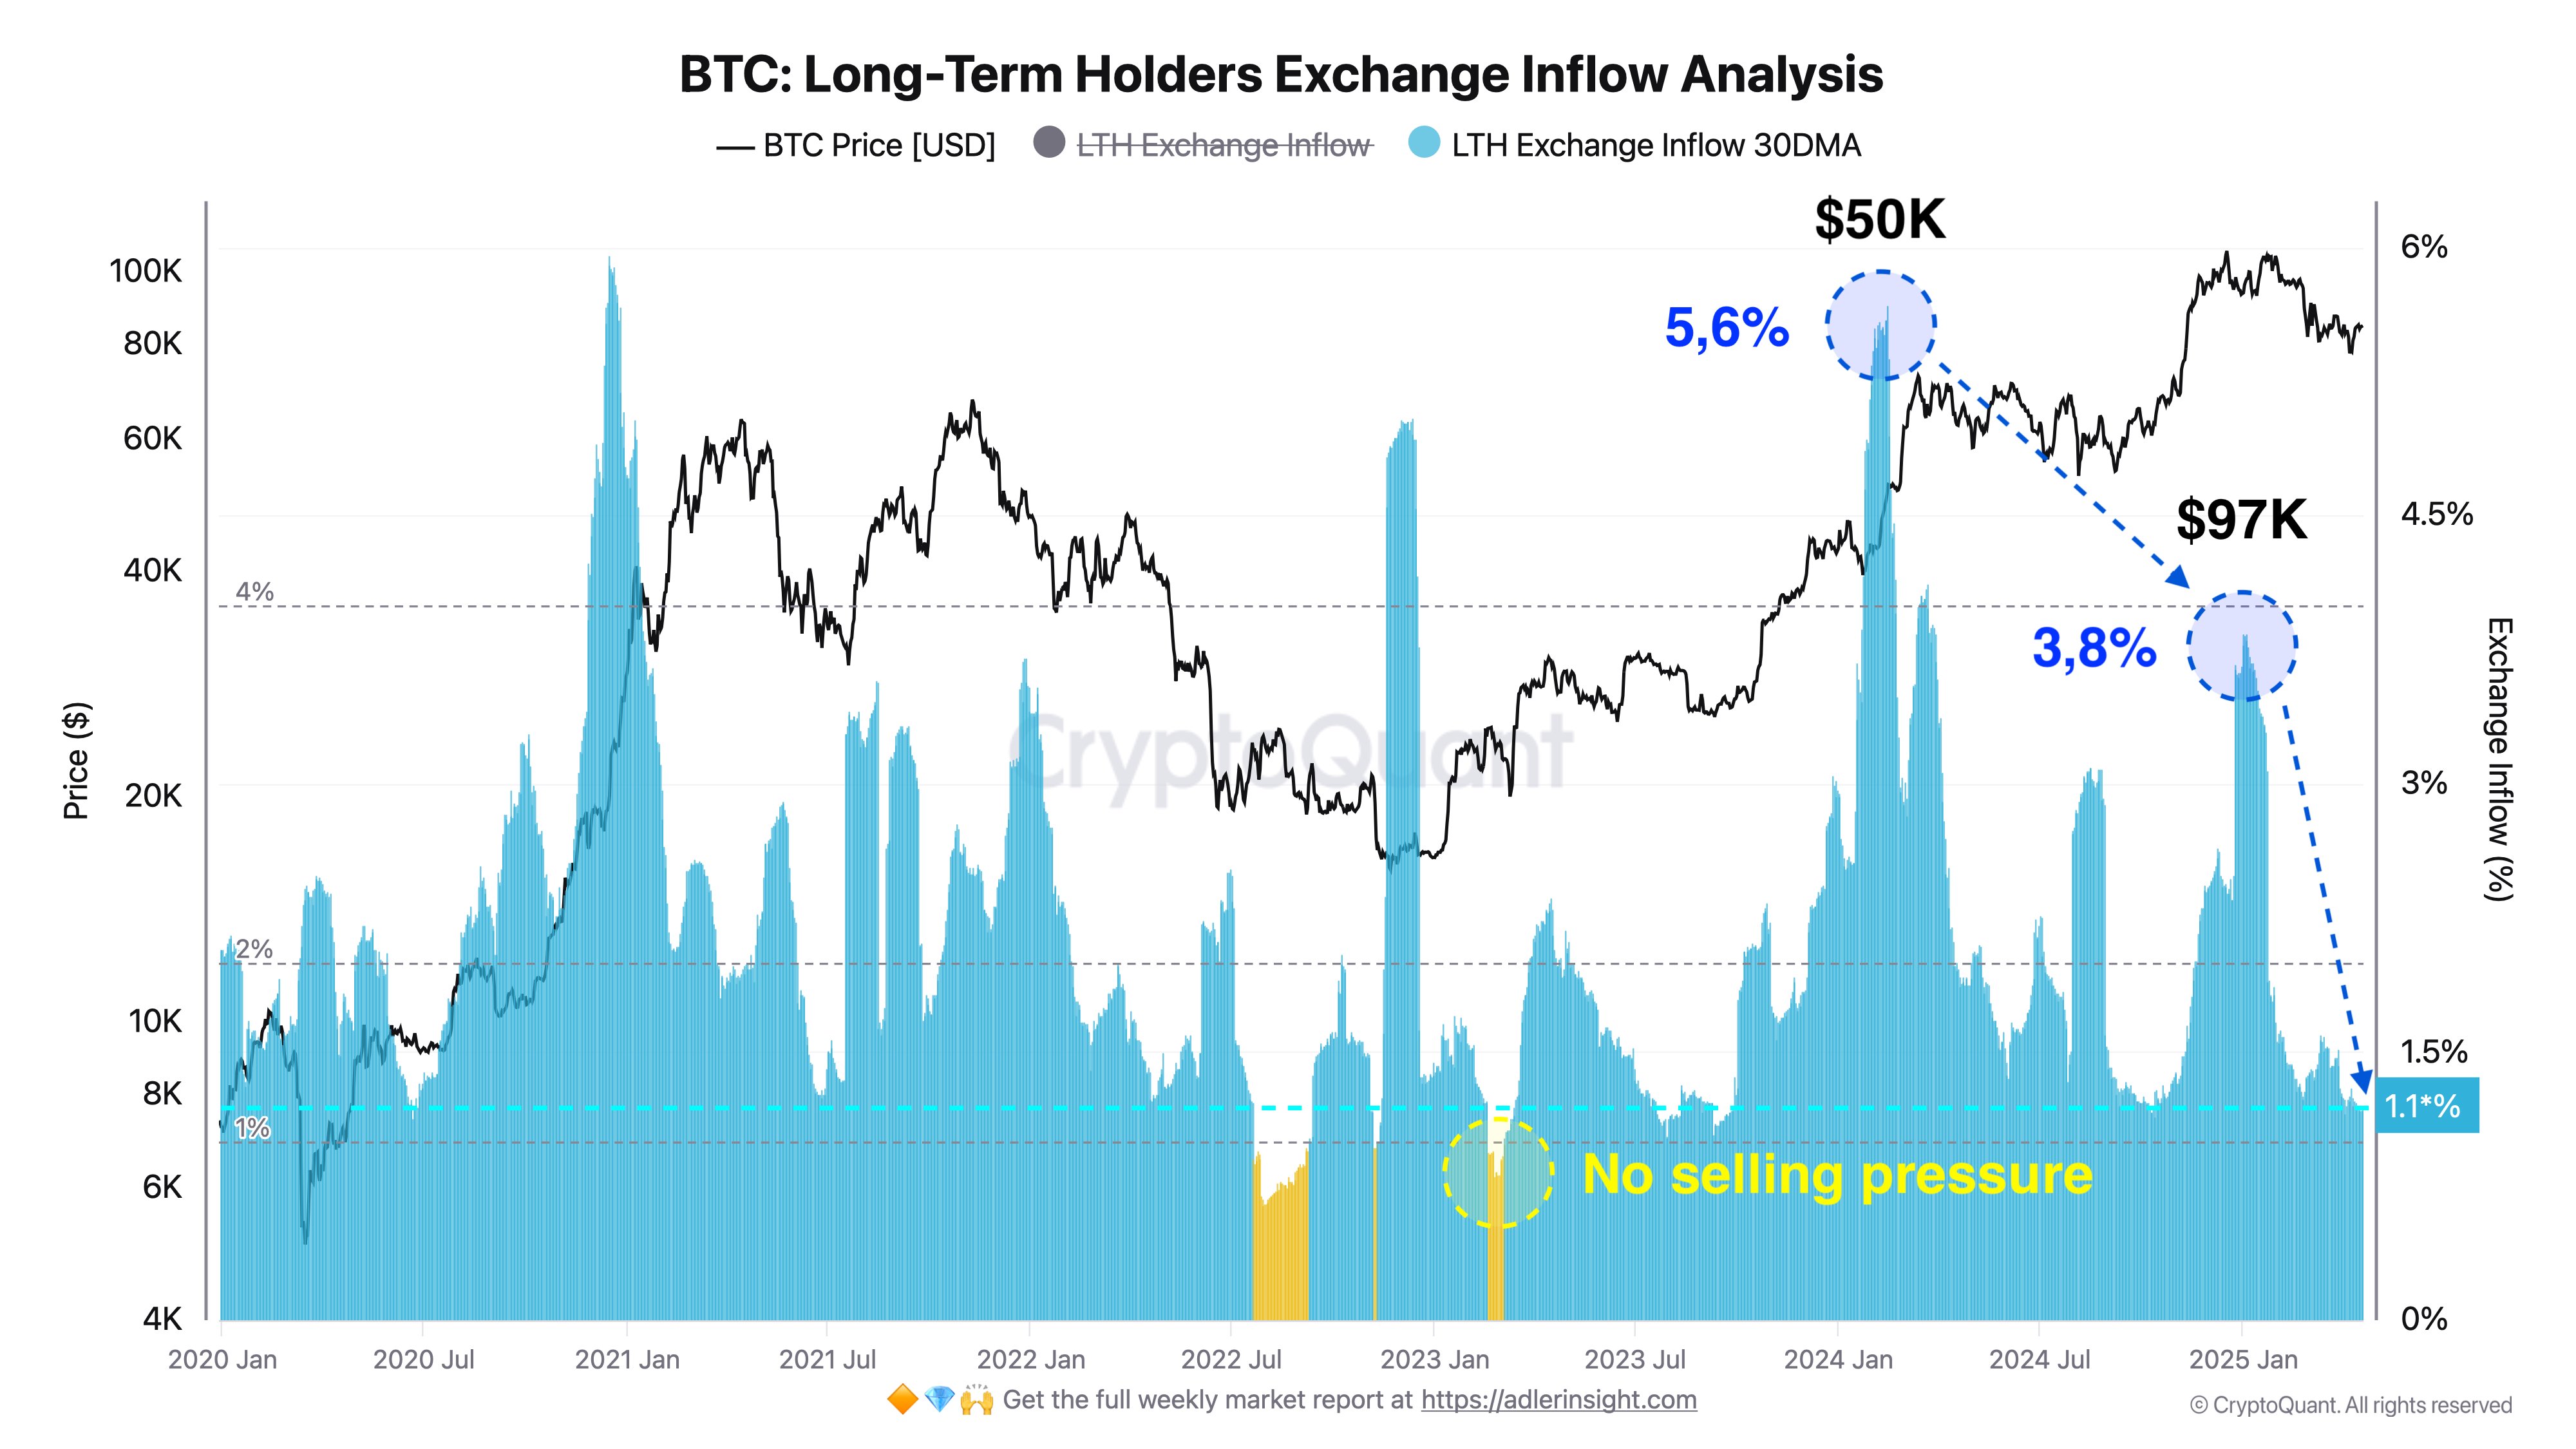
Adler explains that a further decline in these LTH exchange holdings to 1.0% would signal the total absence of selling pressure. Notably, this development could encourage new market entry and sustained accumulation, creating a strong bullish momentum in the BTC market.
Importantly, Alder highlights that the majority of the Bitcoin LTH entered the market at an average price of $25,000, Since then, CryptoQuant has recorded the highest LTH selling pressure of 5.6% at $50,000 in early 2024 and 3.8% at $97,000 in early 2025.
According to Adler, these two instances likely represent the primary profit-taking phases for long-term holders who intended to exit the market. Therefore, a resurgence in selling pressure from this cohort of BTC investors is unlikely in the short-term, which supports a building bullish case as long-term holders currently control 77.5% of Bitcoin in circulation.
BTC Price Overview
At the time of writing, Bitcoin was trading at $85,226 following a 0.36% gain in the past day and a 0.02% loss in the past week. Both metrics only reflect the ongoing market consolidation as BTC continues to struggle to achieve a convincing price breakout beyond $86,000.
Meanwhile, the asset’s performance on the monthly chat now reflects a 1.97% gain, indicating a potential trend reversal as the market correction ceases. Nevertheless, BTC remains in need of a strong market catalyst to ignite any sustainable price rally. With a market cap of $1.67 trillion, Bitcoin is ranked as the largest digital asset, controlling 62.9% of the crypto market.
Featured image from Adobe Stock, chart from Tradingview
Editorial Process for bitcoinist is centered on delivering thoroughly researched, accurate, and unbiased content. We uphold strict sourcing standards, and each page undergoes diligent review by our team of top technology experts and seasoned editors. This process ensures the integrity, relevance, and value of our content for our readers.

The Bitcoin price seems stuck in a consolidation range, ricocheting off the $83,000 and $86,000 levels over the past week. With no clear direction for the premier cryptocurrency, investors are left wondering what phase the market cycle is in—bullish or bearish.
According to a popular crypto analyst on the social media platform X, the Bitcoin price could be preparing for its next big move in either direction over the next few weeks. In any case, here are the important levels to watch out for in the next few days.
Crucial Levels To Watch For BTC’s Next Move
In an April 19 post on the X platform, crypto analyst Ali Martinez shared an interesting analysis of the Bitcoin price while highlighting the current layout of the world’s largest cryptocurrency by market cap. The online pundit noted that BTC bears and bulls are locked in a battle, leading to a choppy market condition.
Notably, the premier cryptocurrency appears to have entered the $83,000 – $86,000 range on Saturday, April 12. Hence, Martinez’s analysis basically revolves around the price of BTC bouncing off the support and resistance levels on its one-hour timeframe.

Source: @ali_charts on X
As shown in the chart above, the Bitcoin price attempted multiple times to breach the resistance zone around the $86,000 region over the past week. However, the bulls’ optimism was met with the staunch resilience of the Bitcoin bears, as the price of BTC almost always found its way back toward the $83,000 mark.
Most recently, the flagship cryptocurrency made its way toward the $86,000 level on Wednesday, April 16, but failed to break the significant resistance zone after the US Federal Reserve (Fed) chair Jerome Powell suggested that interest rate cuts might not be coming as early as anticipated by crypto traders.
Martinez noted in his post that the next significant move for the Bitcoin price depends primarily on the $83,000 and $86,000 levels. According to the crypto pundit, a breakout above the $86,000 mark could spell the start of a bullish run for Bitcoin, while a break below $83,000 could mean further correction for the market leader.
Bitcoin Price Overview
After reaching its all-time high of $108,786 in January 2025, the price of BTC has been on a steady decline in the past few months. According to data from CoinGecko, the flagship cryptocurrency has losst more than 22% of its value since hitting its record-high price.
As of this writing, the price of Bitcoin stands at around $84,530, reflecting a 0.3% decline in the past 24 hours. Meanwhile, the Bitcoin price is up by more than 1% on the weekly timeframe.
The price of BTC on the daily timeframe | Source: BTCUSDT chart on TradingView
Featured image from iStock, chart from TradingView
Editorial Process for bitcoinist is centered on delivering thoroughly researched, accurate, and unbiased content. We uphold strict sourcing standards, and each page undergoes diligent review by our team of top technology experts and seasoned editors. This process ensures the integrity, relevance, and value of our content for our readers.

Solana Rallies Past Bitcoin—Momentum Tilts In Favor of SOL

Expert Says Solana Price To $2,000 Is Within Reach, Here’s How

Bitcoin Price Breakout In Progress—Momentum Builds Above Resistance

Here Are The Bitcoin Levels To Watch For The Short Term

Bitcoin LTH Selling Pressure Hits Yearly Low — Bull Market Ready For Take Off?

Will XRP Break Support and Drop Below $2?

2.52 Million Altcoins Are Ruining Crypto’s Future

Animoca Brands Valuation Tanks 75% In Two Years, Here’s Why

Crypto exchange BingX hacked for $43 million

Are The Big Players Losing Interest?

Hong Kong’s Securities Association Tips Authorities On Crypto Self-Regulation

Coinbase cbBTC Set to go Live on Solana
2.52 Million Altcoins Are Ruining Crypto’s Future
Animoca Brands Valuation Tanks 75% In Two Years, Here’s Why
Crypto exchange BingX hacked for $43 million
Are The Big Players Losing Interest?
Hong Kong’s Securities Association Tips Authorities On Crypto Self-Regulation
Coinbase cbBTC Set to go Live on Solana
-
 Altcoin24 hours ago
Uniswap Founder Urges Ethereum To Pursue Layer 2 Scaling To Compete With Solana
-

 Ethereum20 hours ago
Ethereum Consolidates In Symmetrical Triangle: Expert Predicts 17% Price Move
-

 Market20 hours ago
Today’s $1K XRP Bag May Become Tomorrow’s Jackpot, Crypto Founder Says
-
 Market14 hours ago
1 Year After Bitcoin Halving: What’s Different This Time?
-

 Market18 hours ago
MELANIA Crashes to All-Time Low Amid Insiders Continued Sales
-
 Altcoin23 hours ago
What’s Up With BTC, XRP, ETH?
-

 Market19 hours ago
Charles Schwab Plans Spot Crypto Trading Rollout in 2026
-

 Ethereum22 hours ago
Ethereum Accumulators At A Crucial Moment: ETH Realized Price Tests Make-Or-Break Point