Market
Ethereum Bears Emerge: Is a Deeper Pullback Coming?

Ethereum price is struggling below the $3,400 resistance. ETH is showing a few bearish signs and might decline below the $3,150 support.
- Ethereum failed to gain pace for a close above $3,350 and $3,400.
- The price is trading below $3,300 and the 100-hourly Simple Moving Average.
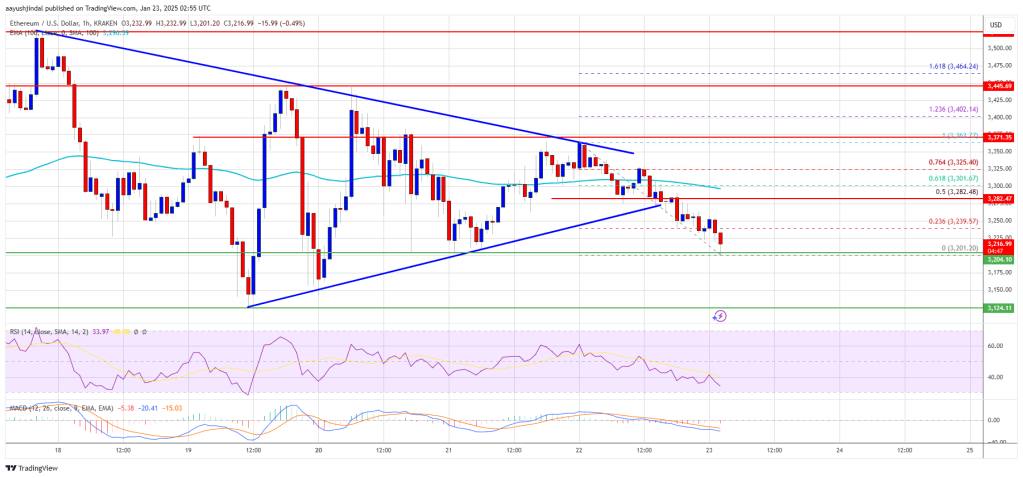
- There was a break below a key contracting triangle with support at $3,270 on the hourly chart of ETH/USD (data feed via Kraken).
- The pair could start another increase if it stays above the $3,120 support level.
Ethereum Price Breaks Support
Ethereum price started a decent upward move from the $3,220 level but upsides were limited compared to Bitcoin. ETH cleared the $3,300 resistance before the bears appeared.
A high was formed at $3,361 and the price is now moving lower. There was a move below the $3,250 and $3,220 support levels. Besides, there was a break below a key contracting triangle with support at $3,270 on the hourly chart of ETH/USD.
A low was formed at $3,201 and the price is now consolidating. Ethereum price is now trading below $3,300 and the 100-hourly Simple Moving Average. On the upside, the price seems to be facing hurdles near the $3,280 level or the 50% Fib retracement level of the downward move from the $3,363 swing high to the $3,201 low.
The first major resistance is near the $3,300 level or the 61.8% Fib retracement level of the downward move from the $3,363 swing high to the $3,201 low. The main resistance is now forming near $3,350.
A clear move above the $3,350 resistance might send the price toward the $3,450 resistance. An upside break above the $3,450 resistance might call for more gains in the coming sessions. In the stated case, Ether could rise toward the $3,550 resistance zone or even $3,580 in the near term.
More Losses In ETH?
If Ethereum fails to clear the $3,300 resistance, it could start another decline. Initial support on the downside is near the $3,200 level. The first major support sits near the $3,150.
A clear move below the $3,150 support might push the price toward the $3,120 support. Any more losses might send the price toward the $3,050 support level in the near term. The next key support sits at $3,000.
Technical Indicators
Hourly MACD – The MACD for ETH/USD is gaining momentum in the bearish zone.
Hourly RSI – The RSI for ETH/USD is now below the 50 zone.
Major Support Level – $3,200
Major Resistance Level – $3,300
Market
Top 10 Crypto CEXs See $6.4 Trillion Trading Volume in Q4 2024

According to a CoinGecko report, in Q4 2024, the overall trading volume of the top 10 crypto centralized exchanges (CEX) surged, with eight of them recording triple-digit percentage growth.
It was also found that the total trading volume for the top 10 exchanges in Q4 was $6.4 trillion, a 111.7% increase from the previous quarter.
Binance Maintains Dominance as Top CEX, Despite Declining Market Share
At the close of 2024, Binance remained the clear leader in the market, maintaining a dominant market share of 34.7%.
The CoinGecko report showed that in December alone, the exchange recorded a substantial spot trading volume of $1.0 trillion. This marked a slight increase of 2.3% from November’s $979.1 billion.
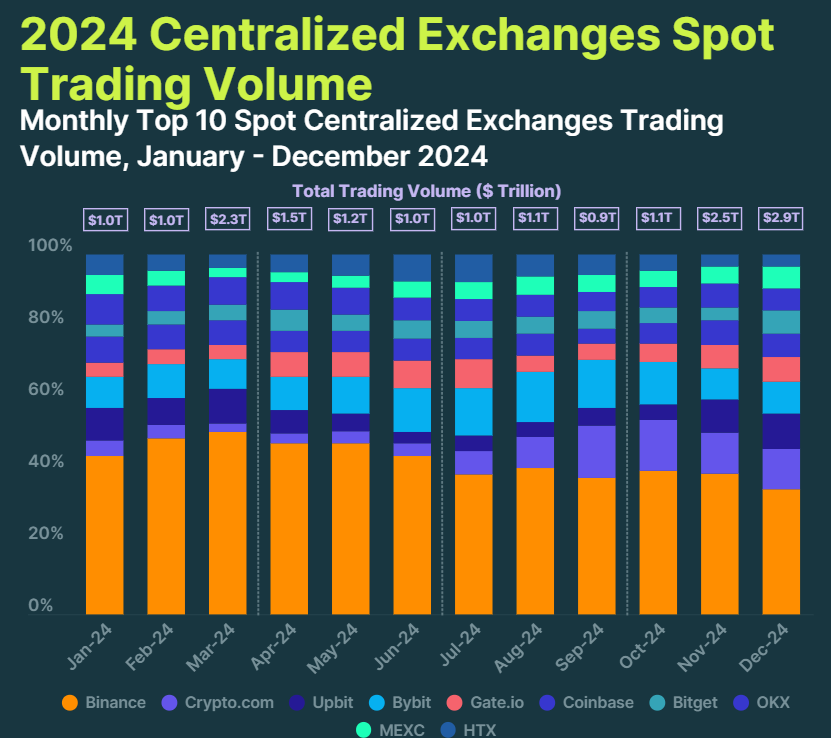
The achievement marked Binance’s second $1 trillion volume month in 2024. Over the course of the year, Binance’s dominance was even more pronounced, capturing 42.4% of the total volume among the top 10 exchanges, with $7.4 trillion traded compared to the $17.4 trillion in total volume for the group.
Despite its dominance, Binance has experienced a gradual loss of market share in 2024. Starting the year with a 44.1% share, it has seen a decline in its portion of the market since September, dipping below 40%.
“However, it is still the largest exchange by a large margin. For comparison, it had more trading volume than the next five largest exchanges combined in 2024 ($7.4 trillion vs. $6.6 trillion),” CoinGecko said.
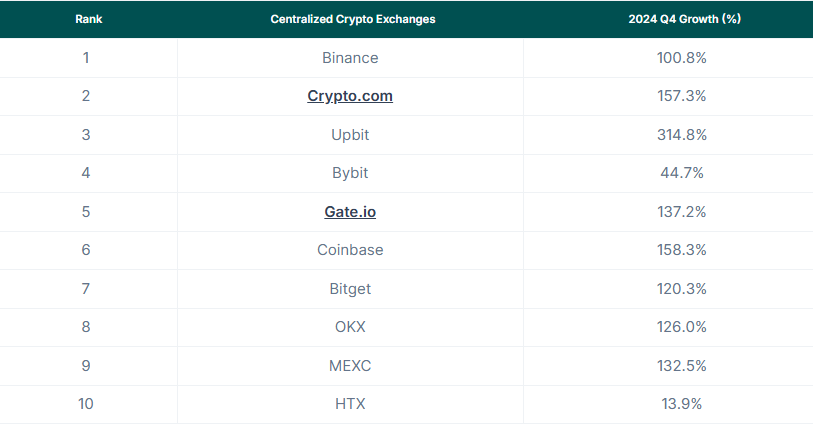
Crypto.com emerged as the second-largest exchange by trading volume in December. It had an 11.2% market share and $322.3 billion in trading volume. This represents a significant increase of 12.7% from the previous month.
In Q4 2024, Crypto.com saw a sharp increase in volume. The volumes rose from $539.8 billion in the first three quarters of the year to $757.8 billion in the final quarter.
Upbit, which reclaimed its spot as the third-largest exchange in November 2024, continued its upward trajectory into December. The exchange recorded $282.7 billion in spot trading volume for the month, a notable 22% growth from November.
Upbit’s performance in Q4 was driven by a dramatic surge in volume following the declaration of martial law in South Korea on December 3. This led to a six-fold increase in daily volumes, reaching an average of $21 billion per day.
Disclaimer
In adherence to the Trust Project guidelines, BeInCrypto is committed to unbiased, transparent reporting. This news article aims to provide accurate, timely information. However, readers are advised to verify facts independently and consult with a professional before making any decisions based on this content. Please note that our Terms and Conditions, Privacy Policy, and Disclaimers have been updated.
Market
Cathie Wood Doubts TRUMP Meme Coin’s Utility

ARK Invest CEO and CIO Cathie Wood recently expressed skepticism regarding the utility of the TRUMP meme coin, a new cryptocurrency associated with US President Donald Trump.
In an interview with Bloomberg TV, Wood noted that her firm has generally avoided investing in meme coins.
Cathie Wood Labels TRUMP Coin Part of the “Meme Coin Moment”
Wood drew parallels to the 2017 ICO movement, which was started by CryptoKitties. Therefore, she categorized TRUMP as part of the current “meme coin moment.” Nevertheless, TRUMP’s utility remained uncertain, according to her.
“So far, we don’t know of much utility for this coin, except that it is a meme point of President Trump himself,” Wood admitted.
She also addressed speculations surrounding the meme coin, noting that one of its rumored utilities is said to be the opportunity to meet the President. However, Wood expressed uncertainty about the validity of such claims.
“I think he’s ushering in the next phase of the crypto revolution,” she added.
When asked about investing in the Trump coin or other meme coins, the CEO clarified that ARK Invest has largely avoided meme coins, instead prioritizing cryptocurrencies with significant utility and potential.
She highlighted Bitcoin (BTC), Ethereum (ETH), and Solana (SOL) as their primary focus areas, noting that Bitcoin is central to their strategy, with ARKB being one of the larger Bitcoin ETFs.
Wood also emphasized that Ethereum and Solana play key roles in their private funds due to their importance in supporting decentralized financial services, often referred to as DeFi or “finternet,” which she believes will drive substantial innovation in the crypto space.
“Those we believe are the big three,” the CEO remarked.
However, TRUMP has also gained significant market traction, despite being a new entrant. It boasts a market capitalization of $7.42 billion, securing its spot as the 29th largest cryptocurrency and the third largest meme coin by market cap.

This rapid ascent has also attracted institutional attention. Rex Shares, for instance, has filed for meme coin ETFs that include TRUMP alongside other meme tokens like BONK and DOGE.
Interestingly, President Trump has admitted to limited knowledge about the TRUMP meme coin. During a recent White House press conference, he acknowledged his unfamiliarity with the cryptocurrency bearing his name.
Meanwhile, TRUMP isn’t the President’s only venture into the cryptocurrency space. In 2024, he also launched World Liberty Financial (WLF), a decentralized finance (DeFi) protocol.
Nonetheless, his involvement with the crypto space has drawn significant scrutiny. Notably, US Representative Gerald Connolly has called for an investigation into Trump’s financial ties to crypto ventures, including World Liberty Financial.
Disclaimer
In adherence to the Trust Project guidelines, BeInCrypto is committed to unbiased, transparent reporting. This news article aims to provide accurate, timely information. However, readers are advised to verify facts independently and consult with a professional before making any decisions based on this content. Please note that our Terms and Conditions, Privacy Policy, and Disclaimers have been updated.
Market
Is XRP Price Rally Sustainable as Data Suggests Overvaluation?

XRP has witnessed a notable rally in the past week, climbing by 35%. The altcoin currently trades at $3.10, slightly below its all-time high of $3.41.
However, on-chain data suggests the token may be overvalued at its current price point. This raises concerns about its ability to break above its all-time high (ATH) as profit-taking straightens among traders.
XRP’s Overvalued Status Could Trigger More Selloffs
XRP’s market value to realized value (MVRV) ratio highlights its overvalued status, standing at 409.47% at press time, according to Santiment data.
The MVRV ratio evaluates whether an asset is overvalued or undervalued by comparing its market value to its realized value. A positive ratio indicates the market value exceeds the realized value, suggesting overvaluation. Conversely, a negative ratio means the market value is below the realized value, indicating the asset is undervalued compared to its original purchase price.
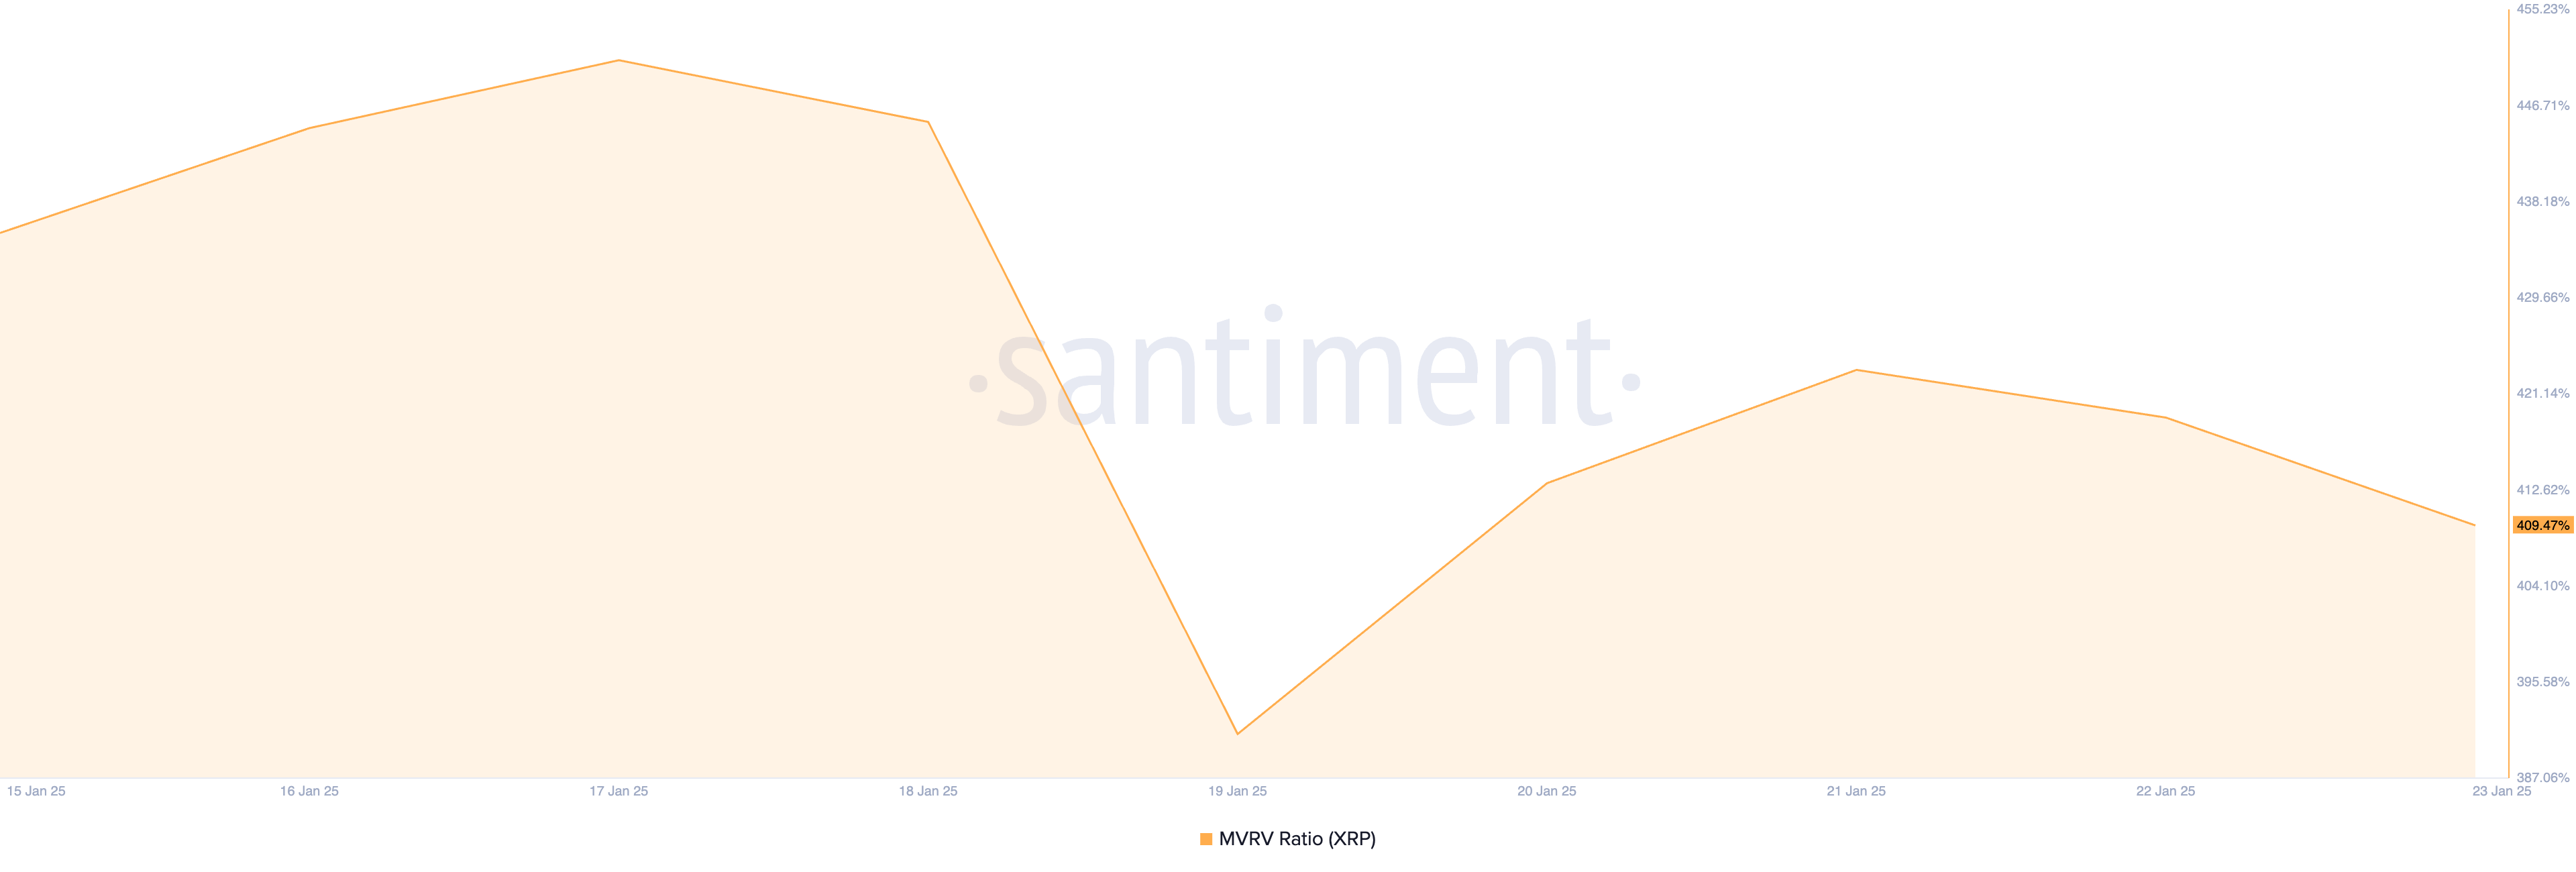
At 409.47%, XRP’s MVRV ratio shows that its market value is 409% higher than its realized value — the price at which tokens were last moved or acquired. In simpler terms, this means that, on average, investors who purchased XRP are seeing a 409% profit compared to their initial purchase price. This could prompt increased selling pressure.
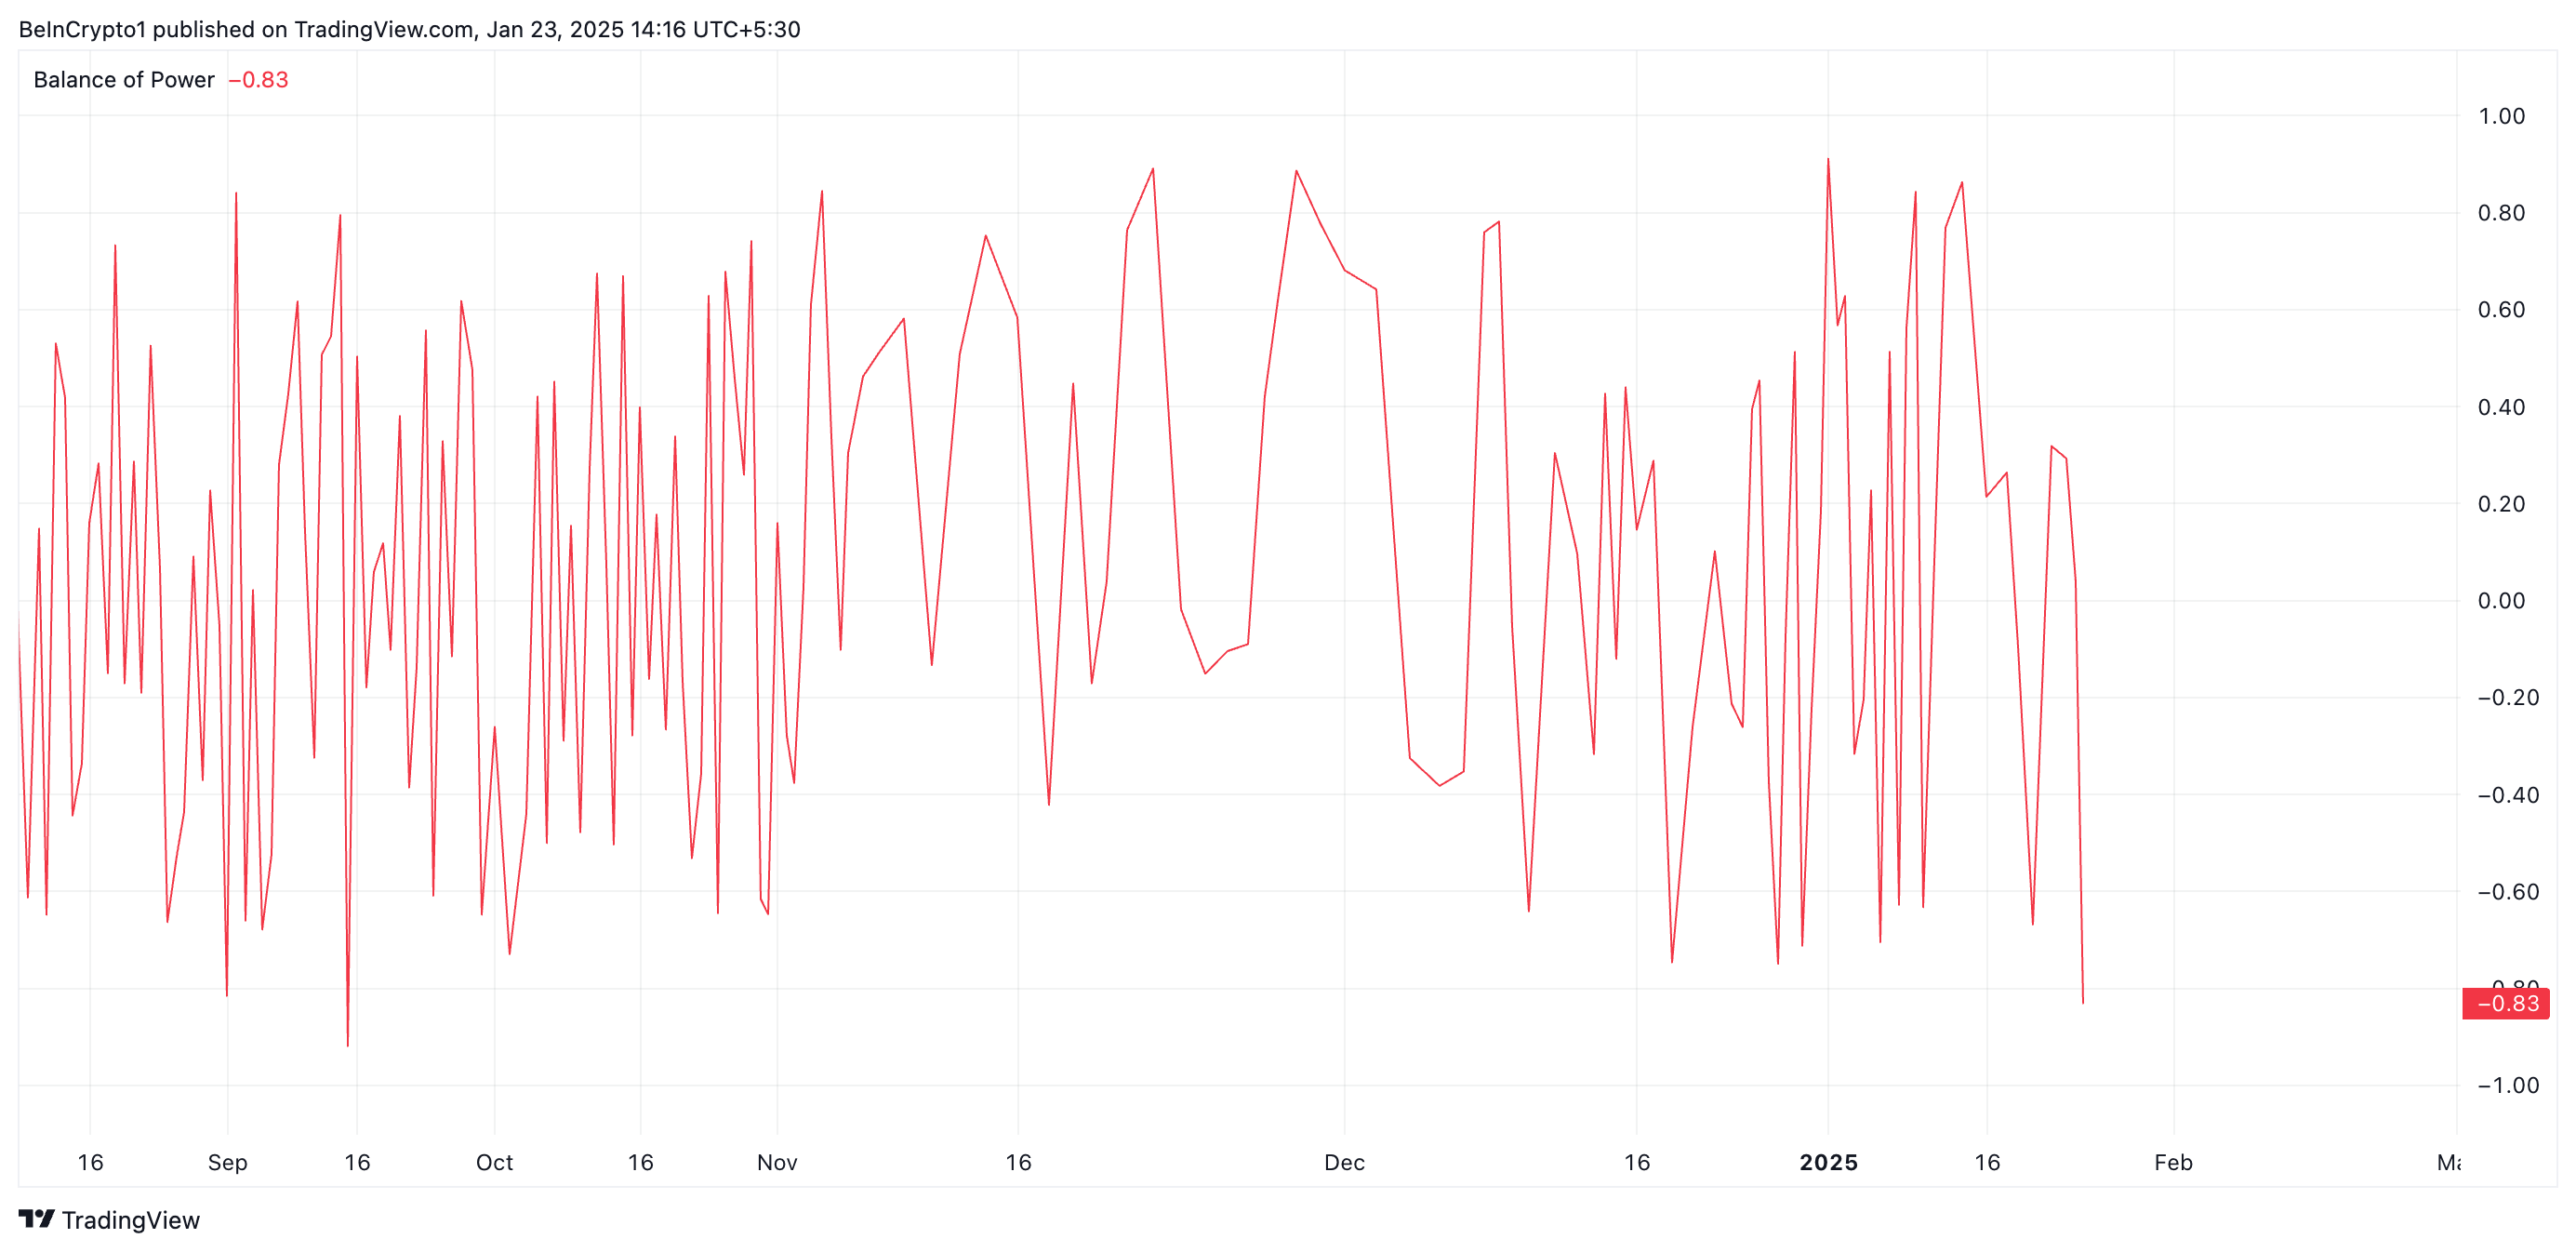
Notably, XRP’s negative Balance of Power (BoP) confirms that this profit-taking is already underway. At press time, this sits at -0.83.
The BoP measures the relative strength of buying versus selling pressure in the market. When the BoP is negative, it indicates that selling pressure outweighs buying. It suggests that more investors are looking to liquidate their positions than to accumulate, which could lead to downward price movement.
XRP Price Prediction: Selling Momentum Threatens to Push Price Lower
As selling activity gains momentum, XRP’s price will fall further from its all-time high. According to readings from its Fibonacci Retracement tool, the altcoin’s price could drop to support at $2.45.
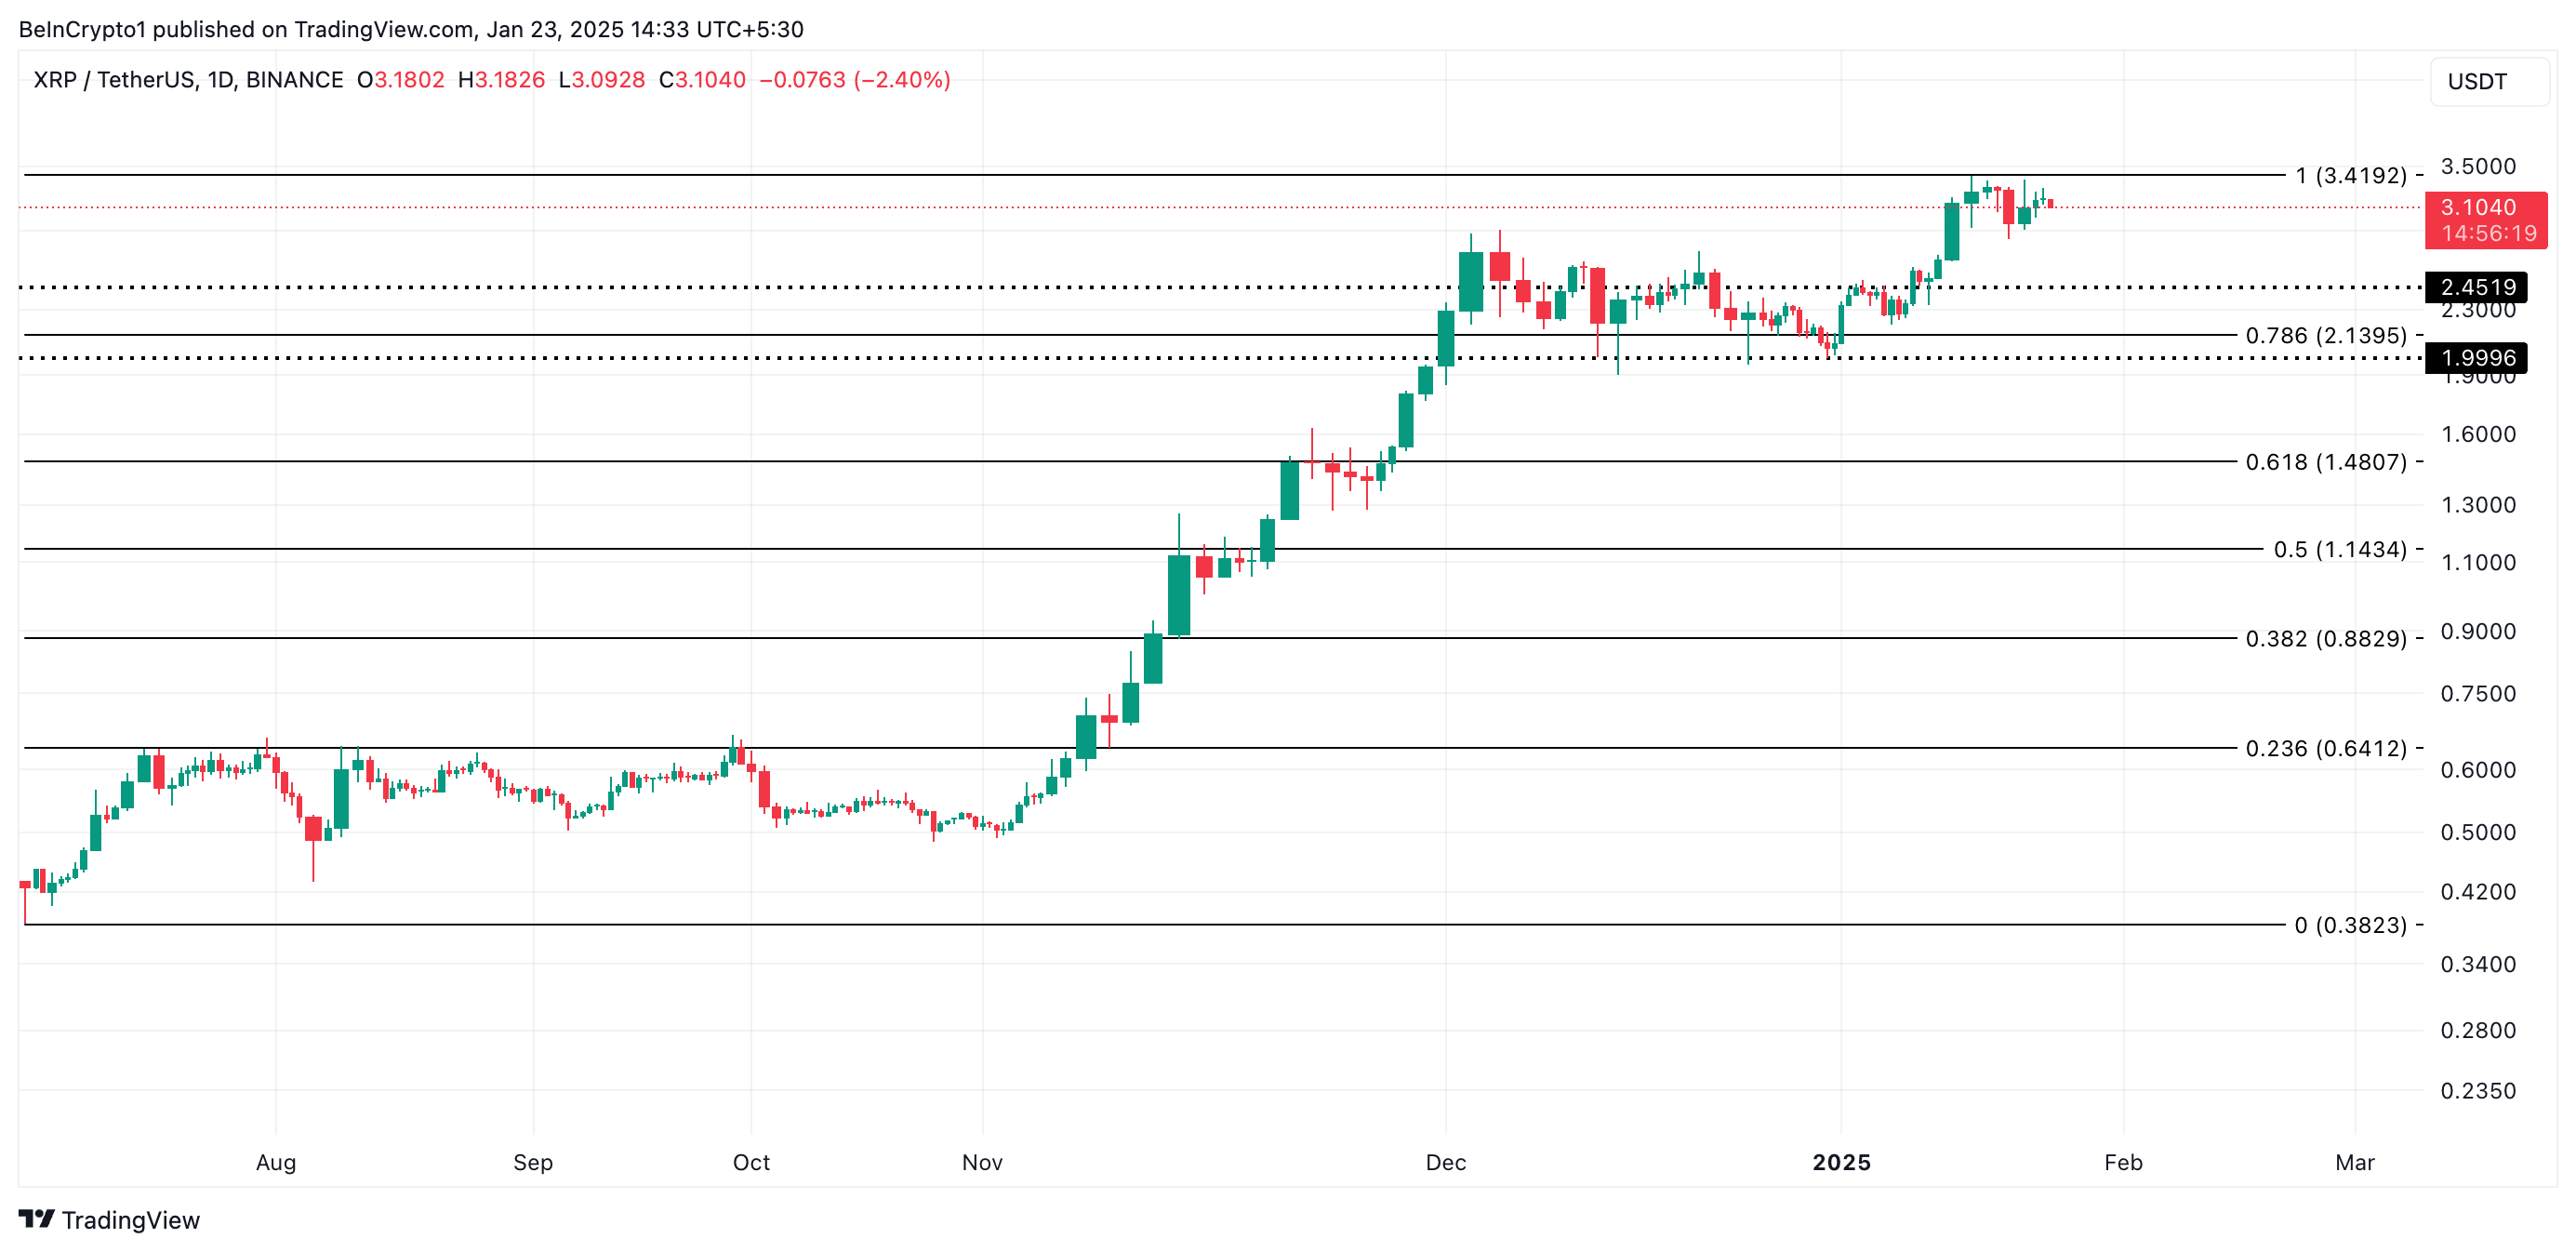
Conversely, a shift in the market trend toward accumulation would invalidate this bearish projection. In that case, XRP’s price would rally to its all-time high and attempt to break above it.
Disclaimer
In line with the Trust Project guidelines, this price analysis article is for informational purposes only and should not be considered financial or investment advice. BeInCrypto is committed to accurate, unbiased reporting, but market conditions are subject to change without notice. Always conduct your own research and consult with a professional before making any financial decisions. Please note that our Terms and Conditions, Privacy Policy, and Disclaimers have been updated.
-

 Market16 hours ago
Bitcoin and XRP Prices Steady as iDEGEN fires on all cylinders
-

 Market23 hours ago
Dogecoin Holding Time and Whale Activity Spikes
-

 Market15 hours ago
Bitwise Files for Dogecoin ETF Amid Growing Meme Coin Interest
-

 Bitcoin21 hours ago
US Bitcoin Revolution Begins, Senator Lummis Says
-

 Market21 hours ago
Ethereum Price Can Reach $3,500 On The Back Of These Factors
-

 Market20 hours ago
Why These Altcoins Are Trending Today — January 22
-

 Altcoin20 hours ago
Analyst Predicts XRP Price Surge To $8, Here’s Why
-

 Regulation19 hours ago
John Deaton Outlines Four Key Objectives For White House Crypto Council

