Market
Dogecoin (DOGE) Price Climbs 128%, Coin Marks 11 Years

Dogecoin (DOGE) price has recently seen significant growth, up 128% in the last 30 days, marking a major milestone as it celebrates 11 years since its launch in 2013 by Billy Markus and Jackson Palmer. As the largest meme coin in the market, with a market cap approaching $65 billion, DOGE continues to hold strong attention.
However, the DOGE Ichimoku Cloud chart is showing mixed signals. While the price remains above the cloud, indicating favorable market sentiment, the narrowing distance between the price and the cloud suggests potential volatility, which could either lead to continued gains or a reversal depending on future price action.
DOGE Ichimoku Cloud Shows Mixed Signals
The DOGE Ichimoku Cloud chart shows an overall bullish trend with the price positioned above the cloud, indicating that the market sentiment is still favorable for Dogecoin.
The green line (Tenkan-sen) and the blue line (Kijun-sen) are above the red (Senkou Span A) and orange (Senkou Span B) lines, further suggesting upward momentum.
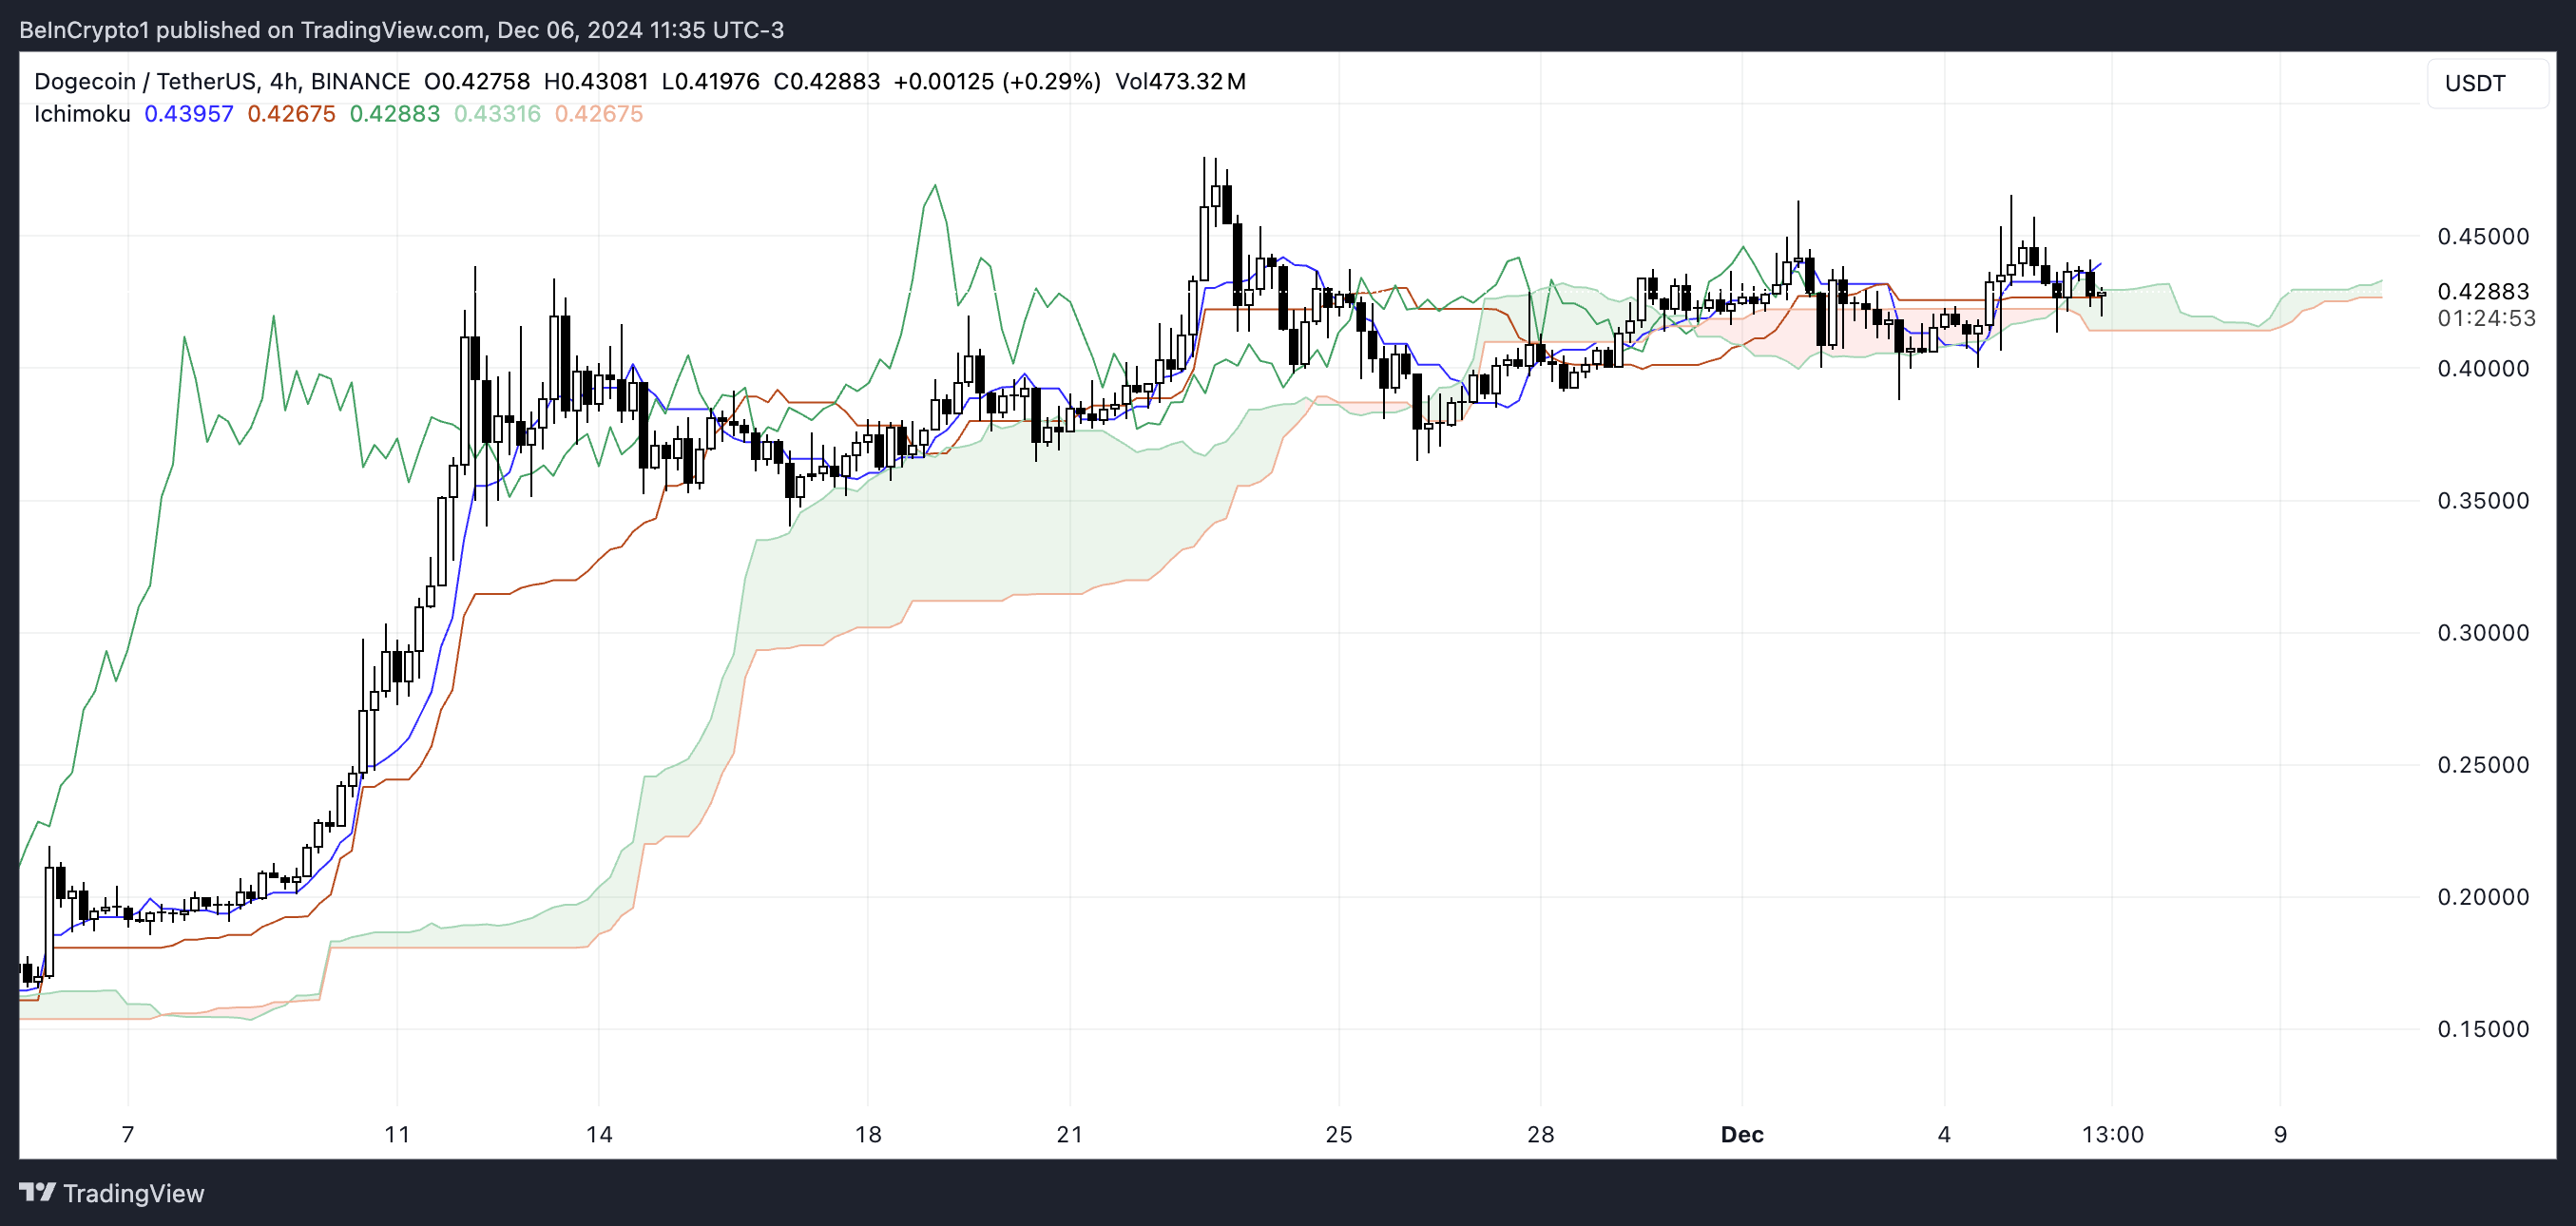
The price remains above the cloud, a key signal for potential further gains. However, this distance is narrowing.
The recent consolidation near the top could signal either a continuation or a reversal, depending on how the price interacts with the cloud and the lines. If DOGE price were to fall below the cloud, this would suggest a bearish outlook.
Dogecoin Trend Could Turn Negative
The recent drop in DOGE’s ADX from above 30 to 15.2 indicates a weakening trend strength. An ADX below 20 generally signals a lack of trend momentum, suggesting that the recent bullish momentum behind DOGE is fading.
This decline in ADX suggests that the market may be entering a consolidation phase, with no clear trend direction, after a period of strong upward movement.

The Average Directional Index (ADX) measures the strength of a trend, regardless of whether it’s bullish or bearish. It ranges from 0 to 100, with values above 25 typically indicating a strong trend, and values below 20 signaling weak or no trend. With D+ at 18.7 and D- at 20.4, D- surpassing D+ signals that selling pressure is gaining strength.
Combined with the low ADX, this suggests that DOGE could be losing momentum, with the potential for a price pullback or further consolidation as selling pressure begins to outweigh buying activity.
DOGE Price Prediction: Will Dogecoin Fall Below $0.30?
Dogecoin price could be facing a potential correction, as its short-term EMA lines are on the verge of crossing below one of the long-term EMA lines, which would form a death cross. A death cross typically signals a shift from an uptrend to a downtrend, and if this happens, DOGE price may see a decline.
The crossover of these lines indicates weakening bullish momentum and suggests that the price could face downward pressure in the near future.
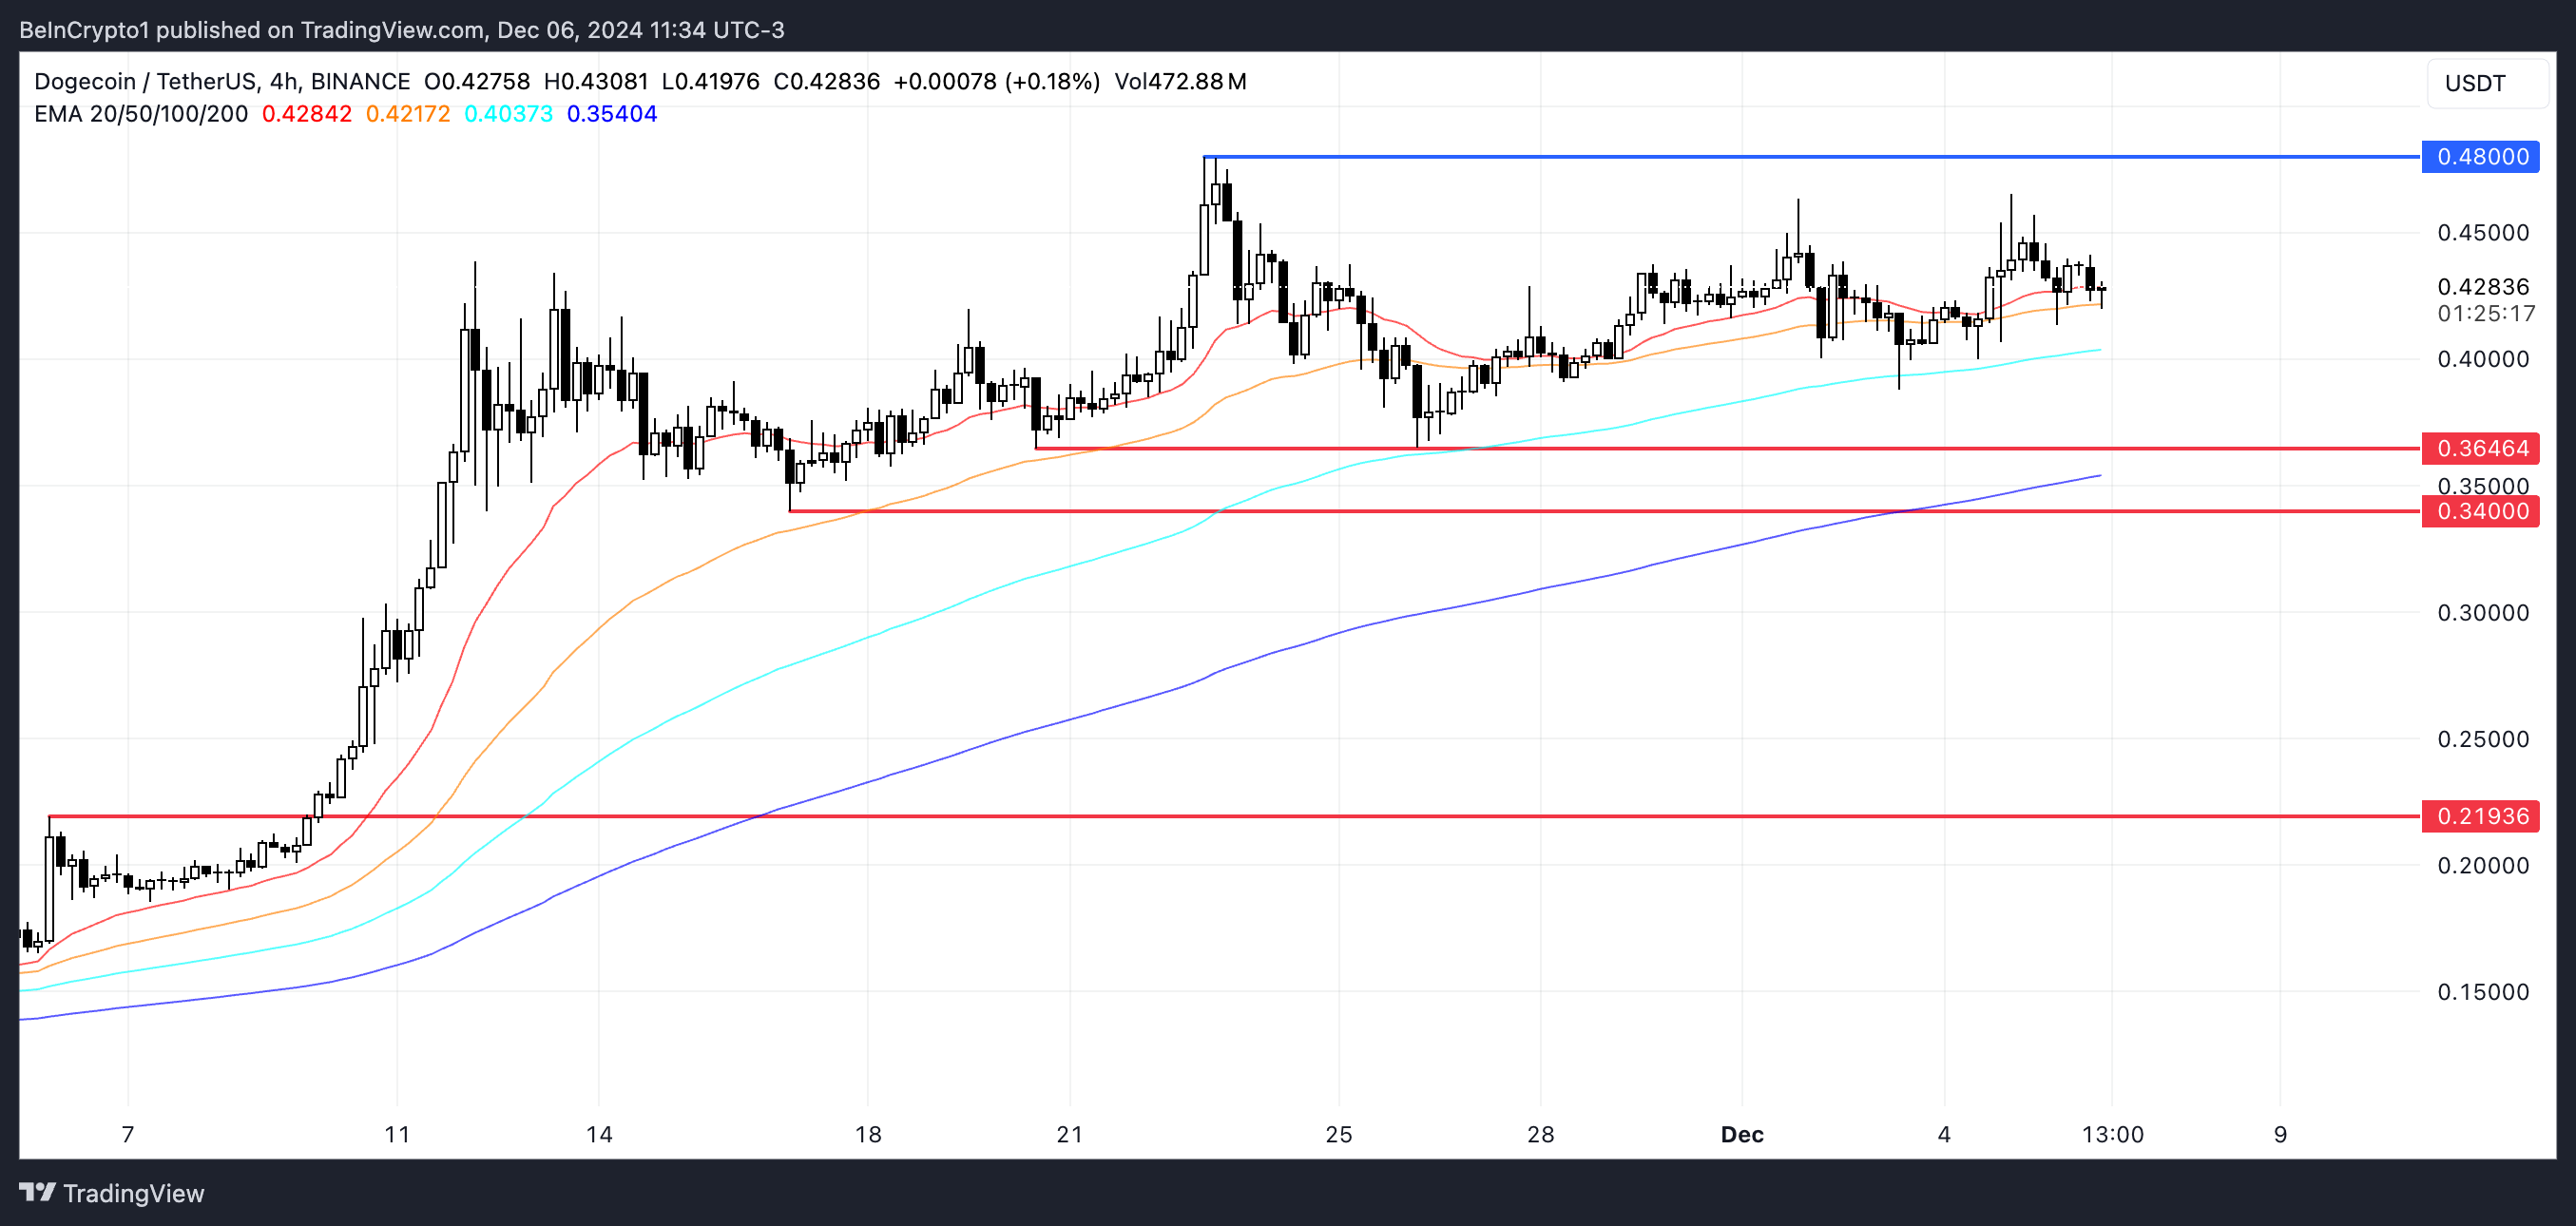
If the death cross does occur, DOGE price could first test support at $0.36 and $0.34. Should these levels fail to hold, the price could drop further, potentially reaching as low as $0.219.
However, if the uptrend continues and D+ (positive directional movement) strengthens over D- (negative directional movement), DOGE could regain bullish momentum and test the $0.48 level again, possibly even rising to $0.50 for the first time since 2021.
Disclaimer
In line with the Trust Project guidelines, this price analysis article is for informational purposes only and should not be considered financial or investment advice. BeInCrypto is committed to accurate, unbiased reporting, but market conditions are subject to change without notice. Always conduct your own research and consult with a professional before making any financial decisions. Please note that our Terms and Conditions, Privacy Policy, and Disclaimers have been updated.
Market
Base DEX Volume Approaches $3 Billion Amid Growing Adoption

Base, Coinbase’s Layer-2 (L2) blockchain solution, has reached new heights, setting an all-time high daily decentralized exchange (DEX) trading volume near $3 billion.
This milestone reflects Base’s growing prominence in the L2 space and its role in scaling on-chain transactions for Coinbase users.
Base Hits New Milestone in DEX Volume
Blockchain analyst Dan Smith highlighted Base L2’s record-breaking volume of $2.9 billion, including $1.3 billion in ETH-USD trading, which also hit an all-time high. Other trading pairs, such as ETH-cbBTC and BTC-USD, were close to breaking their own records.
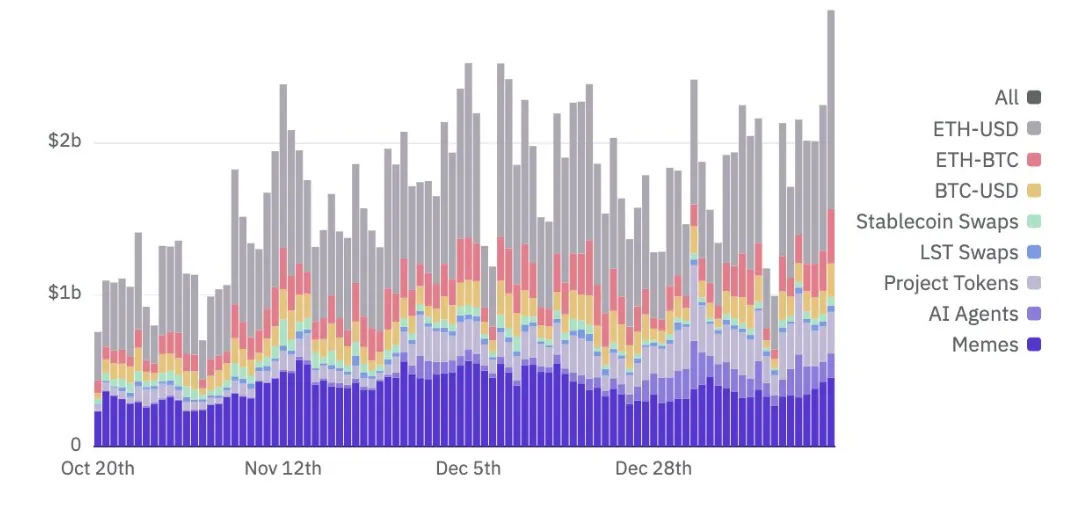
The $2.9 billion DEX volume reflects Base’s growing appeal among traders, particularly in ETH-USD pairs, which benefited from recent price volatility. Alexander, another blockchain enthusiast, noted that this milestone marked the first time Base nearly tagged $3 billion in daily volume, alluding to the development as evidence of L2’s growing adoption.
AerodromeFi, a liquidity-focused decentralized protocol on Base, also recorded an all-time high of $1.68 billion in volume, further emphasizing the ecosystem’s momentum.
“This is the first time Base nearly passed $3 billion and AerodromeFi set a new ATH of $1.68 billion in volume,” Alexander commented.
Base’s success is particularly notable because it operates without a native token. Coinbase explicitly ruled out launching a token for Base, prioritizing ecosystem growth and user adoption instead. This approach has likely contributed to its traction by focusing on utility and reducing speculative risks that could deter long-term users.
“There are no plans for a Base network token. We are focused on building, and we want to solve real problems that let you build better,” Base lead developer Jesse Pollak stated recently.
Consistent Growth in Transactions and TVL
The recent achievement follows Base’s earlier milestones, including reaching one billion transactions two months ago and surpassing six million daily transactions in October. More closely, the network recently outpaced Ethereum in user growth amid growing crypto markets.
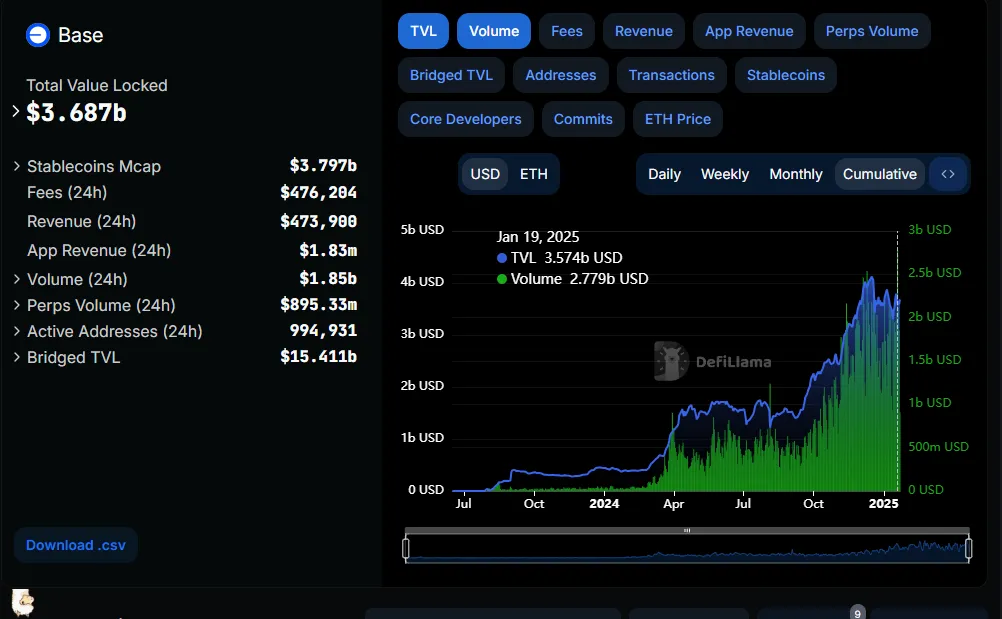
Additionally, Base’s Total Value Locked (TVL) has seen consistent growth, indicating increased user participation, asset inflows, and liquidity within its ecosystem. A rising TVL signals greater confidence in the platform, fostering a stronger and more sustainable DeFi environment.
Despite its impressive growth, Base has faced some criticism. The network was accused of copying aspects of an NFT project, sparking concerns over originality and intellectual property. While this controversy did not deter adoption, it highlights the challenges of rapid innovation in the competitive blockchain space.
Base’s trajectory positions it as a serious contender in the L2 space, competing with established players like Arbitrum (ARB) and Optimism (OP). Its emphasis on utility, combined with rising user participation and liquidity, paints a promising picture for its future.
Disclaimer
In adherence to the Trust Project guidelines, BeInCrypto is committed to unbiased, transparent reporting. This news article aims to provide accurate, timely information. However, readers are advised to verify facts independently and consult with a professional before making any decisions based on this content. Please note that our Terms and Conditions, Privacy Policy, and Disclaimers have been updated.
Market
Is a Drop Below $0.92 Inevitable?

Cardano’s recent sideways price action has led to a surge in demand for short positions among futures traders.
As the coin’s momentum slows, traders are increasingly betting on a price decline, signaling a bearish sentiment toward ADA.
Cardano Traders Bet on a Price Decline
According to Coinglass, ADA’s Long/Short Ratio is at a monthly low of 0.82, indicating a high demand for short positions.
An asset’s Long/Short Ratio compares the number of its long (buy) positions to short (sell) positions in a market. As with ADA, when the ratio is below one, more traders are betting on the price falling (shorting) rather than rising. If short sellers continue to dominate, this can increase the downward pressure on the asset’s price.

Additionally, ADA’s Weighted Sentiment remains negative, currently standing at -0.074, reinforcing the bearish outlook for the altcoin.
Weighted Sentiment gauges the overall market bias by analyzing the volume and tone of social media mentions. A negative value signals growing skepticism among investors, often leading to reduced trading activity and downward pressure on the asset’s price.
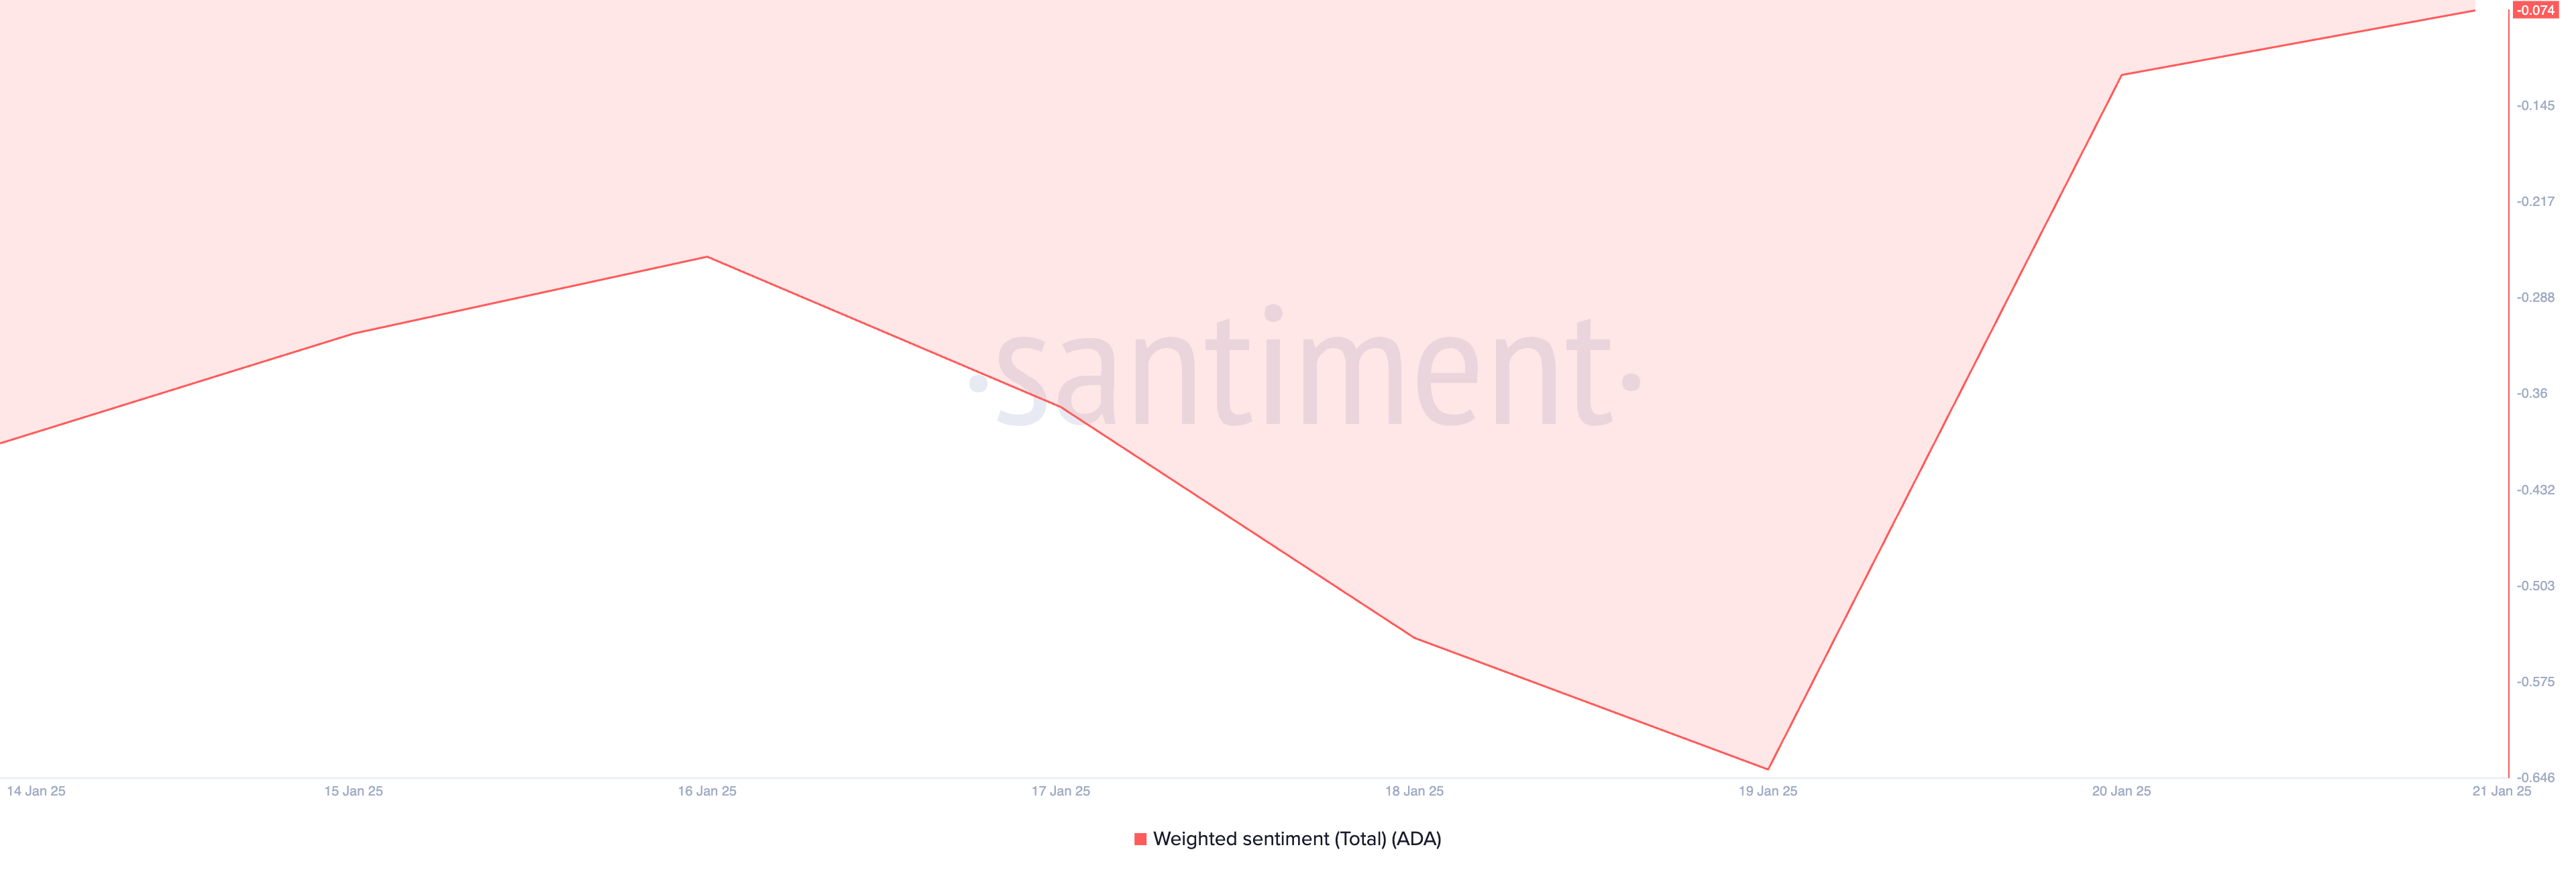
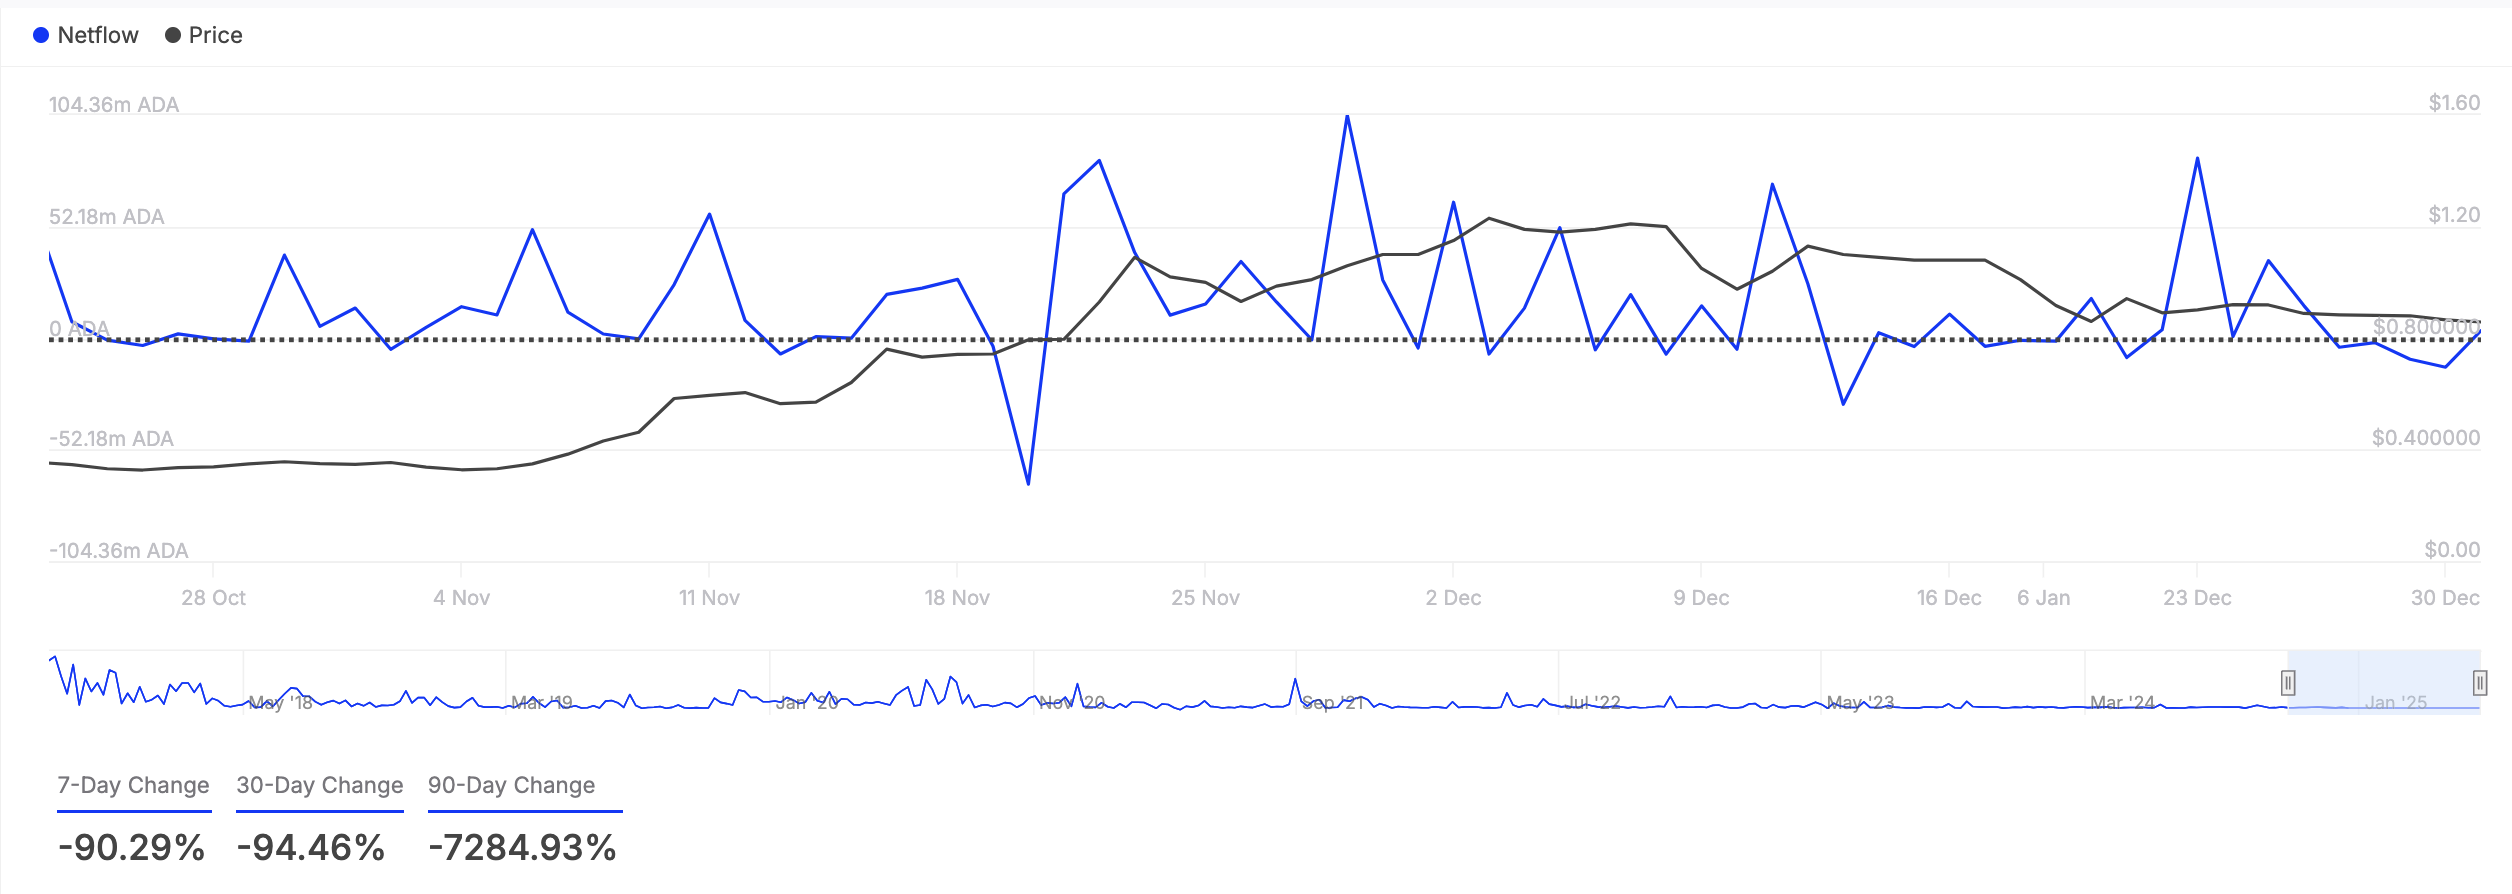
Notably, ADA whales have reduced their trading activity over the past week, with the coin’s large holders’ netflow dropping by 90.29%, according to IntoTheBlock.
Large holders, defined as addresses holding more than 0.1% of an asset’s circulating supply, play a significant role in market movements. A decline in their netflow indicates reduced buying activity, adding to the downward pressure on ADA’s price.
ADA Price Prediction: Recovery to $1 or Decline to $0.80?
ADA is currently trading at $0.98, hovering just above its support level of $0.90. If bearish pressure intensifies, the price may test this support. A failure to hold at $0.90 could see ADA’s decline extend further, potentially dropping to $0.80.
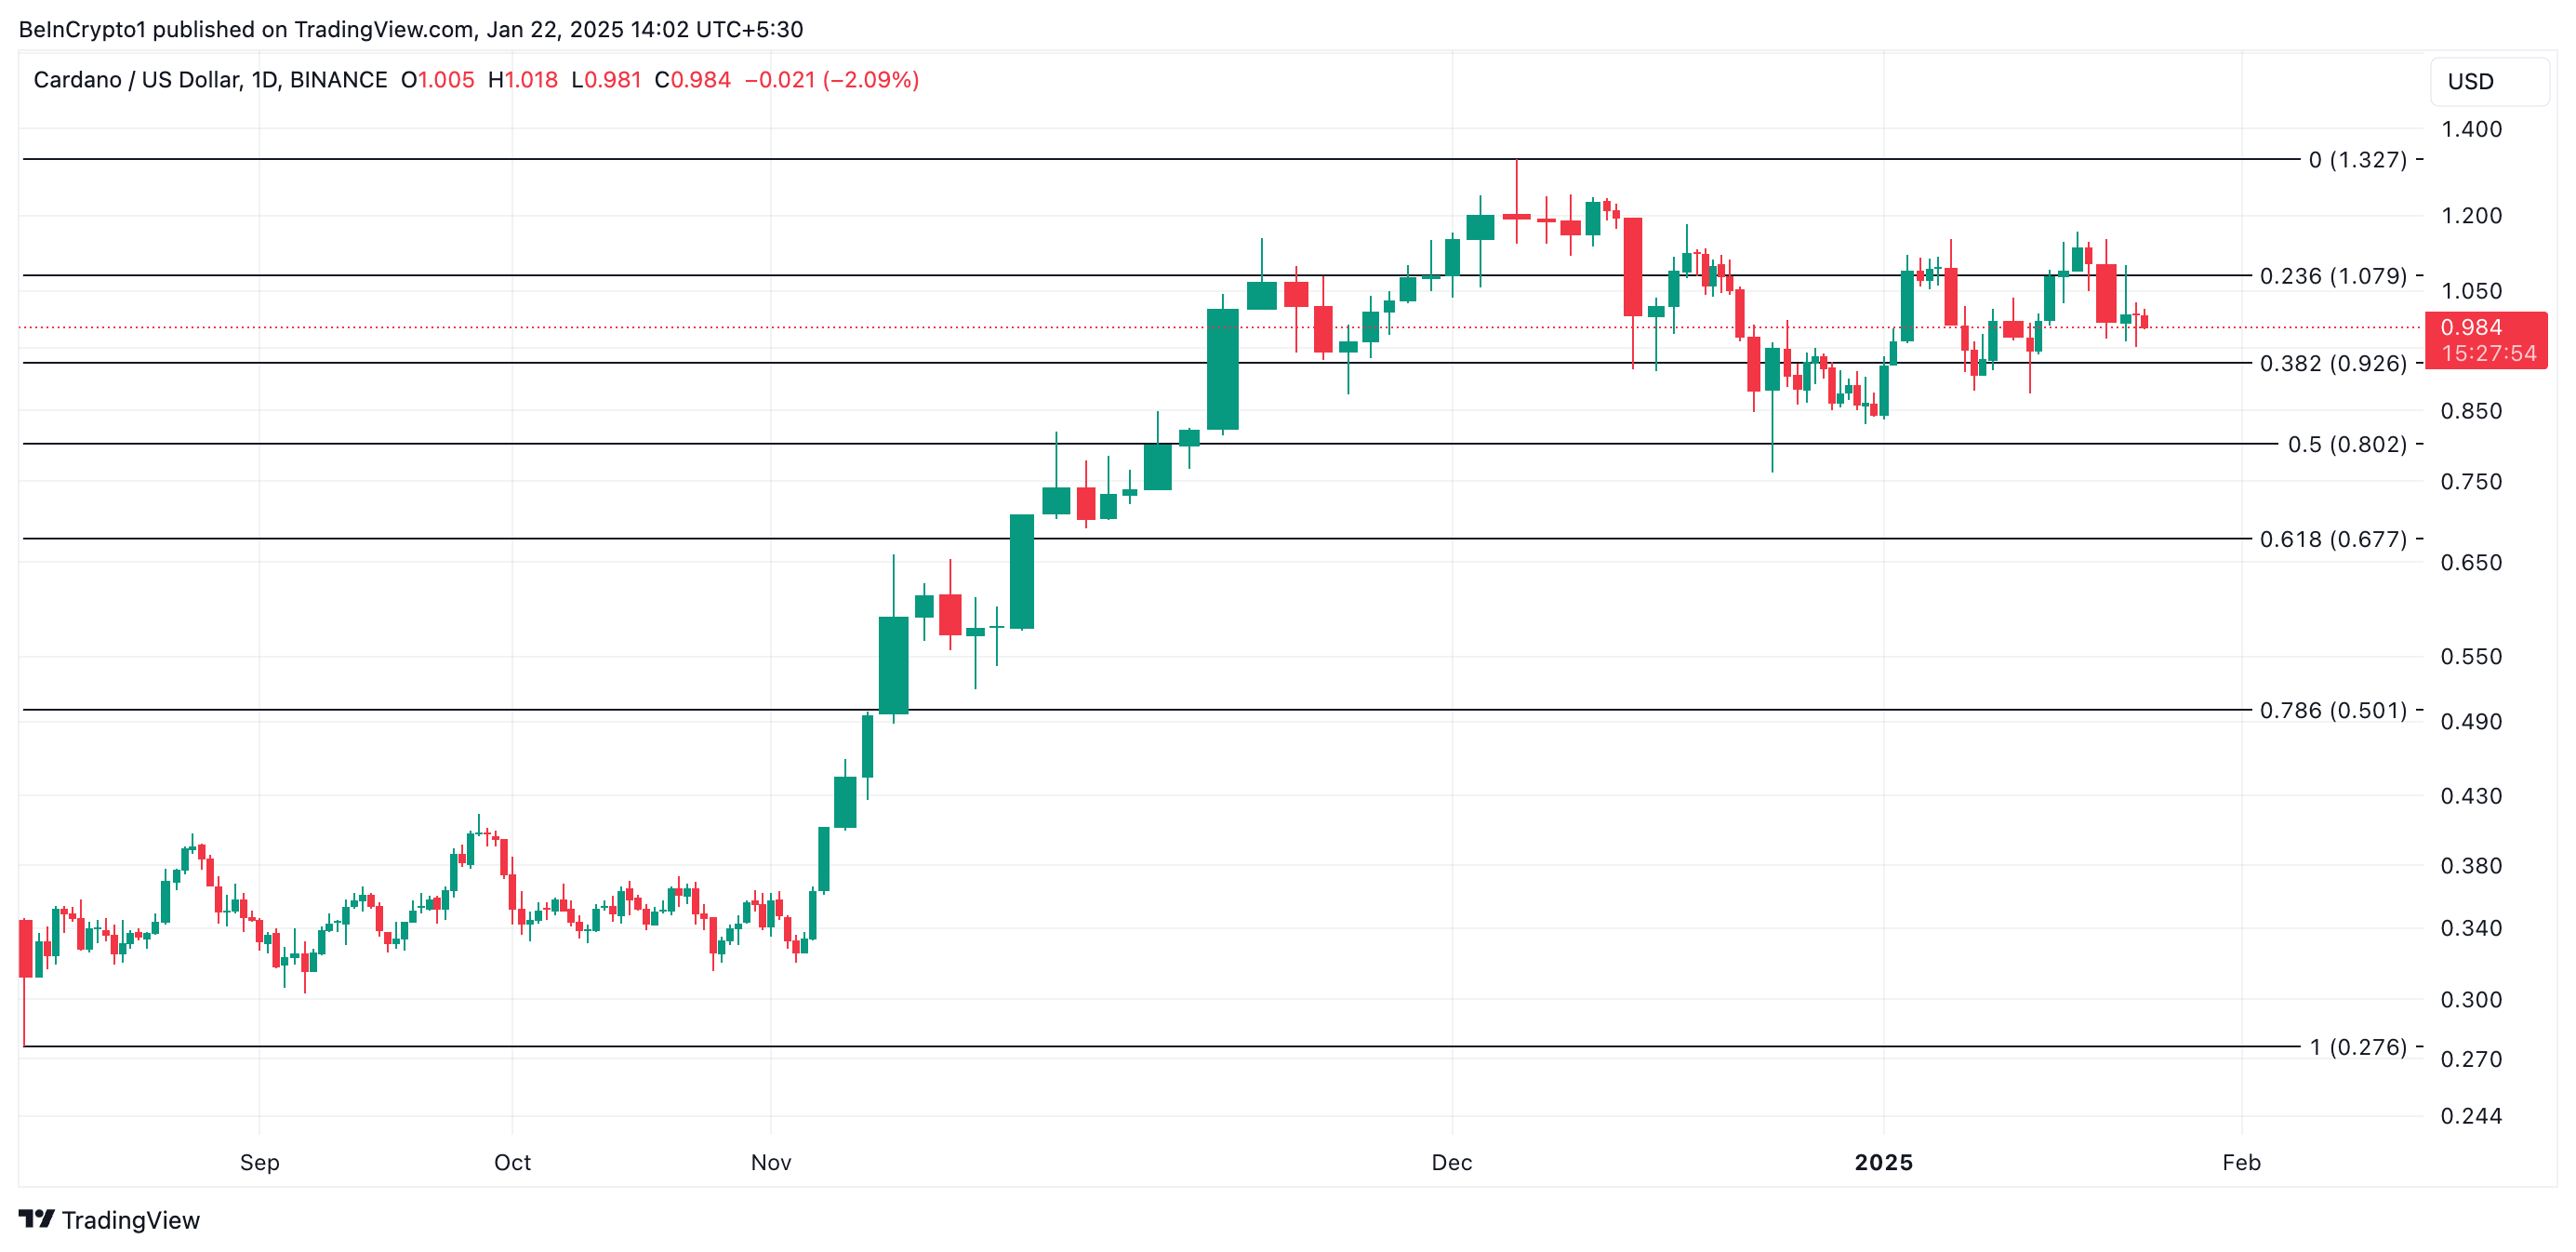
Conversely, if buying activity resurges, ADA’s price could stabilize above the $1 mark.
Disclaimer
In line with the Trust Project guidelines, this price analysis article is for informational purposes only and should not be considered financial or investment advice. BeInCrypto is committed to accurate, unbiased reporting, but market conditions are subject to change without notice. Always conduct your own research and consult with a professional before making any financial decisions. Please note that our Terms and Conditions, Privacy Policy, and Disclaimers have been updated.
Market
Will It Smash Another ATH?

Bitcoin price started a fresh increase above the $104,000 zone. BTC is consolidating above $105,000 and might aim for a new all-time high.
- Bitcoin started a decent increase above the $102,500 resistance zone.
- The price is trading above $104,500 and the 100 hourly Simple moving average.
- There was a break above a connecting bearish trend line with resistance at $104,000 on the hourly chart of the BTC/USD pair (data feed from Kraken).
- The pair could start another increase if it stays above the $103,500 support zone.
Bitcoin Price Regains Traction
Bitcoin price started a decent upward move above the $102,500 zone. BTC was able to climb above the $103,500 and $104,000 levels.
The bulls even pushed the price above the $105,000 level. Besides, there was a break above a connecting bearish trend line with resistance at $104,000 on the hourly chart of the BTC/USD pair. The pair surpassed the 50% Fib retracement level of the downward move from the $109,112 swing high to the $100,114 low.
Bitcoin price is now trading above $104,500 and the 100 hourly Simple moving average. On the upside, immediate resistance is near the $107,000 level. It is close to the 76.4% Fib retracement level of the downward move from the $109,112 swing high to the $100,114 low.
The first key resistance is near the $107,500 level. A clear move above the $107,500 resistance might send the price higher. The next key resistance could be $109,000.
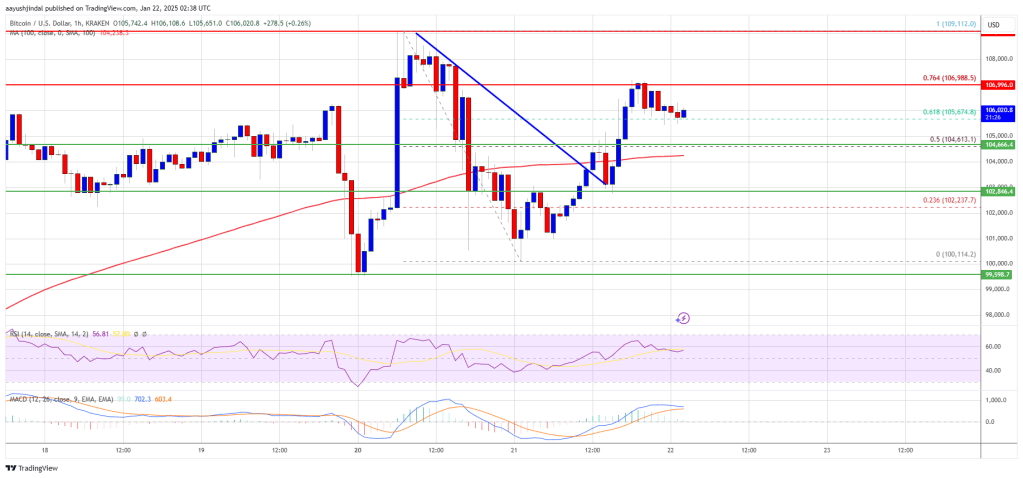
A close above the $109,000 resistance might send the price further higher. In the stated case, the price could rise and test the $110,000 resistance level and a new all-time high. Any more gains might send the price toward the $112,500 level.
Downside Correction In BTC?
If Bitcoin fails to rise above the $107,000 resistance zone, it could start a downside correction. Immediate support on the downside is near the $104,500 level. The first major support is near the $103,500 level.
The next support is now near the $102,800 zone. Any more losses might send the price toward the $100,500 support in the near term.
Technical indicators:
Hourly MACD – The MACD is now gaining pace in the bullish zone.
Hourly RSI (Relative Strength Index) – The RSI for BTC/USD is now above the 50 level.
Major Support Levels – $104,500, followed by $103,500.
Major Resistance Levels – $107,000 and $108,500.
-

 Regulation21 hours ago
Acting SEC Chair Uyeda announces new crypto task force
-

 Regulation19 hours ago
Turkey rolls out new crypto AML regulations
-

 Ethereum16 hours ago
ETH breaks $3,900 as Bitcoin spikes past $103k
-

 Regulation23 hours ago
Tether’s market capitalisation slips as MiCA regulations kick in
-

 Blockchain23 hours ago
Jordan Adopts Blockchain Policy To Propel Government Into The Future
-

 Regulation17 hours ago
Crypto custody firm Copper withdraws UK registration
-

 Ethereum19 hours ago
Ethereum ETFs inflows surge as Bitcoin ETFs see major outflows
-

 Market12 hours ago
Weekly Price Analysis: Bitcoin Remains Rangebound while Altcoins Fly


