
Market
Analyst Claims Ethereum Is Set to Rally to $7,300: Here’s Why
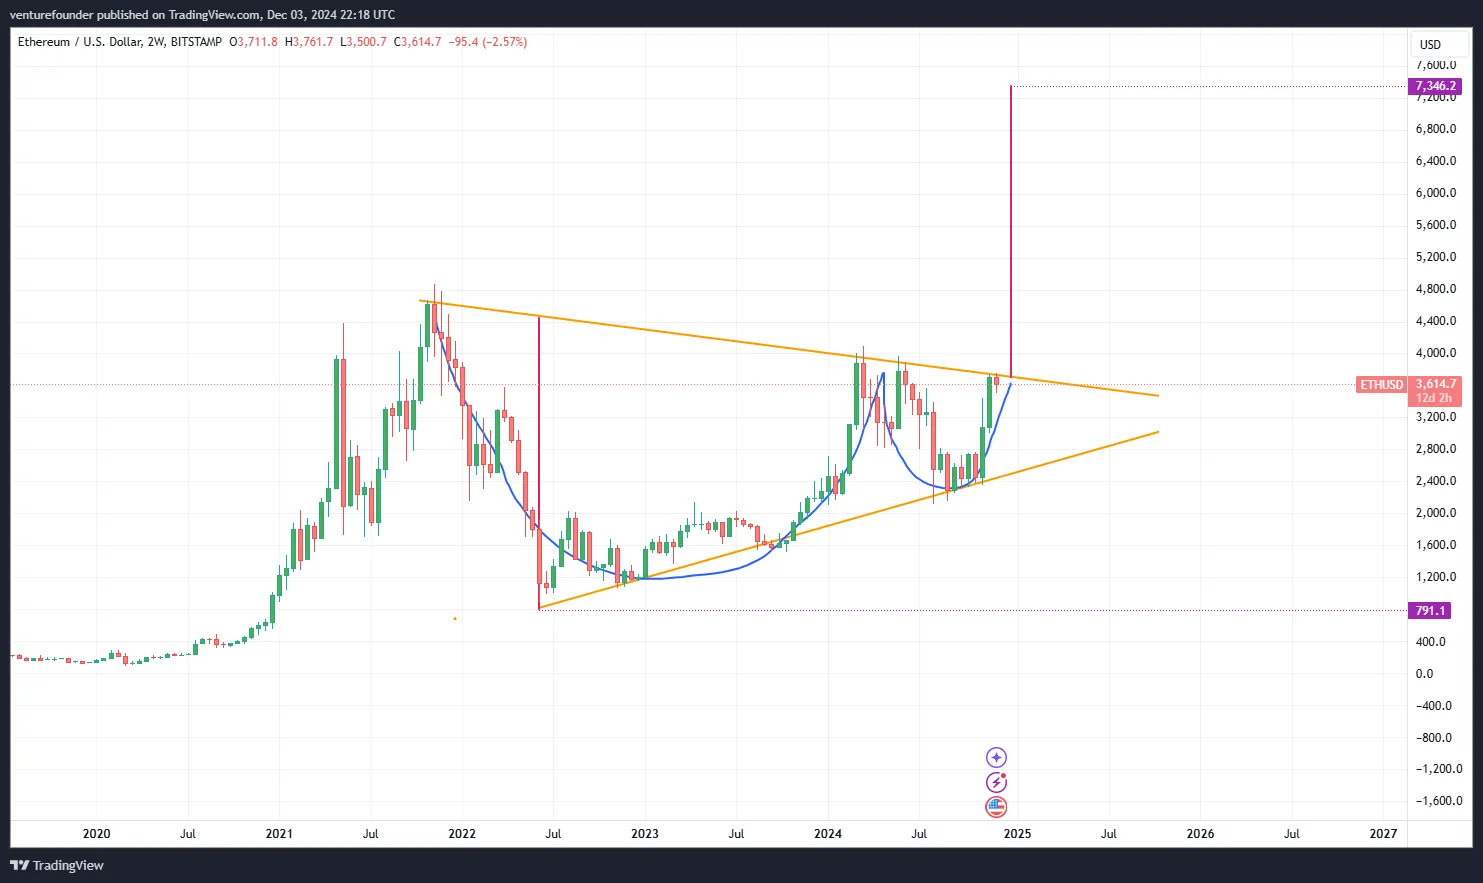
Ethereum (ETH) has been on a strong rally, with its price rising from $2,400 to $3,700 in recent weeks. This surge has captured the attention of traders and investors, fueling optimism about ETH’s future. However, according to pseudonymous analyst VentureFounder, Ethereum is primed for an even larger rally, potentially reaching $7,346.
Despite the bullish outlook, Ethereum’s foundation remains slightly unstable, with concerns over long-term holder (LTH) behavior and market volatility. While a major breakout is anticipated, caution remains as Ethereum navigates these critical phases.
Ethereum Has a Strategic Rise Ahead
Analyst venturefounder suggests that Ethereum is currently forming a “cup and handle” triangle consolidation pattern, which is often seen as a sign of future price gains. According to this analysis, if Ethereum successfully breaks above the $3,800 resistance level, it could target $7,346—an increase of over 97% from its current price. This technical pattern implies that a sustained rally is possible, but only if ETH confirms the breakout and continues to build momentum.
However, the pattern is not yet fully confirmed, and Ethereum’s path forward hinges on its ability to push past the $3,800 resistance. Until this occurs, Ethereum remains in a consolidation phase, and a breakout could be the catalyst for further price appreciation. As such, traders will be watching for any signs of upward movement to validate the predicted rally.
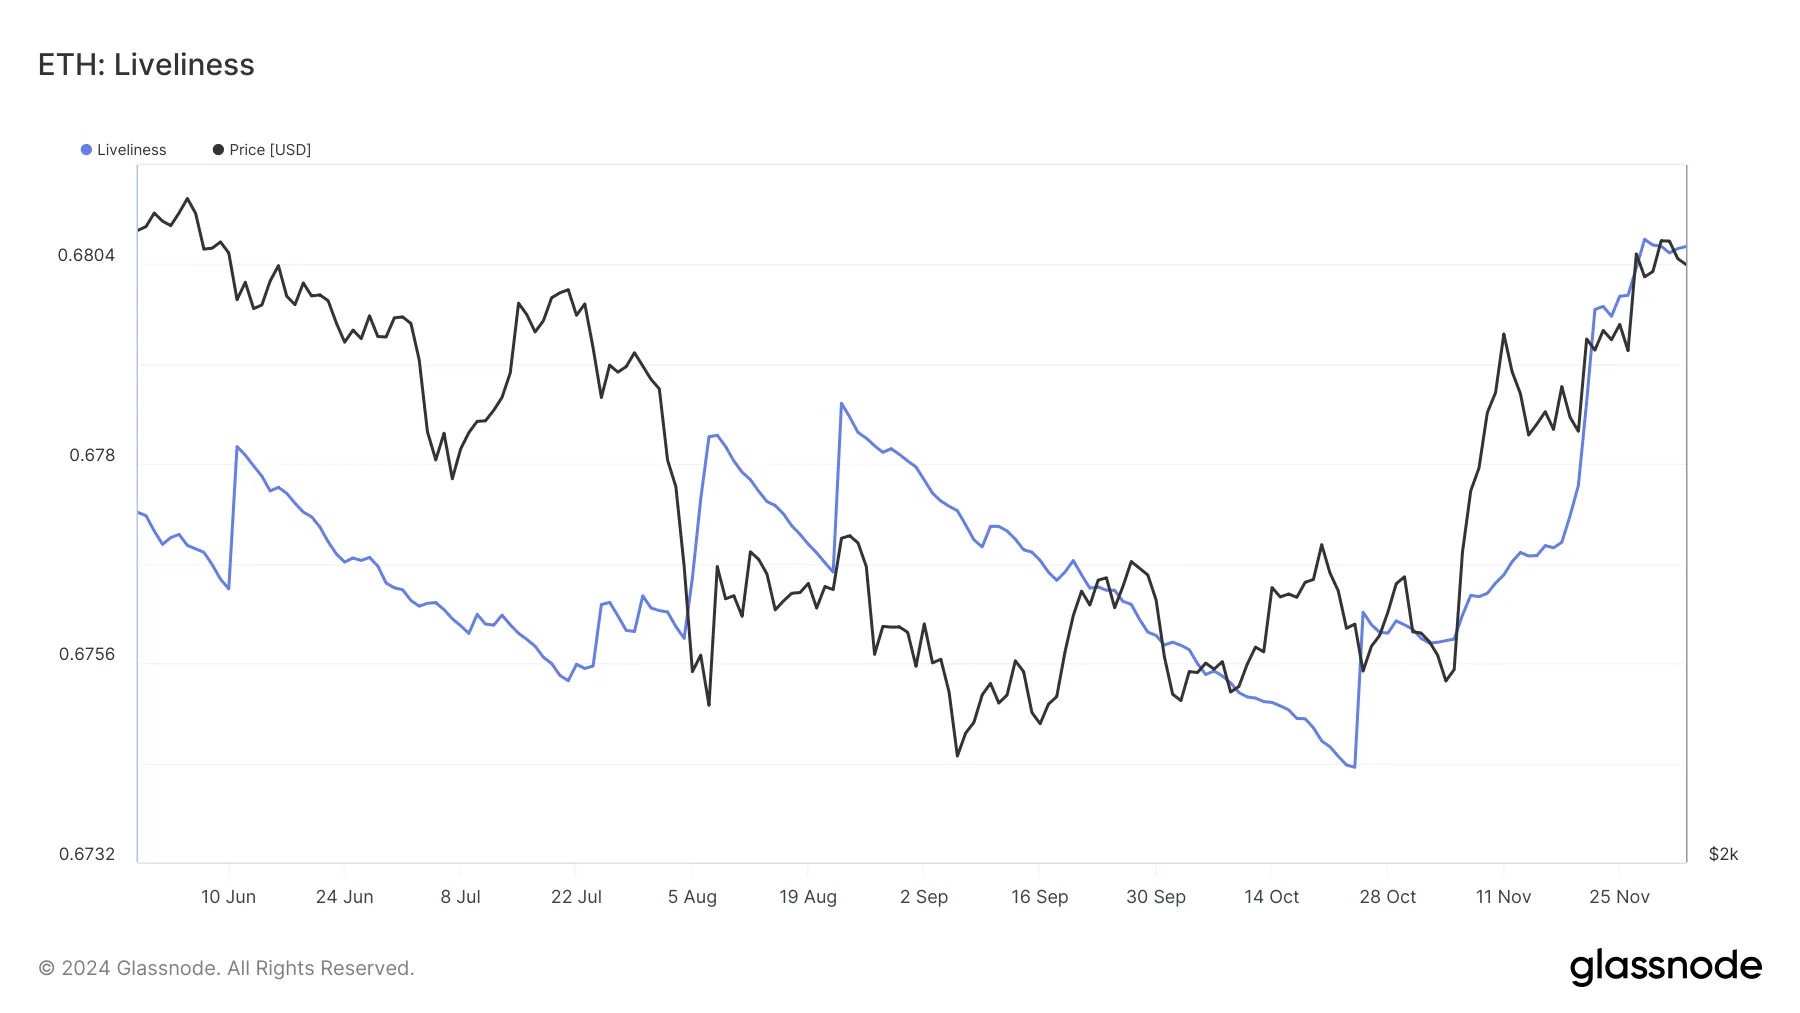
Ethereum’s macro momentum remains positive, although there are concerns about the long-term holder (LTH) supply, which is measured by the Liveliness indicator. This metric tracks whether long-term holders are selling or accumulating Ethereum.
An uptick in Liveliness indicates that LTHs are liquidating their positions, which could signal a bearish trend or a shift in market sentiment. Conversely, a decrease in Liveliness suggests that long-term holders are accumulating or holding their Ethereum, reinforcing a bullish outlook.
At present, LTH uncertainty is a concern. If Ethereum’s Liveliness continues to rise, it could indicate that long-term holders are selling off, which may put downward pressure on the price. Such selling activity could destabilize the rally and delay any potential price surge. Therefore, the behavior of LTHs remains a crucial factor to watch.
ETH Price Prediction: Aiming at All-Time High
Ethereum currently sits at around $3,700, just below the crucial $3,800 resistance level. If ETH successfully breaks above this threshold, it could initiate a rally toward $7,346, as the cup and handle pattern suggests. This would represent a 97% increase, signaling significant bullish potential.
However, it is essential for Ethereum to establish firm support above $3,800 before any substantial price gains can materialize.
Bouncing off of $3,800 is also the key to ETH crossing the $4,000 mark, which is the current year-to-date high. This would warrant conviction from retail holders and interest from institutional investors.
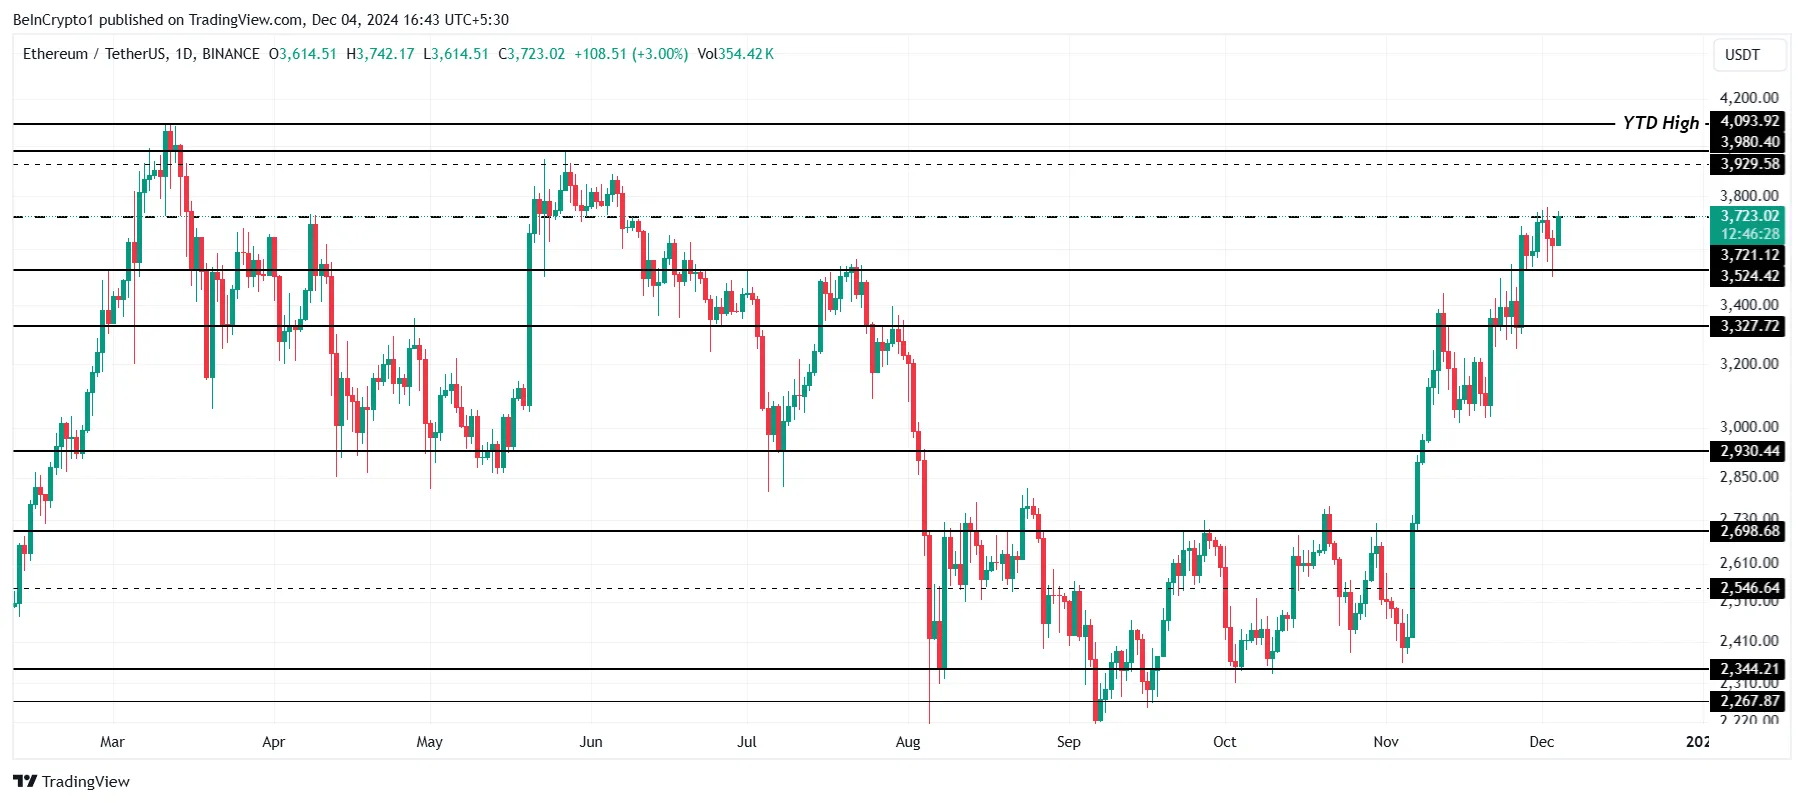
However, if Ethereum’s Liveliness continues to climb and long-term holders keep liquidating their positions, the bullish scenario may be at risk. A sustained period of selling could cause a price correction, pushing Ethereum back toward the lower $3,327 range. This potential downturn would invalidate the current bullish thesis and could delay the anticipated rally.
Disclaimer
In line with the Trust Project guidelines, this price analysis article is for informational purposes only and should not be considered financial or investment advice. BeInCrypto is committed to accurate, unbiased reporting, but market conditions are subject to change without notice. Always conduct your own research and consult with a professional before making any financial decisions. Please note that our Terms and Conditions, Privacy Policy, and Disclaimers have been updated.


XRP price started a fresh decline below the $2.080 zone. The price is now recovering some losses and might face hurdles near the $2.150 level.
- XRP price started a fresh decline after it failed to clear the $2.20 resistance zone.
- The price is now trading below $2.120 and the 100-hourly Simple Moving Average.
- There is a connecting bearish trend line forming with resistance at $2.10 on the hourly chart of the XRP/USD pair (data source from Kraken).
- The pair might extend losses if it fails to clear the $2.150 resistance zone.
XRP Price Faces Resistance
XRP price failed to continue higher above the $2.20 resistance zone and reacted to the downside, like Bitcoin and Ethereum. The price declined below the $2.150 and $2.10 levels.
The pair even declined below the $2.050 zone. A low was formed at $2.023 and the price is now attempting a recovery wave. There was a move above the $2.050 level. The price cleared the 23.6% Fib retracement level of the recent decline from the $2.215 swing high to the $2.023 low.
The price is now trading below $2.120 and the 100-hourly Simple Moving Average. On the upside, the price might face resistance near the $2.10 level. There is also a connecting bearish trend line forming with resistance at $2.10 on the hourly chart of the XRP/USD pair. The trend line is near the 50% Fib retracement level of the recent decline from the $2.215 swing high to the $2.023 low.

The first major resistance is near the $2.150 level. The next resistance is $2.1680. A clear move above the $2.1680 resistance might send the price toward the $2.20 resistance. Any more gains might send the price toward the $2.220 resistance or even $2.250 in the near term. The next major hurdle for the bulls might be $2.2880.
Another Decline?
If XRP fails to clear the $2.120 resistance zone, it could start another decline. Initial support on the downside is near the $2.050 level. The next major support is near the $2.020 level.
If there is a downside break and a close below the $2.020 level, the price might continue to decline toward the $2.00 support. The next major support sits near the $1.880 zone.
Technical Indicators
Hourly MACD – The MACD for XRP/USD is now losing pace in the bearish zone.
Hourly RSI (Relative Strength Index) – The RSI for XRP/USD is now above the 50 level.
Major Support Levels – $2.050 and $2.020.
Major Resistance Levels – $2.120 and $2.150.


Brian Quintenz, the incoming Chair of the US CFTC (Commodity Futures Trading Commission), has begun meeting with Capitol Hill lawmakers before his nomination hearing.
On Monday, Quintenz met with Senator Chuck Grassley (R-IA) to discuss key regulatory issues, including the CFTC’s role in overseeing crypto spot markets.
CFTC Targets Crypto Spot Market After Derivatives
Brian Quintenz met with Republican Senator from Iowa Chuck Grassley to discuss another element in the CFTC’s crypto market structure regulation agenda. This time, the focus is on crypto spot markets.
“It was wonderful to meet with you Chuck Grassley and discuss your leadership on whistleblower issues as well as the future of the agency,” Quintenz stated.
Grassley also commented on their discussion. He highlighted the CFTC Whistleblower Protection Program for spot crypto markets as part of the agenda. Notably, Grassley is a member of the Senate AG Committee, the legislative body overseeing the CFTC.
Eleanor Terrett, host of the Crypto America podcast, indicated that the Senate AG Committee will have a significant role in part of the CFTC’s crypto regulation agenda. Specifically, it would have an outsized say in whether the CFTC could gain expanded jurisdiction over crypto spot markets.
The meeting comes as the CFTC moves closer to expanding its role in crypto regulation. US President Donald Trump tapped Quintenz, a former executive at venture capital firm Andreessen Horowitz (a16z), to lead the agency.
His appointment is part of Trump’s broader plans to reshape crypto oversight. This could potentially give the CFTC greater authority over digital asset markets.
Meanwhile, regulatory developments surrounding crypto have accelerated in recent weeks. The CFTC eased regulatory hurdles for the crypto derivatives market only days ago. The move will enhance market efficiency and attract institutional investors.
Beyond derivatives and spot markets, the CFTC is also exploring other areas of crypto oversight. The agency recently announced plans to host a roundtable discussion on prediction market regulation. It aims to address the regulation of decentralized prediction platforms.
Stablecoins are also on the agency’s radar. The CFTC also revealed a forum to discuss stablecoin regulation and potential risks associated with their widespread adoption.
Additionally, the Federal Deposit Insurance Corporation (FDIC) and the CFTC revoked previous crypto-related guidelines, signaling a shift in regulatory strategy.
Crypto markets can also not rule out the possibility of further collaboration between key agencies in the broader industry. Reports indicate that the US SEC (Securities and Exchange Commission) and the CFTC have discussed reviving a joint advisory committee to coordinate on crypto regulation.
If revived, the committee could serve as a bridge between the agencies. This would address concerns over jurisdictional overlap and streamlining oversight efforts.
As Quintenz prepares for his nomination hearing, his meetings with lawmakers suggest that crypto regulation will be a top priority for the CFTC moving forward.
Disclaimer
In adherence to the Trust Project guidelines, BeInCrypto is committed to unbiased, transparent reporting. This news article aims to provide accurate, timely information. However, readers are advised to verify facts independently and consult with a professional before making any decisions based on this content. Please note that our Terms and Conditions, Privacy Policy, and Disclaimers have been updated.

Solana started a fresh decline below the $132 support zone. SOL price is now consolidating and might struggle to recover above the $126 resistance.
- SOL price started a recovery wave from the $122 support zone against the US Dollar.
- The price is now trading below $130 and the 100-hourly simple moving average.
- There is a key rising channel forming with support at $124 on the hourly chart of the SOL/USD pair (data source from Kraken).
- The pair could start a fresh increase if the bulls clear the $126 zone.
Solana Price Faces Resistance
Solana price started a fresh decline below the $135 and $132 levels, like Bitcoin and Ethereum. SOL even declined below the $125 support level before the bulls appeared.
A low was formed at $122.64 and the price recently started a consolidation phase. There was a minor increase above the $125 level. The price tested the 23.6% Fib retracement level of the downward move from the $140 swing high to the $122 low.
Solana is now trading below $126 and the 100-hourly simple moving average. There is also a key rising channel forming with support at $124 on the hourly chart of the SOL/USD pair.
On the upside, the price is facing resistance near the $126 level. The next major resistance is near the $128 level. The main resistance could be $132 or the 50% Fib retracement level of the downward move from the $140 swing high to the $122 low.

A successful close above the $132 resistance zone could set the pace for another steady increase. The next key resistance is $136. Any more gains might send the price toward the $142 level.
Another Decline in SOL?
If SOL fails to rise above the $128 resistance, it could start another decline. Initial support on the downside is near the $124 zone. The first major support is near the $122 level.
A break below the $122 level might send the price toward the $115 zone. If there is a close below the $115 support, the price could decline toward the $102 support in the near term.
Technical Indicators
Hourly MACD – The MACD for SOL/USD is losing pace in the bearish zone.
Hourly Hours RSI (Relative Strength Index) – The RSI for SOL/USD is above the 50 level.
Major Support Levels – $124 and $122.
Major Resistance Levels – $128 and $132.

XRP Bulls Fight Back—Is a Major Move Coming?

A Make or Break Situation As Ripple Crypto Flirts Around $2

CFTC’s Crypto Market Overhaul Under New Chair Brian Quintenz

$2,300 Emerges As The Most Crucial Resistance

Solana (SOL) Holds Steady After Decline—Breakout or More Downside?

Ethereum Price Faces a Tough Test—Can It Clear the Hurdle?

2.52 Million Altcoins Are Ruining Crypto’s Future

Animoca Brands Valuation Tanks 75% In Two Years, Here’s Why

Crypto exchange BingX hacked for $43 million

Are The Big Players Losing Interest?

Hong Kong’s Securities Association Tips Authorities On Crypto Self-Regulation

Coinbase cbBTC Set to go Live on Solana
2.52 Million Altcoins Are Ruining Crypto’s Future
Animoca Brands Valuation Tanks 75% In Two Years, Here’s Why
Crypto exchange BingX hacked for $43 million
Are The Big Players Losing Interest?
Hong Kong’s Securities Association Tips Authorities On Crypto Self-Regulation
Coinbase cbBTC Set to go Live on Solana
-
 Bitcoin15 hours ago
Strategy Adds 22,048 BTC for Nearly $2 Billion
-
 Market20 hours ago
Strategic Move for Trump Family in Crypto
-

 Market19 hours ago
Top Crypto Airdrops to Watch in the First Week of April
-
 Market14 hours ago
Trump Family Gets Most WLFI Revenue, Causing Corruption Fears
-
 Altcoin19 hours ago
$33 Million Inflows Signal Market Bounce
-

 Ethereum14 hours ago
Ethereum’s Price Dips, But Investors Seize The Opportunity To Stack Up More ETH
-

 Market17 hours ago
Bitcoin Mining Faces Tariff Challenges as Hashrate Hits New ATH
-

 Bitcoin23 hours ago
US Macroeconomic Indicators This Week: NFP, JOLTS, & More