Market
Polkadot 2.0 to Launch in Q1 2025 As Development in Final Phase

Polkadot 2.0, the latest upgrade to the Polkadot network, will launch in Q1 2025. An early testnet version of the blockchain is already available on the Kusama network.
The launch period was confirmed earlier today by Parity Technologies, the developers behind Polkadot.
Polkadot 2.0 Will Introduce Much-Needed Scalability to the Blockchain
Polkadot 2.0 represents a significant upgrade of the Polkadot network, introducing technical advancements to enhance scalability, flexibility, and accessibility for developers.
According to Parity Technologies, the upgrade will have three key features – Async Backing, Agile Coretime, and Elastic Scaling.
The first two features have been successfully implemented in the network. The team is currently working on Elastic Scaling ahead of its Q1 2025 launch.
“Last part of Polkadot 2.0 is Elastic Scaling. Projects will be able to add multiple Cores for one task, shorten block production time or add on-demand Cores if they have throughput problems,” Polkadot executive Emil Kietzman wrote on X (formerly Twitter).
These features will reduce the block time from 12 seconds to 6 seconds, increasing transaction throughput. DApps and other projects on Polkadot 2.0 will be able to access network resources on-demand, moving away from the traditional parachain slot auction model.
Most importantly, Elastic Scaling will allow the network to scale dynamically as needed. These enhancements on Polkadot 2.0 could potentially lower developers’ entry barriers.
DOT has seen a significant rally in November, surging over 100%. The network’s high staking returns have attracted new users in 2024. According to an earlier CoinGecko report, Polkadot is among the top three blockchains that provide the highest staking yields.

Furthermore, the network’s interoperability has received wider praise from developer communities. Another report earlier this year named Polkadot as one of the leading blockchains in development and community engagement.
Despite these recognitions, the network has suffered extensively in the past few years due to the lack of scalability. As a result, the number of core developers on the network has gradually decreased.
Polkadot 2.0 can potentially change this and introduce much-needed scalability and accessibility to the blockchain. A successful launch can bring more DApps to the ecosystem and drive DOT’s market prospects.
Disclaimer
In adherence to the Trust Project guidelines, BeInCrypto is committed to unbiased, transparent reporting. This news article aims to provide accurate, timely information. However, readers are advised to verify facts independently and consult with a professional before making any decisions based on this content. Please note that our Terms and Conditions, Privacy Policy, and Disclaimers have been updated.
Market
3 Altcoins Predicted to Outperform BTC in December 2024

Altcoins like Solana (SOL), Dogecoin (DOGE), and Render (RENDER) are showing strong momentum as Bitcoin nears $100,000. Solana recently hit a new all-time high and continues to attract users and trading volume.
Dogecoin, with a $60 billion market cap, leads the meme coin sector and benefits from its positive correlation with Bitcoin. Meanwhile, Render is up 76% this month, driven by the rising interest in AI coins.
Solana (SOL)
SOL price reached a new all-time high on November 22 before entering a correction phase, but its momentum over the past month remains impressive, with a 38% gain. This growth slightly outpaces Bitcoin’s 35% rise over the same period.
As Bitcoin approaches the highly anticipated $100,000 milestone, Solana is well-positioned to benefit from it.
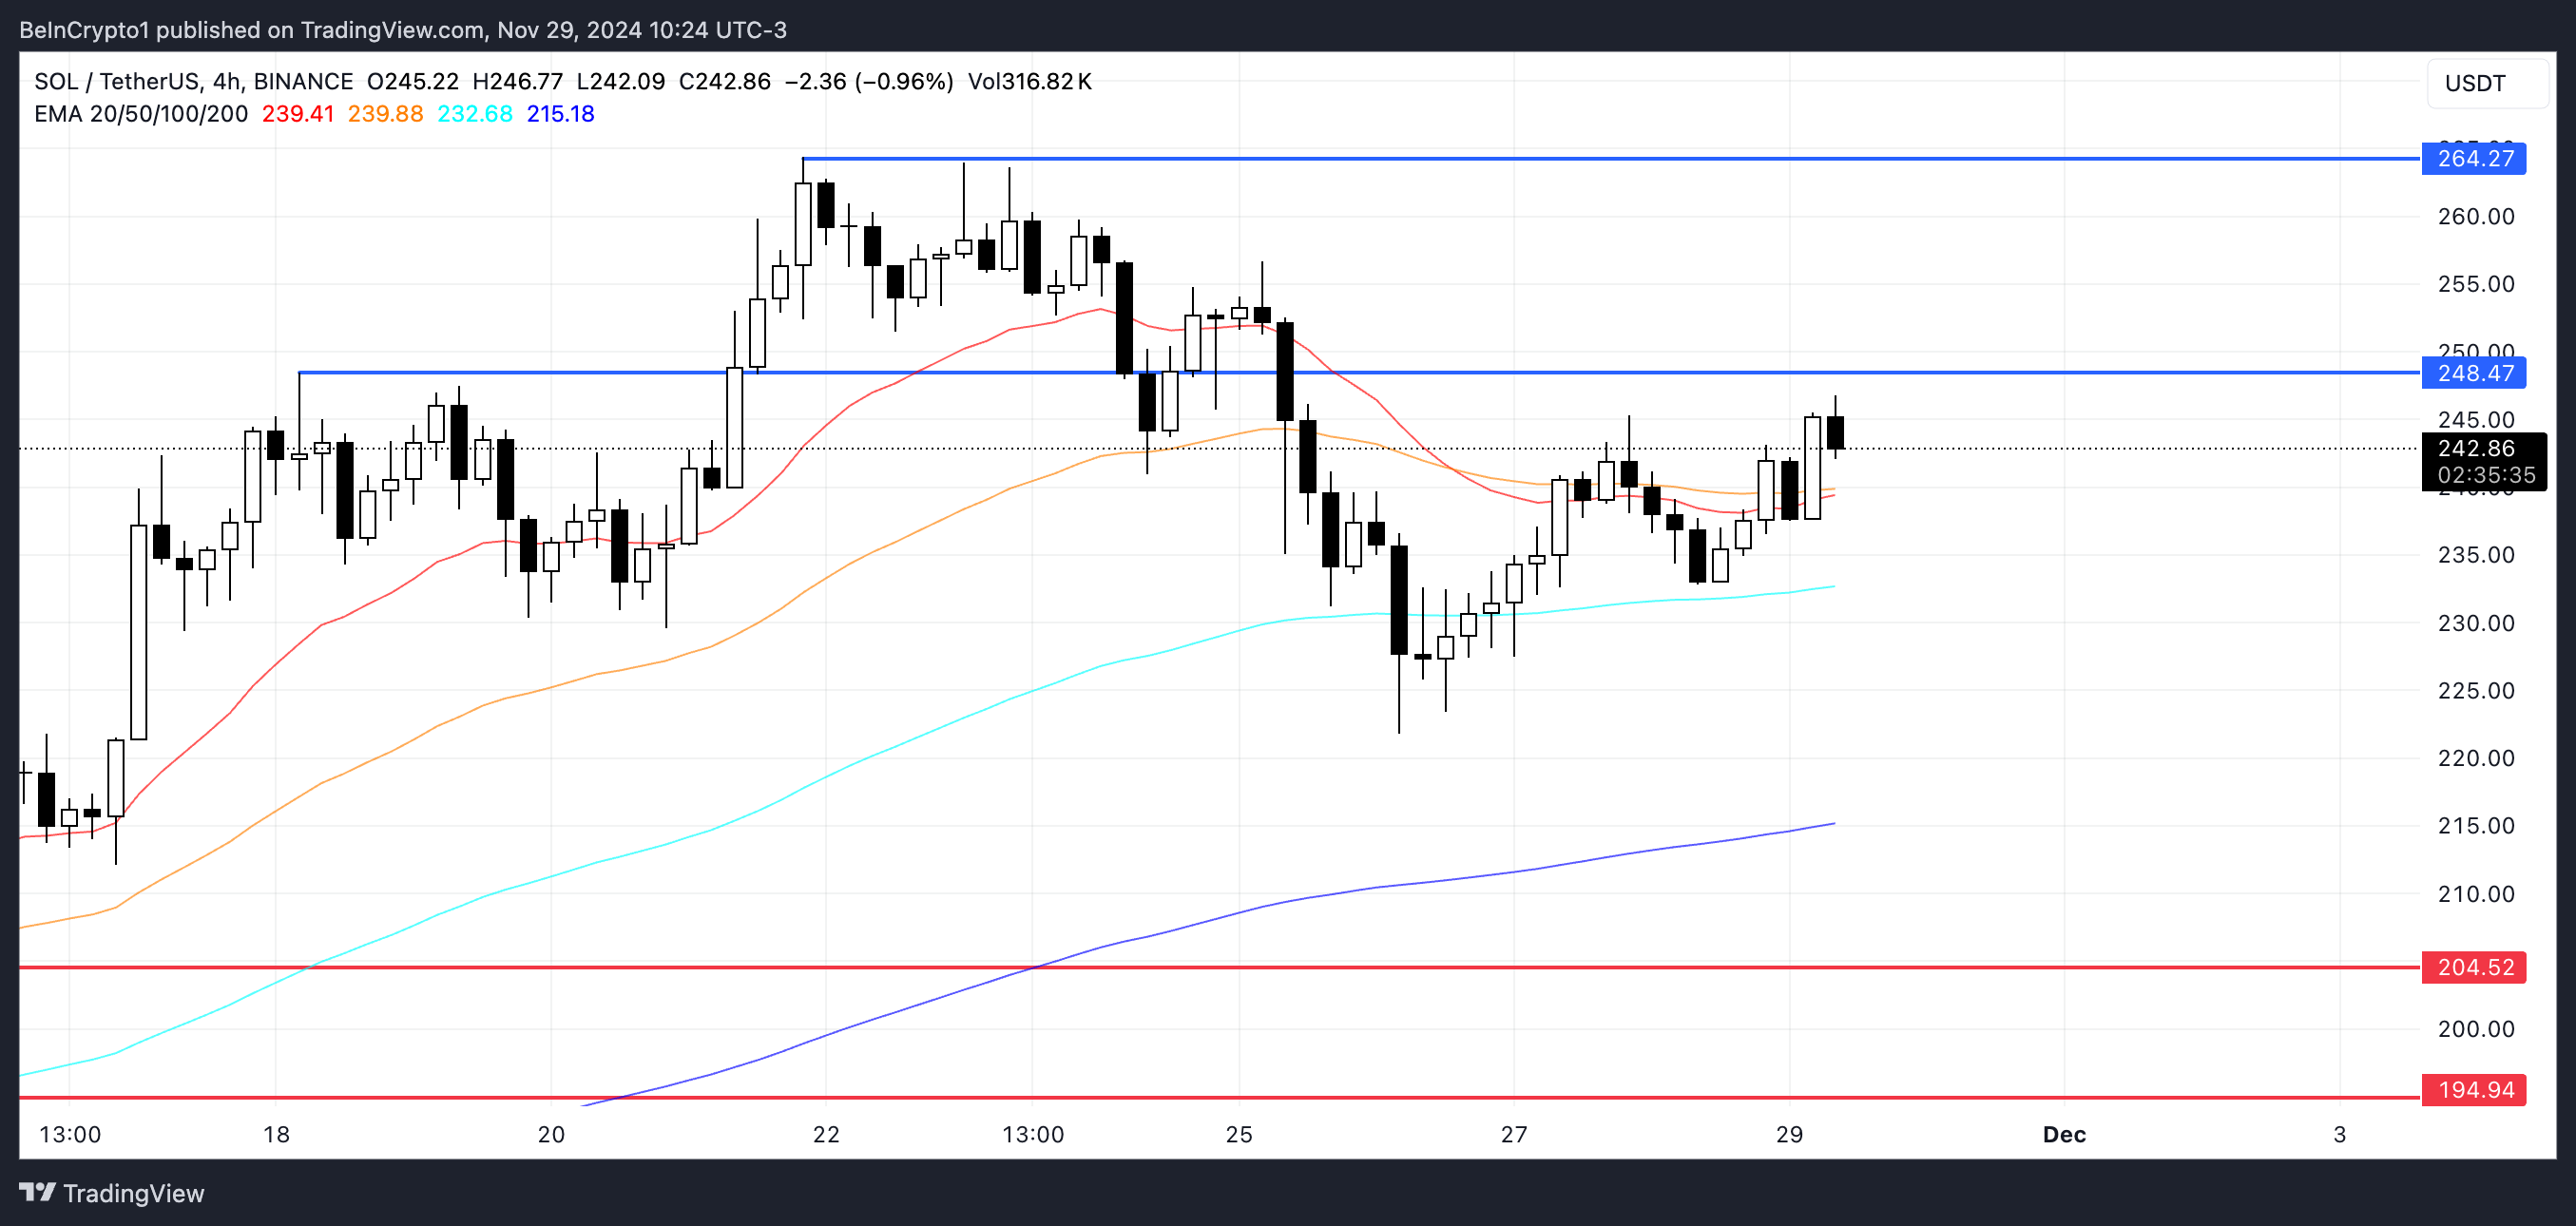
In 2024, Solana solidified itself as one of the most utilized chains, particularly favored by traders and meme coin projects.
The chain is attracting companies like Jito, Raydium, and Pumpfun, known for their record-breaking revenues, which shows its competitive edge. SOL could test new all-time highs and outpace BTC in December.
Dogecoin (DOGE)
Dogecoin has shown a strong historical positive correlation with Bitcoin, which has helped fuel its impressive 148.64% rise over the past month.
As Bitcoin approaches the $100,000 milestone, DOGE’s correlation with BTC positions it well to capitalize on the broader market’s bullish momentum.
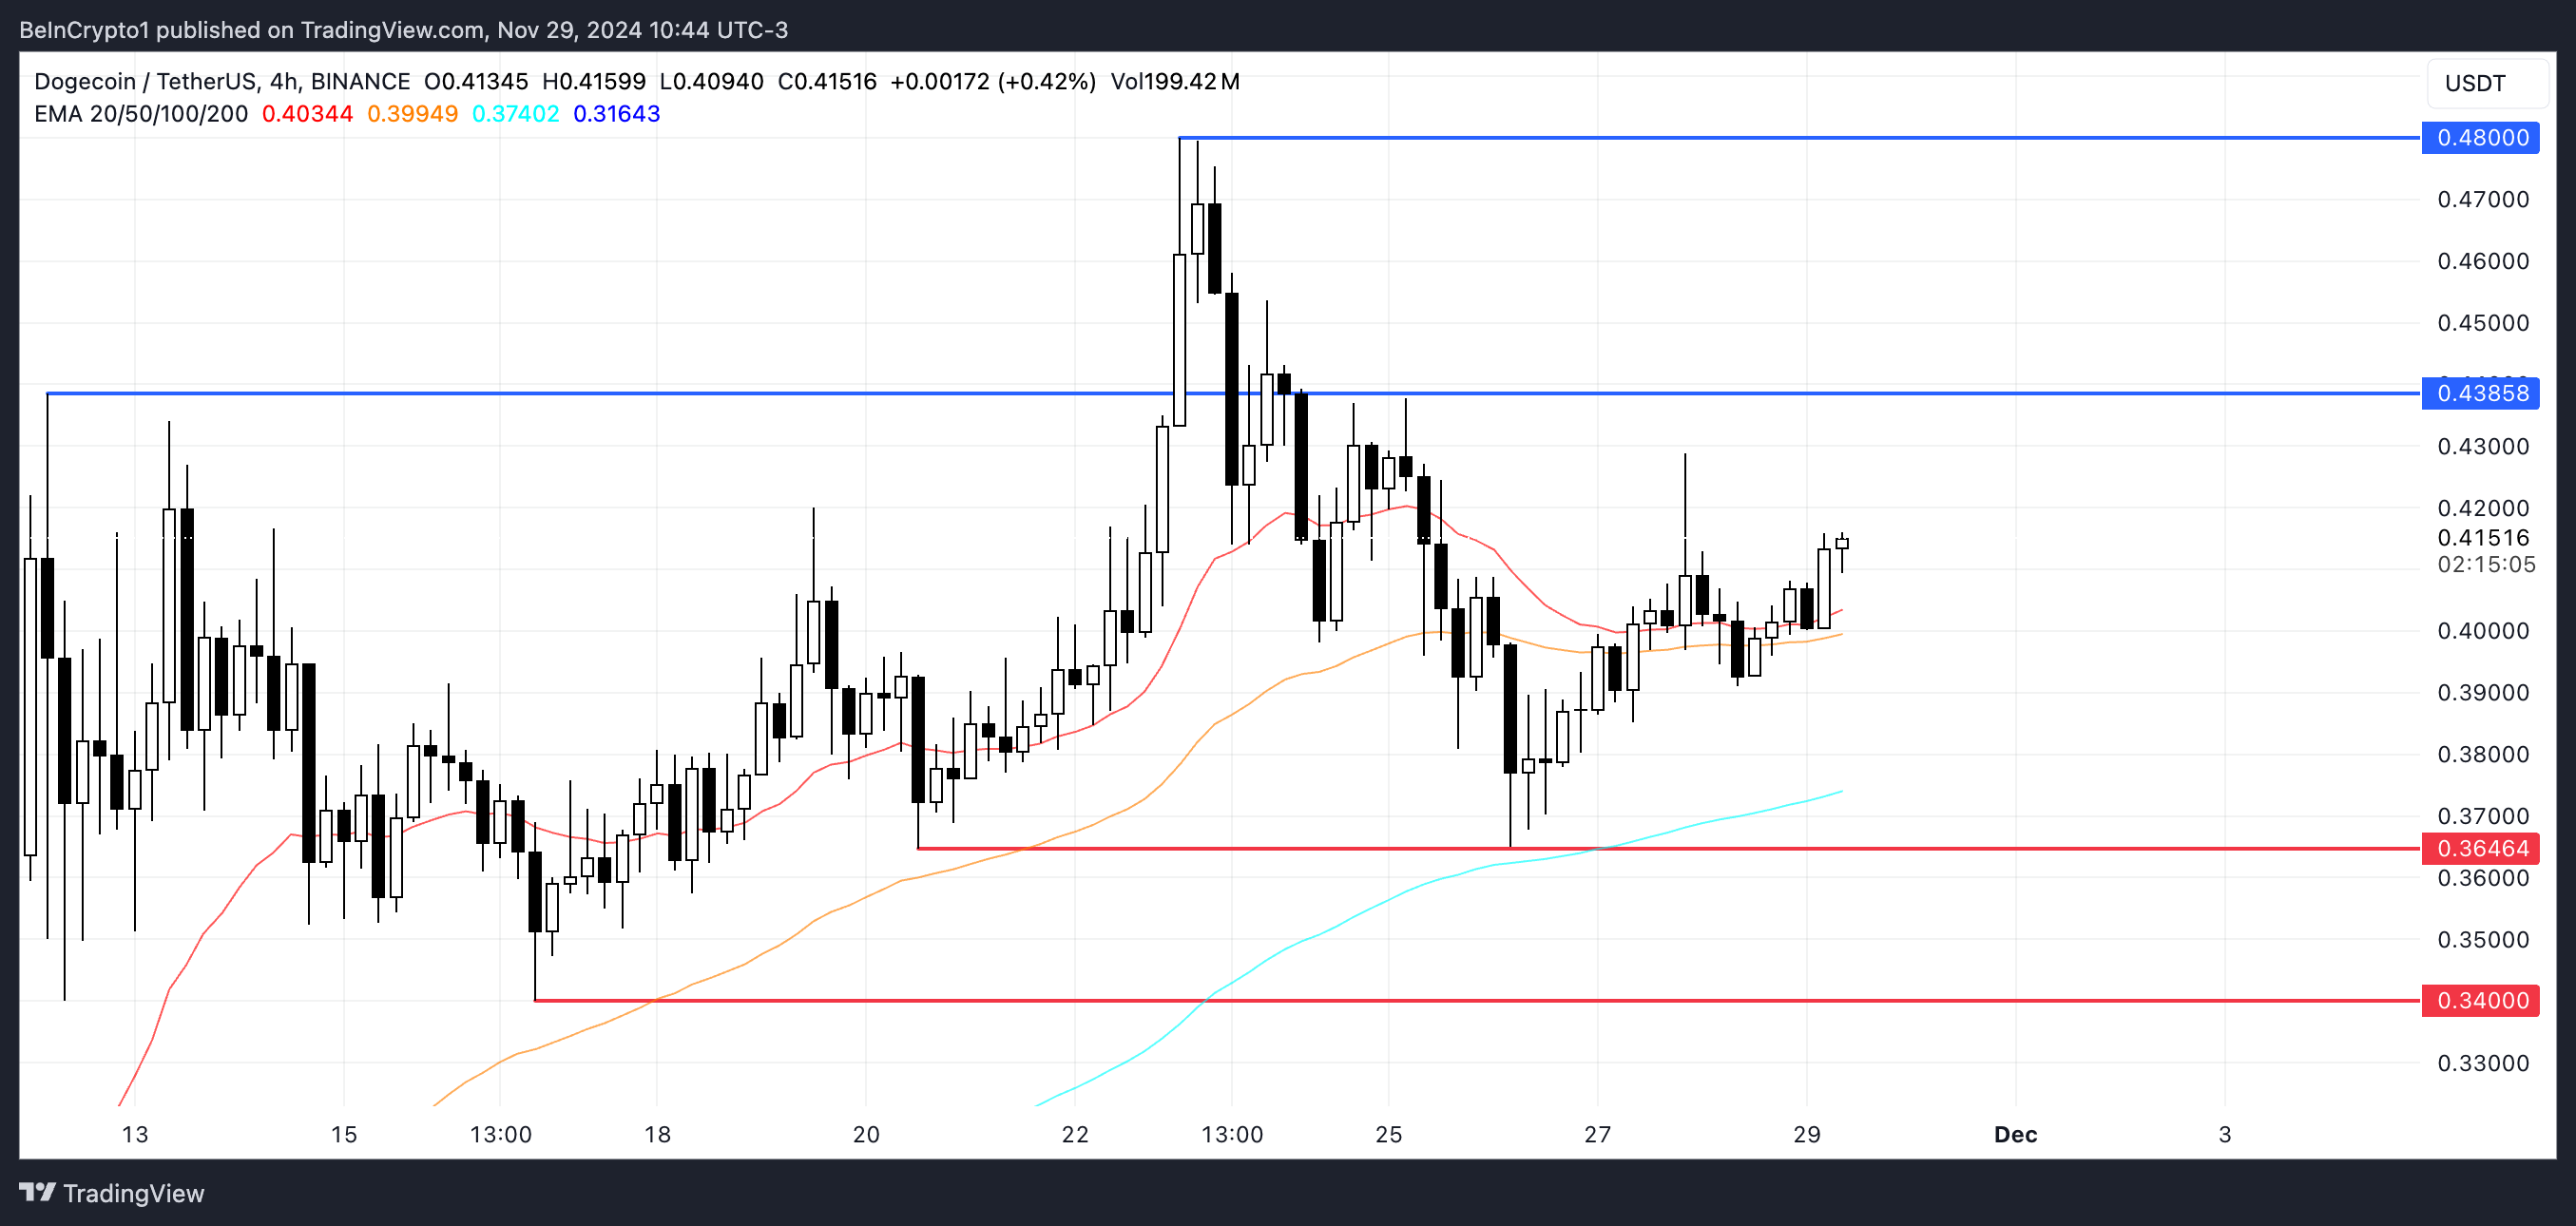
With a $60 billion market cap, Dogecoin dominates the meme coin market, surpassing the combined valuation of the next 15 largest meme coins.
This dominance reflects its unique position as the go-to asset in that category. If the meme coin season continues to gain traction alongside Bitcoin’s rally, DOGE is likely to attract more interest and volume.
Render (RENDER)
Render has surged 76% in the last 30 days, solidifying its status as one of the most significant artificial intelligence coins in the crypto market. Even with this recent surge, RENDER is still 35.09% below its previous all-time high, reached in March 2024.
Competing closely with TAO, RENDER has been alternating between the first and second positions among AI coins. Both boast a market cap of approximately $4.55 billion.
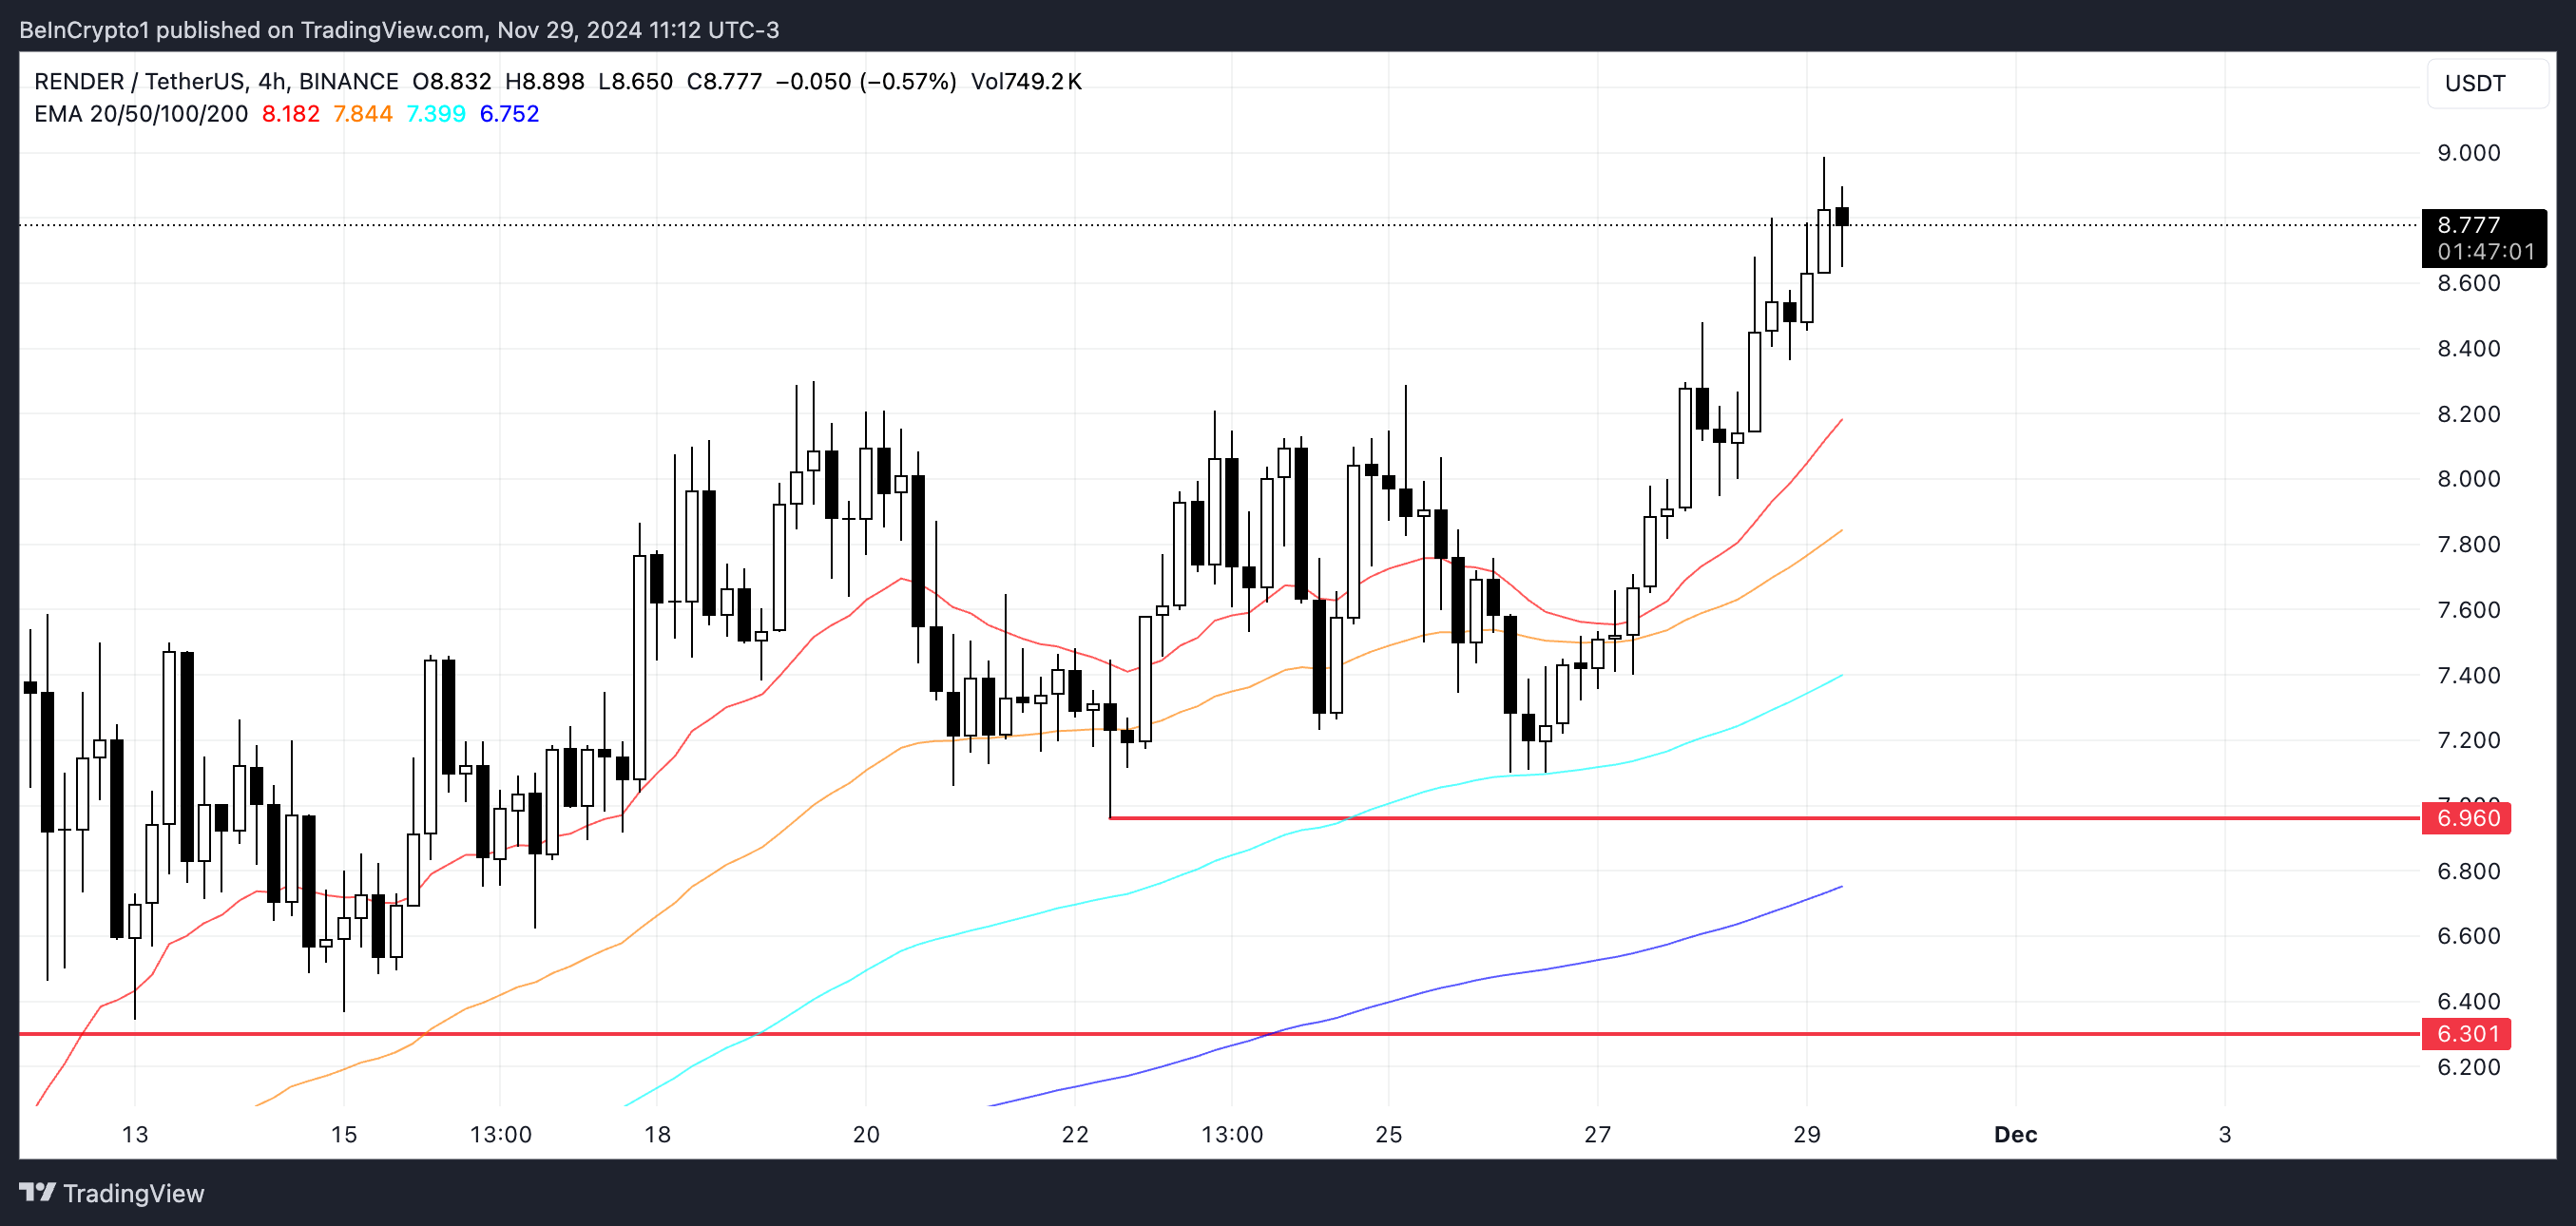
The growing narrative around AI altcoins, driven by advancements in crypto AI agents, has created substantial momentum for the sector.
If this trend continues, RENDER stands to benefit from increased adoption and interest, potentially outpacing Bitcoin’s growth and maintaining its upward trajectory into December.
Disclaimer
In line with the Trust Project guidelines, this price analysis article is for informational purposes only and should not be considered financial or investment advice. BeInCrypto is committed to accurate, unbiased reporting, but market conditions are subject to change without notice. Always conduct your own research and consult with a professional before making any financial decisions. Please note that our Terms and Conditions, Privacy Policy, and Disclaimers have been updated.
Market
PNUT Price Surges as Metrics Signals Strengthening Uptrend

PNUT price is gaining attention as one of the top 10 biggest meme coins in the market. The token has shown signs of bullish momentum, with its ADX rising and RSI nearing overbought levels, suggesting room for continued growth.
If the uptrend strengthens, PNUT could test $1.87 and even $2.50, challenging POPCAT’s position in the rankings. However, a loss of momentum could see PNUT face significant corrections, testing support levels as low as $0.41.
PNUT Buying Pressure Is Increasing
PNUT price is currently in an uptrend, with its ADX climbing to 17.5 from below 9 just a day ago, signaling improving trend strength. The ADX, or Average Directional Index, measures the strength of a trend on a scale from 0 to 100, without indicating its direction.
Values above 25 indicate a strong trend, while values below 20 suggest a weak or no trend. The current ADX level reflects that while PNUT’s uptrend is not yet strong, the significant increase suggests momentum is building.

The rapid rise in ADX indicates that buying pressure may be increasing, creating the potential for a stronger uptrend if the trend gains further traction.
Although still below the 25 threshold, which marks a strong trend, this upward shift in ADX highlights the possibility of continued price growth if current conditions persist.
PNUT RSI Keeps Rising
PNUT’s RSI is currently at 64.7, climbing significantly from below 50 just a day ago, indicating strengthening bullish momentum. The RSI, or Relative Strength Index, measures the speed and magnitude of price changes on a scale from 0 to 100.
Values above 70 suggest overbought conditions and potential for a pullback, while values below 30 indicate oversold conditions, often signaling a possible rebound. With its current level approaching the overbought zone, PNUT reflects strong buying activity but still has room for further growth.

Since PNUT price has not entered the overbought zone above 70 since November 14, its current RSI suggests the uptrend could continue before hitting resistance. Historically, RSI levels nearing 70 have coincided with periods of strong price increases, leaving room for additional upward movement.
If buying pressure persists, PNUT price could extend its rally further before reaching overbought territory, offering more opportunities for gains in the short term.
PNUT Price Prediction: Can It Surpass POPCAT In Market Cap?
PNUT, now the 9th largest meme coin in the market, is showing signs of a strengthening uptrend. If it builds momentum and breaks through the $1.41 resistance, it could climb to $1.87.
A successful push past that level could see PNUT price testing $2.21 and potentially reaching $2.50 again, putting it in a strong position to surpass POPCAT in the meme coins rankings, as their difference today is roughly $20 million.
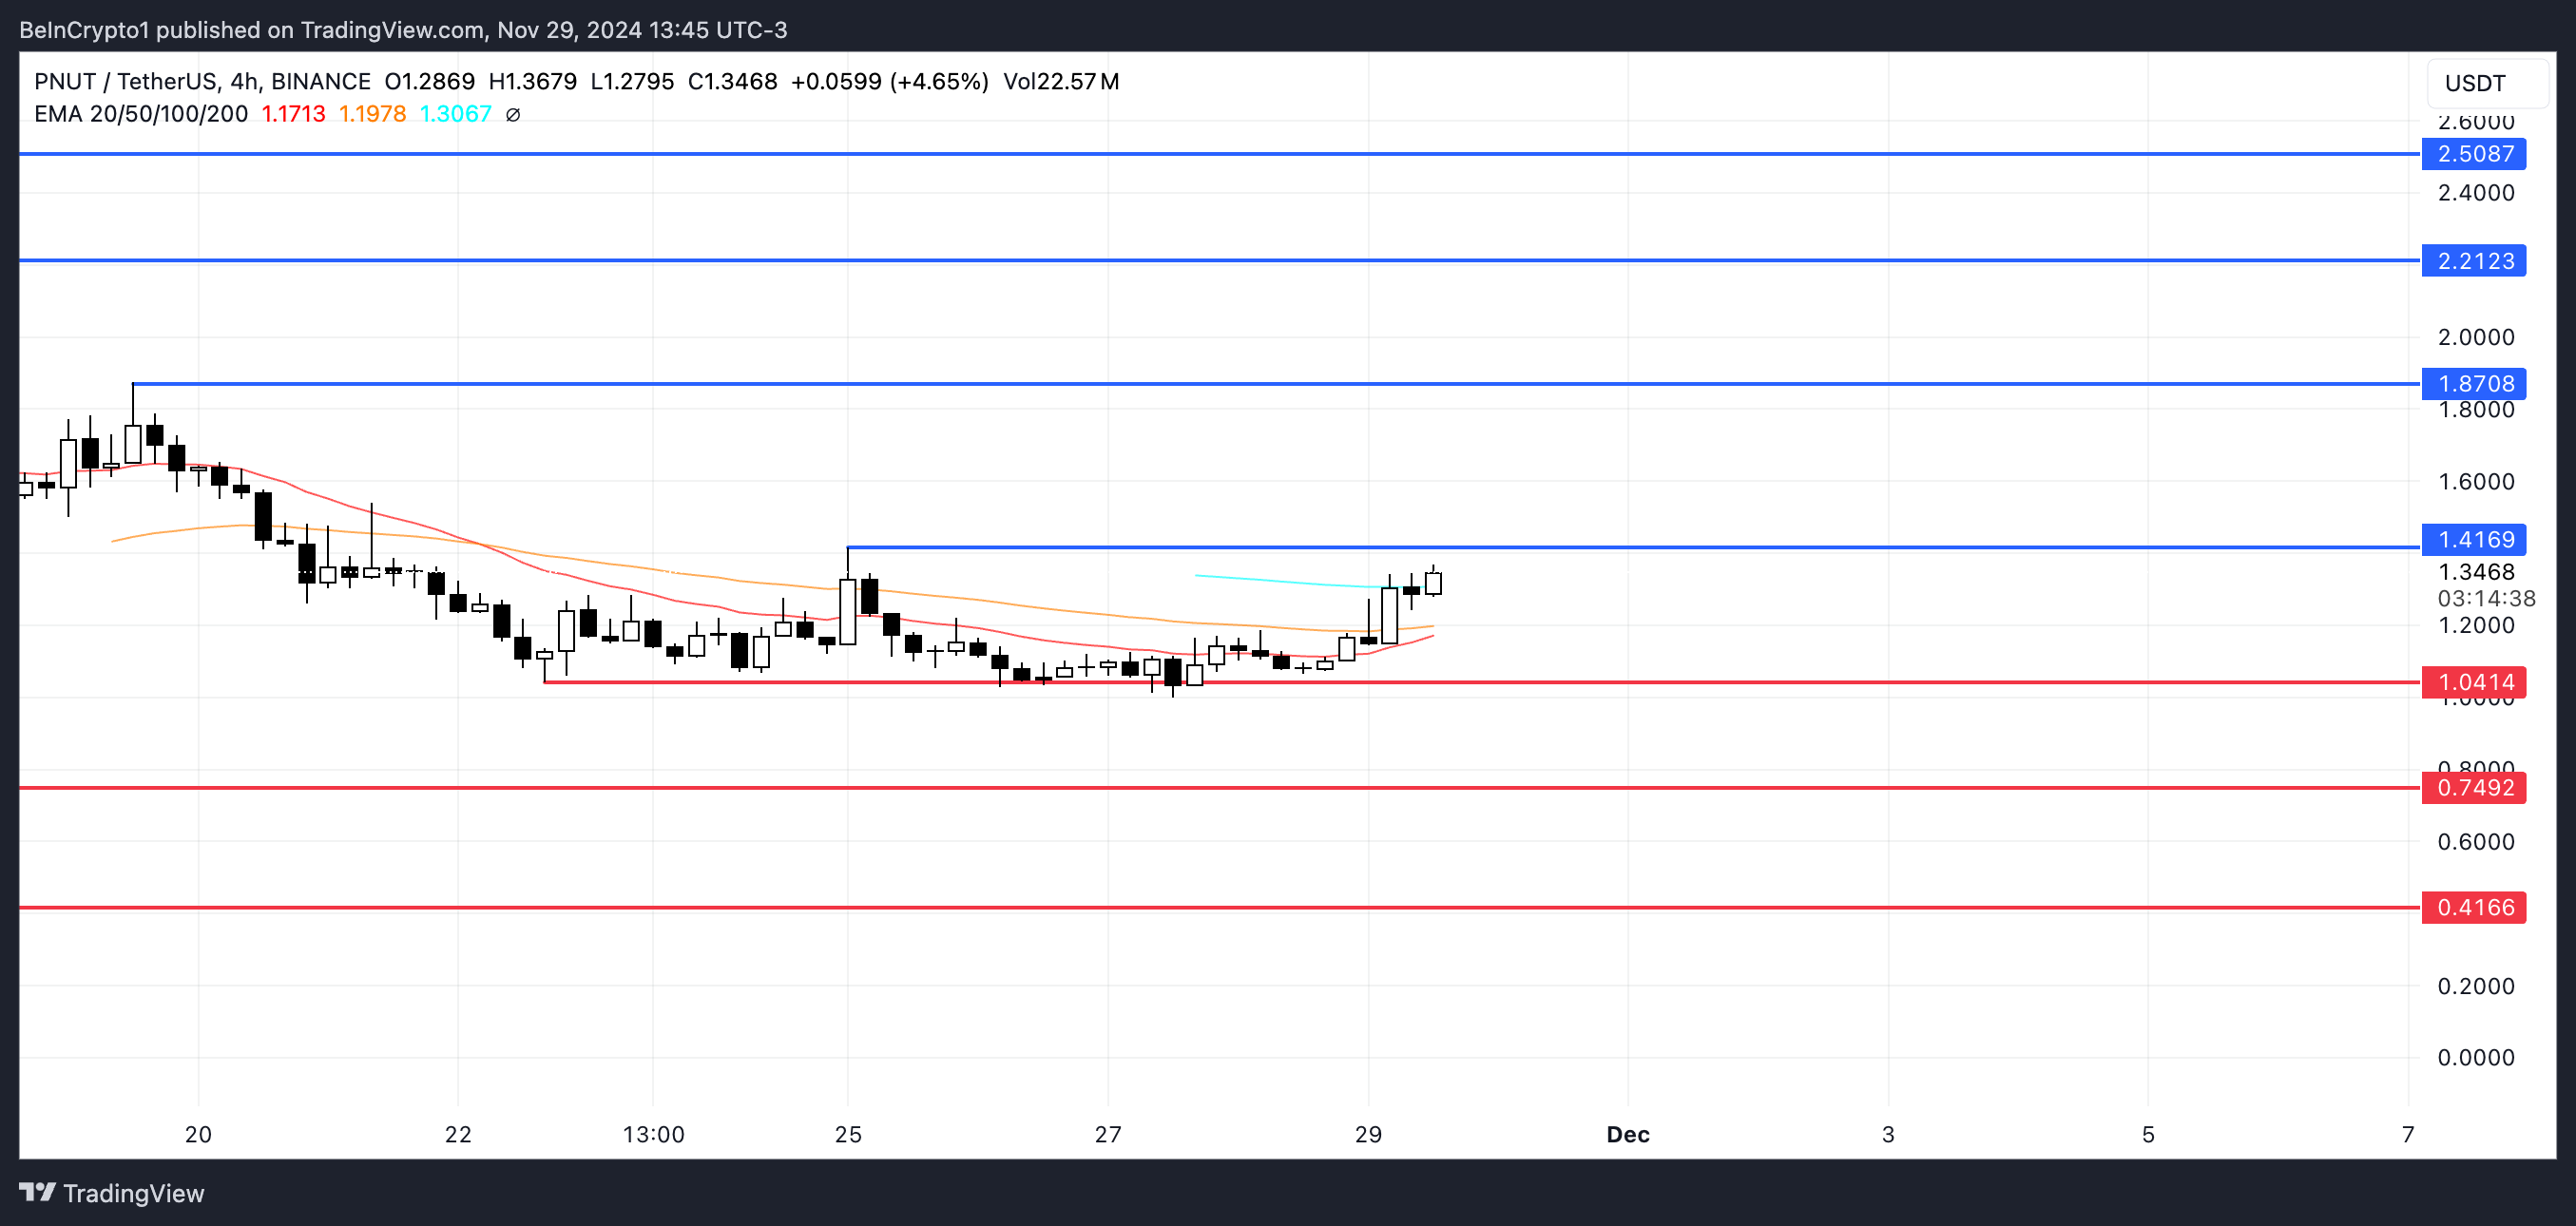
However, if the current uptrend loses steam, a reversal could lead PNUT price to test key support levels at $1.04 and $0.74. If those supports fail to hold, the price might drop further to $0.41, marking a significant correction.
Disclaimer
In line with the Trust Project guidelines, this price analysis article is for informational purposes only and should not be considered financial or investment advice. BeInCrypto is committed to accurate, unbiased reporting, but market conditions are subject to change without notice. Always conduct your own research and consult with a professional before making any financial decisions. Please note that our Terms and Conditions, Privacy Policy, and Disclaimers have been updated.
Market
Stellar (XLM) Price Return to $0.70 Could Be Postponed for Now

Stellar (XLM) price has surged over 400% in the last 30 days, marking one of the most significant rallies in November. After reaching $0.63, its highest price since 2021, XLM now faces potential consolidation as its trend indicators show signs of weakening.
Despite this, the uptrend remains intact, supported by strong market interest and bullish sentiment. If XLM can regain its momentum, it may target $0.70 next, continuing its remarkable ascent.
XLM Current Trend Is Losing Its Strength
Stellar DMI chart indicates an ADX of 23.6, down significantly from over 40 just two days ago, suggesting weakening trend momentum. The ADX, or Average Directional Index, measures the strength of a trend on a scale of 0 to 100 without indicating its direction. Values above 25 signal a strong trend, while values below 20 suggest a weak or no trend.
Although XLM price remains in an uptrend, the declining ADX reflects diminishing momentum, hinting at potential consolidation or a slowdown in the bullish movement.

With the positive directional indicator (D+) at 24.7 and the negative directional indicator (D-) at 14.9, XLM’s uptrend still shows a clear bullish bias. The higher D+ value highlights that buying pressure is currently outpacing selling pressure, supporting the continuation of the uptrend.
However, for the trend to regain strength, the ADX would need to climb back above 25, signaling stronger momentum. Until then, Stellar price may see more modest gains or a period of consolidation.
Stellar CMF Has Been Negative for 3 Days
XLM’s CMF currently stands at -0.16, marking a sustained negative trend since November 26 after being positive for four consecutive days. The CMF, or Chaikin Money Flow, measures capital inflows and outflows over a given period, with values above 0 signaling buying pressure and values below 0 indicating selling dominance.
A negative CMF value suggests that selling activity has outweighed buying, which could slow the current uptrend.

At -0.16, Stellar CMF indicates moderate selling pressure, potentially limiting its recent bullish momentum. While this value reflects a shift in sentiment, it remains less severe than more extreme negative levels seen during stronger corrections.
If the CMF trends further downward, it could signal a weakening uptrend and increase the likelihood of a price pullback. Conversely, if it returns to positive territory, it would reaffirm growing buying pressure and support continued price gains.
XLM Price Prediction: Can It Reach $0.7 In December?
Stellar price recently achieved $0.63, its highest price since 2021, showcasing impressive bullish momentum. XLM is up 433.84% in the last 30 days.
If the current uptrend regains strength, XLM price could retest this resistance level and potentially rise to $0.70, representing a 37% increase from current levels.
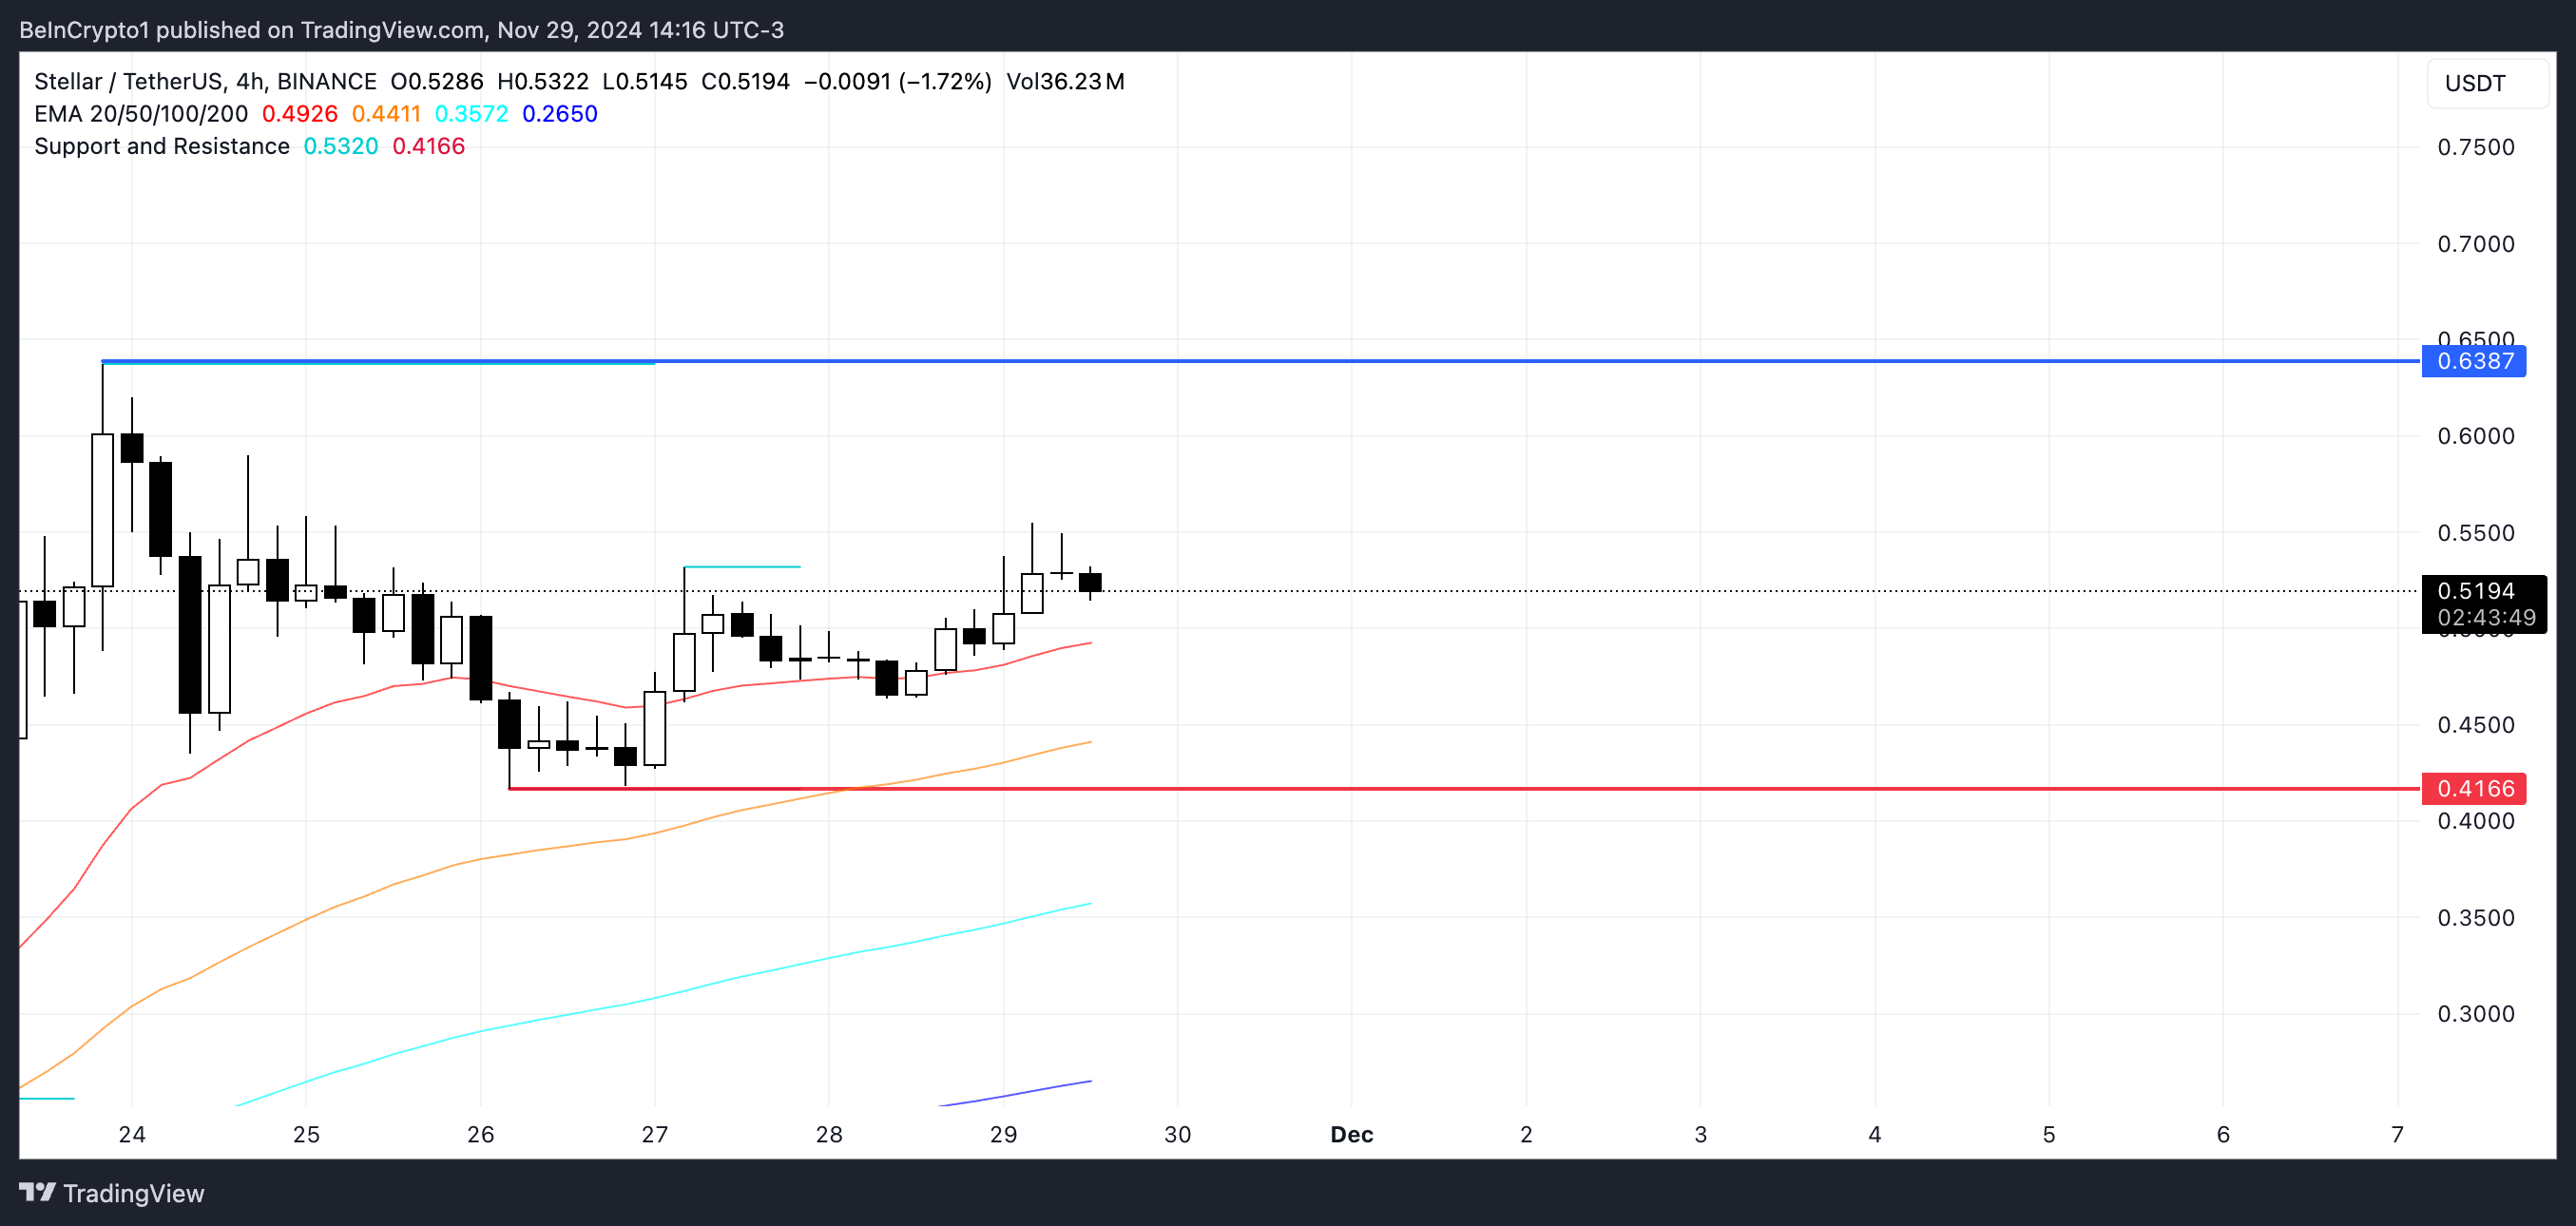
However, if the uptrend fails to sustain and selling pressure increases, XLM price could face a reversal. In this scenario, the token may test its key support at $0.41, a significant level to maintain its medium-term bullish outlook.
A failure to hold this support could signal a deeper correction and diminish the recent positive momentum.
The post Stellar (XLM) Price Return to $0.70 Could Be Postponed for Now appeared first on BeInCrypto.
-
 Regulation13 hours ago
Coinbase ends USDC rewards in EU amid MiCA compliance
-

 Market21 hours ago
A Springboard for More Gains?
-

 Altcoin21 hours ago
BTC AT $97K, XRP Rises 7%, ALGO Surges 23%
-

 Market24 hours ago
Dogecoin (DOGE) Price Struggles to Maintain Momentum
-

 Market23 hours ago
Trending Altcoins Today — November 28: THE, SUI, CHILLGUY
-

 Market17 hours ago
Warren, Gensler Tried to ‘Unlawfully Kill’ Crypto
-

 Market13 hours ago
What Are the Most Talked-About Altcoins Today, November 29?
-
 Altcoin17 hours ago
Ethereum Foundation Invests Millions Into zkVM, What’s Happening?


