Market
Ripple (XRP) Price Can Reach $2 If This Happens

Ripple (XRP) price has surged over 230% in the past 30 days, reaching its highest levels since 2018. The strong uptrend, supported by bullish indicators like RSI and CMF, suggests the potential for further gains.
If momentum continues, XRP could rise to $1.90 and even test $2, marking a 16% increase from current levels. However, if the trend weakens, XRP risks a correction to support levels at $1.21 or $1.05, representing a potential 39% decline.
XRP RSI Is Overbought, but the Uptrend Could Continue
Ripple RSI currently stands at 74.8, reflecting strong bullish momentum following its recent surge. The RSI, or Relative Strength Index, measures the speed and magnitude of price changes on a scale of 0 to 100. Values above 70 indicate overbought conditions and the potential for a correction, while values below 30 suggest oversold conditions and potential recovery.
Being above 70 places XRP in the overbought zone, signaling heightened buying activity and possible caution for traders.

However, historical trends show that XRP’s RSI has previously climbed beyond 70, often reaching levels as high as 80 or even 90 before corrections occur.
This indicates that despite being in the overbought territory, Ripple price could still push higher in the short term. If the current momentum continues, XRP may extend its rally further before any significant pullback occurs, making it crucial to monitor the RSI’s trajectory closely.
Ripple CMF Is Now Positive, but Not That High Yet
XRP CMF is currently at 0.08, reflecting a notable shift from nearly -0.10 just a day ago. The CMF, or Chaikin Money Flow, measures the flow of capital into or out of an asset based on price and volume over time.
Positive CMF values indicate net capital inflows and buying pressure, while negative values suggest outflows and selling dominance. The move into positive territory highlights growing confidence among buyers and supports the recent price momentum.

While a CMF of 0.08 is positive, it remains significantly below levels seen earlier in November, such as 0.30 and 0.20 during major bullish periods. This suggests that while buying pressure has returned, it is not yet as strong as during previous surges.
If CMF continues to rise, it could signal further growth for XRP price, with room for the uptrend to gain additional strength in the coming days.
Ripple Price Prediction: Can It Reach $2?
Ripple price is trading at its highest level since 2018, following an impressive 231.39% gain over the past 30 days. EMA Lines show XRP is currently in an uptrend. If that continues, XRP could reach $1.90, an 11% increase, and even test $2, marking a 16% rise.
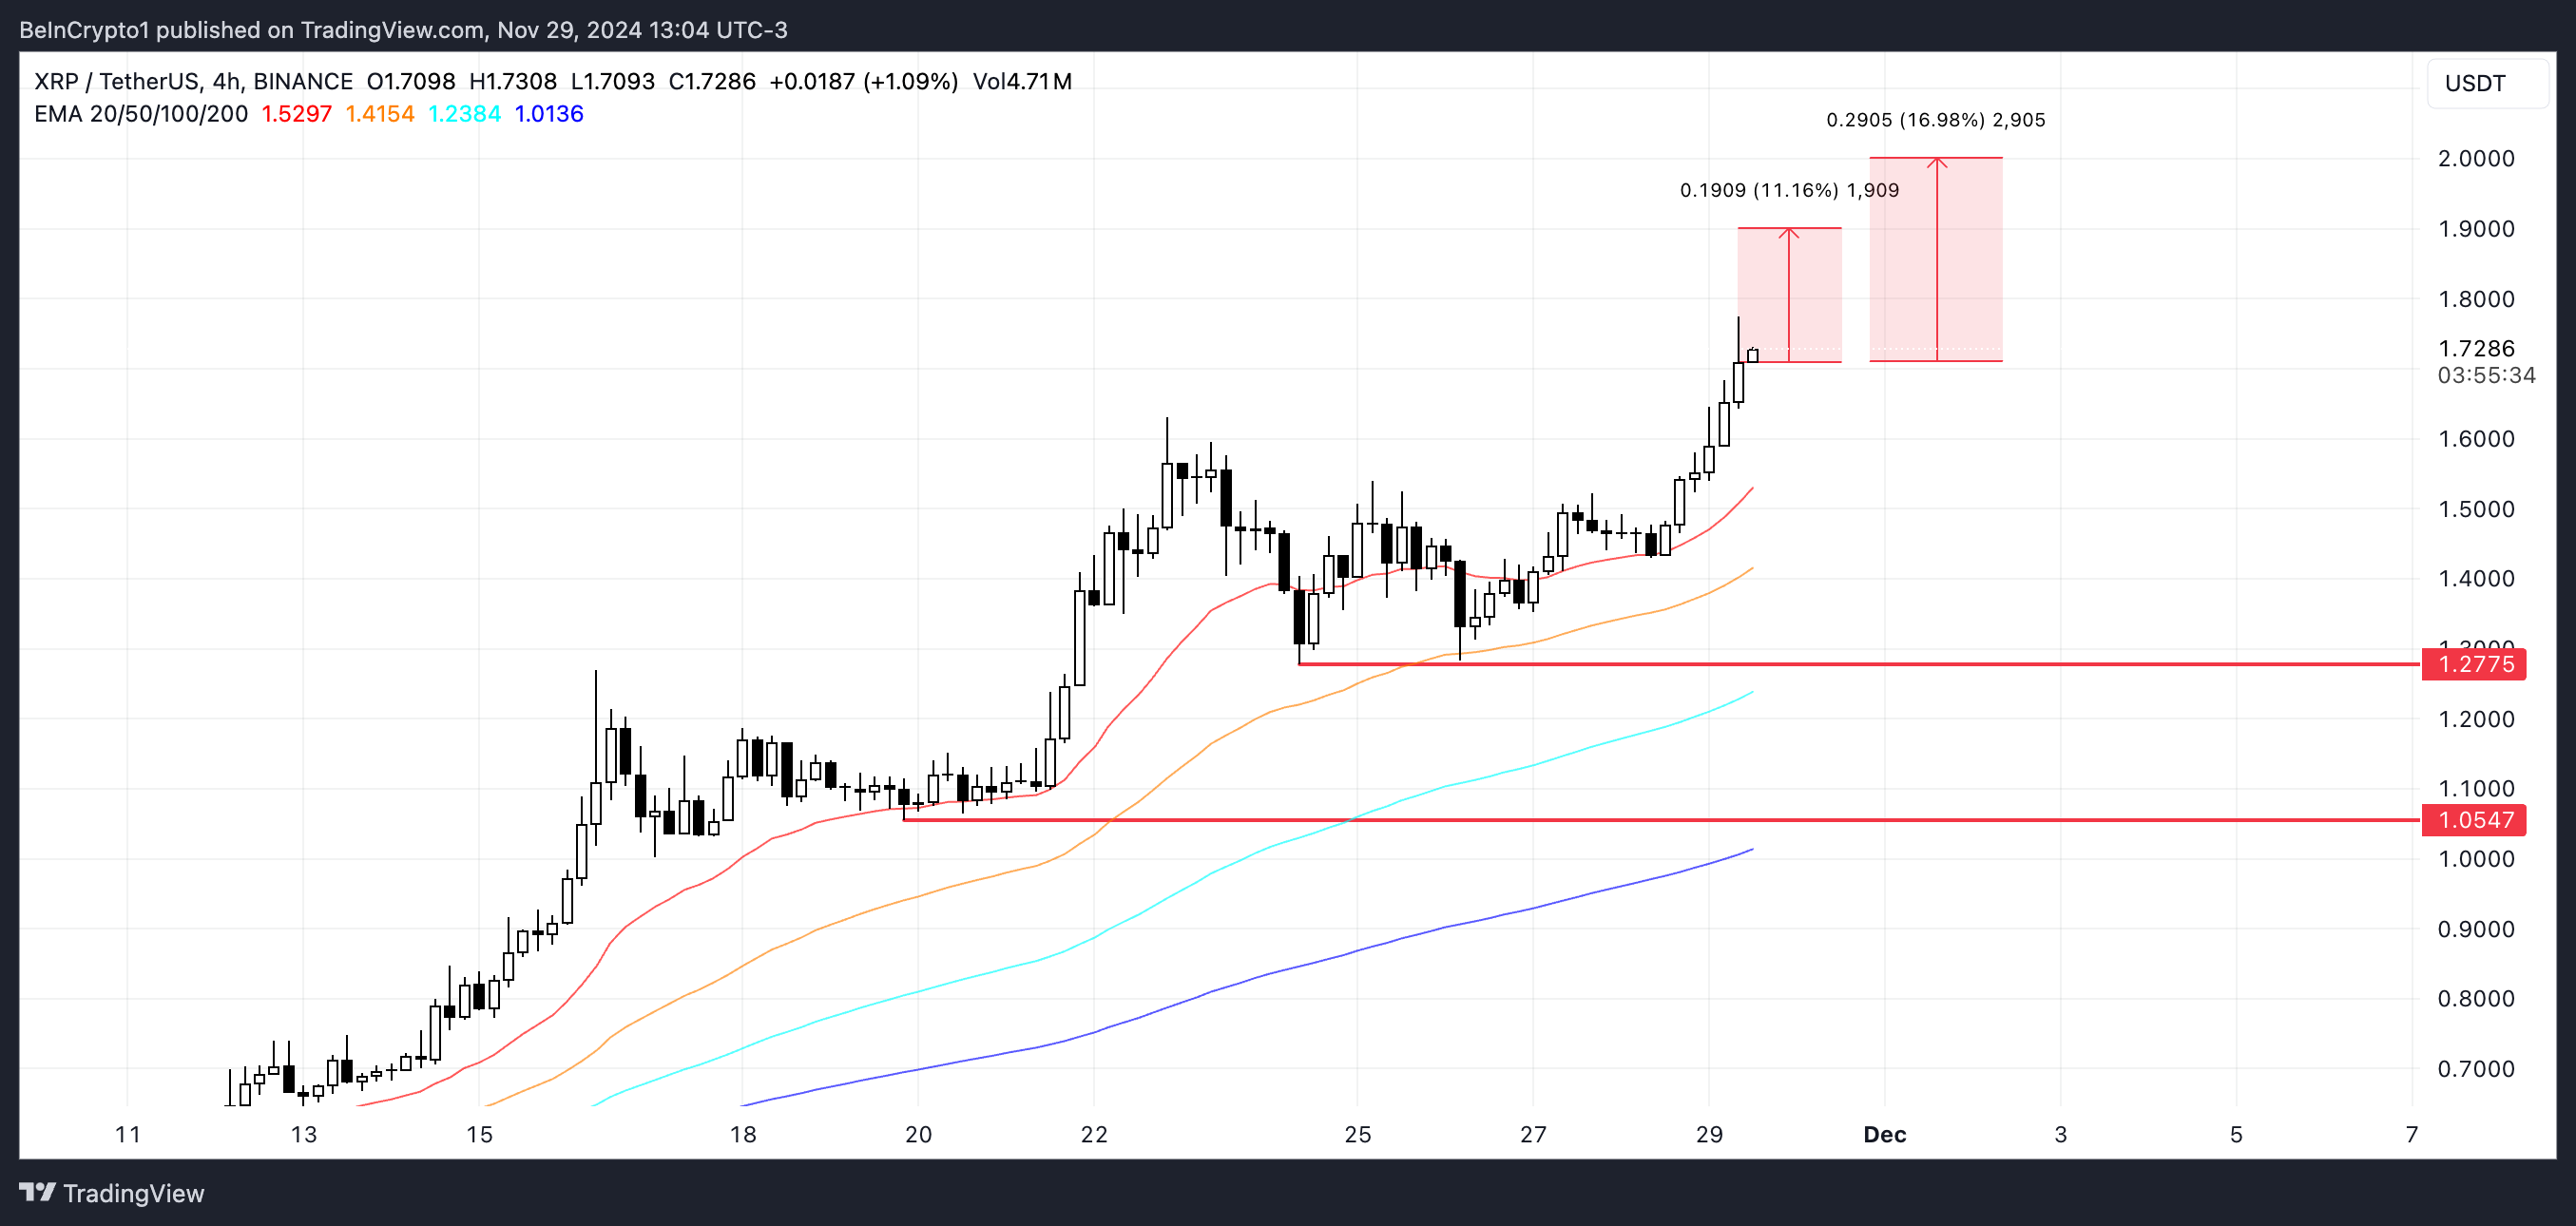
However, if the uptrend weakens, XRP price could face a correction, with key support levels at $1.21 and $1.05. A drop to these levels would represent a potential 39% decline, highlighting the importance of maintaining bullish momentum to avoid a significant pullback.
The post Ripple (XRP) Price Can Reach $2 If This Happens appeared first on BeInCrypto.
Market
Bitcoin Price Drops Below $80,000 Amid Heavy Weekend Selloff

Bitcoin fell below the $80,000 mark on Sunday as investor sentiment weakened across global markets. The move came alongside a spike in daily liquidations, which totaled $590 million.
Heightened anxiety over former President Donald Trump’s proposed tariffs and escalating geopolitical tensions weighed heavily on risk assets.
More Traders are Shorting Bitcoin After the Worst Q1 In a Decade
The long-short ratio for Bitcoin dropped to 0.89, with short positions now accounting for nearly 53% of activity. The shift reflects growing skepticism about Bitcoin’s short-term direction.
Traditional markets also suffered sharp losses. The Nasdaq 100, S&P 500, and Dow Jones all entered correction territory last week, posting their worst weekly performance since 2020.

Bitcoin closed the first quarter with a loss of 11.7%, making it the weakest Q1 since 2014.
The broader crypto market lost 2.45% on Sunday, reducing total market capitalization to $2.59 trillion. Bitcoin remains the dominant asset, holding 62% of the market share. Ethereum follows with 8%.
Sunday’s selloff triggered $252.79 million in crypto derivatives liquidations. Long positions made up the bulk of that figure at $207 million. Ethereum traders accounted for about $72 million in long liquidations alone.
Bitcoin’s price remains closely tied to shifts in global liquidity, often reflecting broader macro trends. With U.S. markets set to open Monday, this weekend’s activity signals continued volatility ahead.

Investors may face more pressure after Federal Reserve Chair Jerome Powell warned that Trump’s tariff plans could push inflation higher while slowing economic growth.
That combination raises the risk of stagflation, a situation where policy tools become less effective. Efforts to stimulate the economy can worsen inflation, while measures to control prices can limit growth.
Disclaimer
In adherence to the Trust Project guidelines, BeInCrypto is committed to unbiased, transparent reporting. This news article aims to provide accurate, timely information. However, readers are advised to verify facts independently and consult with a professional before making any decisions based on this content. Please note that our Terms and Conditions, Privacy Policy, and Disclaimers have been updated.
Market
Avalanche Price Holds Under $20, Low Selling Can’t Lift Price

Avalanche (AVAX) price has been unable to reclaim the $20.00 support level after falling through it in the recent correction. The altcoin is now trading well below that key mark despite a noticeable decline in selling pressure.
However, bullish momentum has not been strong enough to counter prevailing bearish cues.
Avalanche Investors Are Not Selling
Analyzing the active address profitability reveals that less than 3% of current participants are in profit. This data highlights a crucial detail: most AVAX holders are unwilling to sell at a loss. Instead, they appear to be HODLing in anticipation of a recovery. This lack of selling is a bullish indicator.
The patience shown by investors during this downturn could help Avalanche establish a stronger base once broader market conditions stabilize. As fewer holders are actively selling, downward pressure on AVAX’s price is reduced. Given the right market catalysts, this opens a window for the altcoin to bounce back.

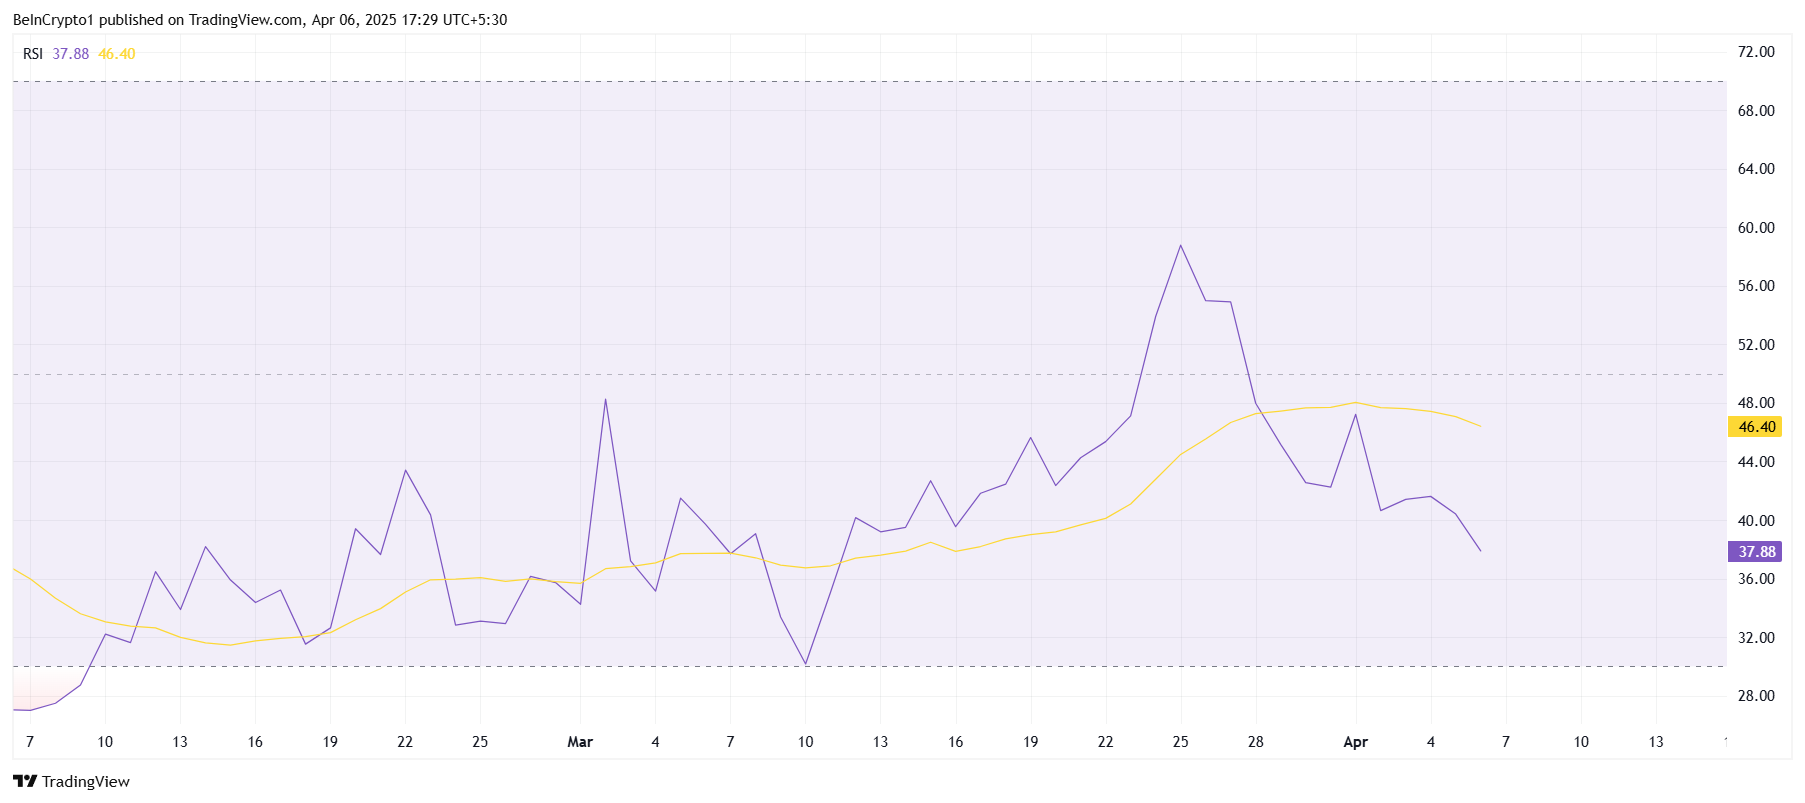
Despite low selling activity, the technical indicators continue to signal weakness. The Relative Strength Index (RSI) has dropped back into the bearish zone after a brief recovery attempt. This suggests a lack of buying pressure and continued uncertainty among investors.
Market support has been lacking for AVAX in recent sessions, preventing a meaningful rebound. The altcoin is facing consistent resistance and has failed to generate strong upward momentum.
The RSI trend reinforces that the macro environment is still leaning bearish, keeping Avalanche subdued.
AVAX Price Is Vulnerable
Avalanche is currently priced at $17.19, marking a 25% decline over the past two weeks. The sharp drop came after AVAX failed to break through the $22.87 resistance level. This rejection led to the current consolidation below $20.00, with bulls unable to reverse the trend.
Given the existing market cues, Avalanche may struggle to reclaim $18.27 as a support level. If the altcoin fails to secure this level, it risks dropping further to $16.25. This would deepen investor losses and delay any chances of recovery.
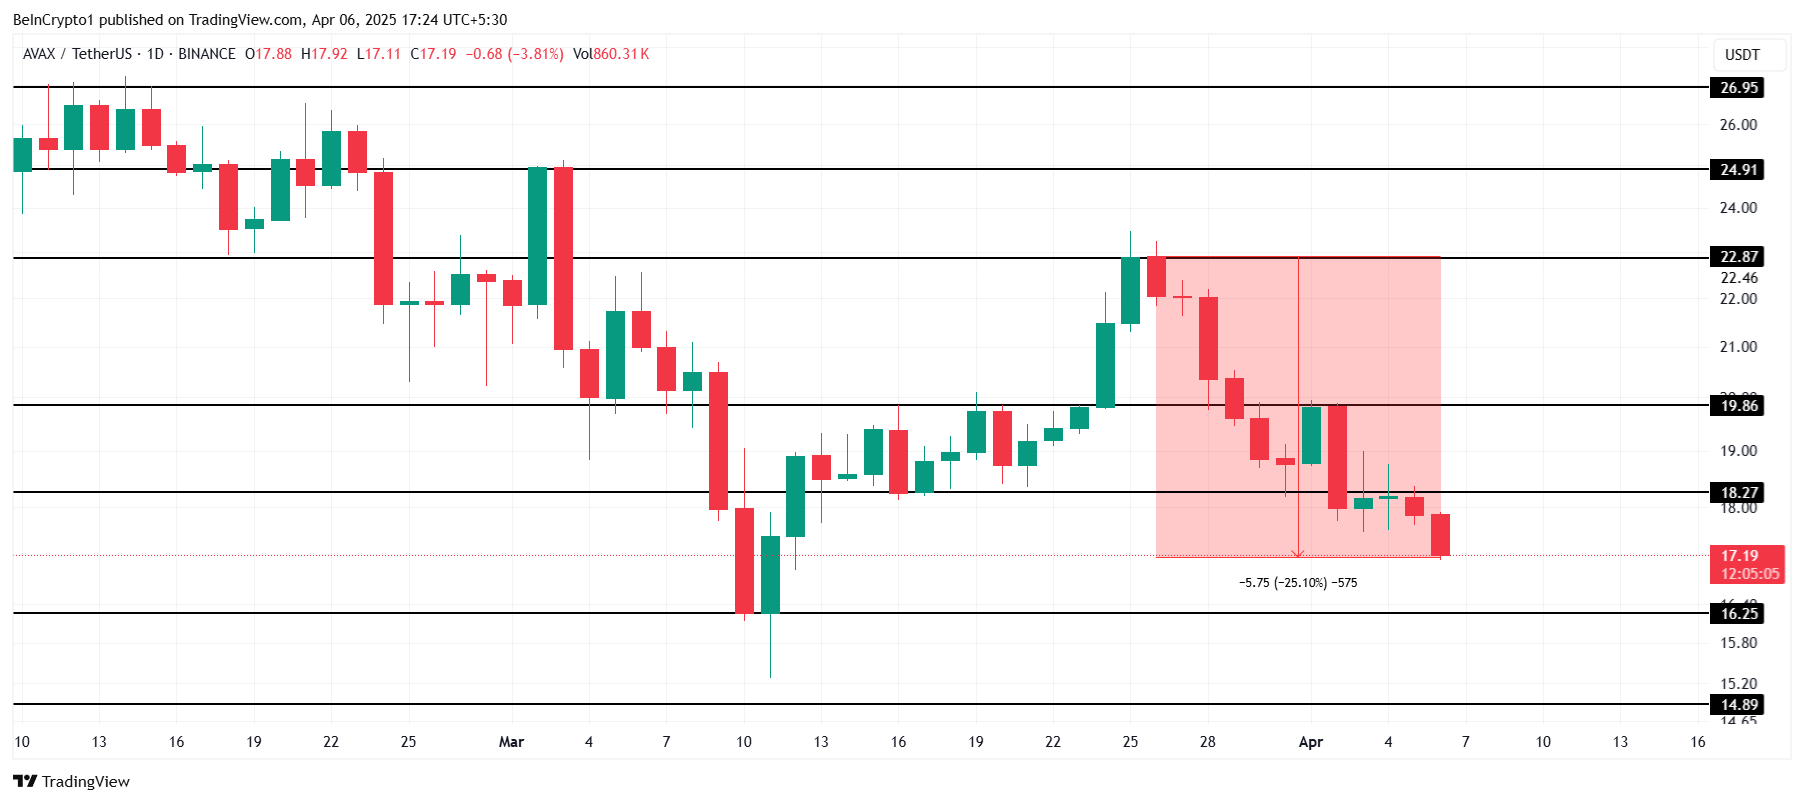
On the upside, a key shift would occur if AVAX can flip $19.86 into support. This would suggest strengthening bullish sentiment and open the door for a rally toward $22.87. Reclaiming this level could allow Avalanche to recover some recent losses and restore investor confidence.
Disclaimer
In line with the Trust Project guidelines, this price analysis article is for informational purposes only and should not be considered financial or investment advice. BeInCrypto is committed to accurate, unbiased reporting, but market conditions are subject to change without notice. Always conduct your own research and consult with a professional before making any financial decisions. Please note that our Terms and Conditions, Privacy Policy, and Disclaimers have been updated.
Market
Justin Sun Claims First Digital Trust Fraud Exceeds Impact of FTX


TRON founder Justin Sun is intensifying his accusations against First Digital Trust (FDT), the issuer of the FDUSD stablecoin, who he claims embezzled $500 million of its clients’ funds.
In an April 5 post on X, Sun compared FDT to the now-defunct FTX exchange, claiming the FDT case is “ten times worse.” FTX filed for bankruptcy in November 2022 after a bank run revealed an $8 billion shortfall in its assets.
Justin Sun Compares First Digital Trust to FTX
Sun argued that while FTX misused user funds, the exchange at least maintained an internal system that portrayed the activity as pledged loans.
He explained that FTX used assets like FTT, SRM, and MAPS tokens as collateral in transactions that, on the surface, had some structure. In contrast, Sun claims First Digital Trust outright stole funds without user consent or any internal pledge mechanism.
“FDT simply siphoned off $456m from TUSD’s custodial funds without client authorization or knowledge, and booked as loans to a dubious third party Dubai company without any collaterals,” Sun claimed.
The Tron founder further asserted that the now-convicted FTX founder Sam Bankman-Fried (SBF) indeed misused funds. However, Sun noted much of that capital went into investments in reputable firms such as Robinhood and AI company Anthropic.
On the other hand, Sun alleged that FDT diverted user assets into private entities for personal gain without any meaningful investment.
Sun also took aim at FDT CEO Vincent Chok Zhuo, criticizing his apparent indifference following the exposure of the alleged misconduct.
According to him, Chok has shown no intention of taking responsibility. This contrasts with SBF, who took steps to recover user assets and cooperated with authorities.
“Vincent Chok has acted deceptively and maliciously, pretending nothing happened when exposed,” Sun stated.
Considering this development, the TRON founder urged Hong Kong authorities to take swift action. He called for a response similar to that of US regulators during the FTX collapse.
Sun emphasized that Hong Kong’s reputation as a global financial hub is at risk and called for immediate enforcement to prevent further damage.
“Hong Kong must act like its US counterparts—swiftly, decisively, and effectively. We cannot allow the fraudsters continue its pyramid scheme against the public,” the crypto entrepreneur concluded.
To support investigations, Sun has launched a $50 million bounty program aimed at exposing the alleged misconduct. He also met with Hong Kong lawmaker Johnny Wu to discuss potential regulatory action.
Disclaimer
In adherence to the Trust Project guidelines, BeInCrypto is committed to unbiased, transparent reporting. This news article aims to provide accurate, timely information. However, readers are advised to verify facts independently and consult with a professional before making any decisions based on this content. Please note that our Terms and Conditions, Privacy Policy, and Disclaimers have been updated.
-

 Altcoin21 hours ago
What’s Next for ADA Price?
-

 Bitcoin22 hours ago
Bitcoin Indicator Signals Momentum Building – Capital Inflows Surge 350% In 2 Weeks
-

 Altcoin20 hours ago
XRP’s Open Interest Surges Above $3 Billion, Will Price Follow?
-

 Bitcoin20 hours ago
Bitcoin (BTC) To Take Off In June, Analyst Pins Market Target At $175,000
-

 Ethereum12 hours ago
Ethereum Whale Activity Fades Since Late February – Details
-
 Altcoin19 hours ago
Ethereum Price Threatens Decline To $1600 After Breakdown From Symmetrical Triangle
-

 Ethereum16 hours ago
Ethereum Whales Dump 500,000 ETH In 48 Hours: On-Chain Data
-

 Altcoin15 hours ago
Bitcoin Holds $83K Despite Macro Heat, What’s Happening?


