Market
Trending Altcoins Today — November 28: THE, SUI, CHILLGUY

This November, many altcoins have shown that they are ready to challenge Bitcoin’s (BTC) dominance. As a result, some of these cryptocurrency are part of the top trending assets.
While outperforming BTC is not the only reason these cryptos are on the list, BeInCrypto reveals other reasons in this analysis. Using CoinGecko data, the top three altcoins trending today, November 28, include Thena (THE), Sui (SUI), and Just a Chill Guy (CHILLGUY)
THENA (THE)
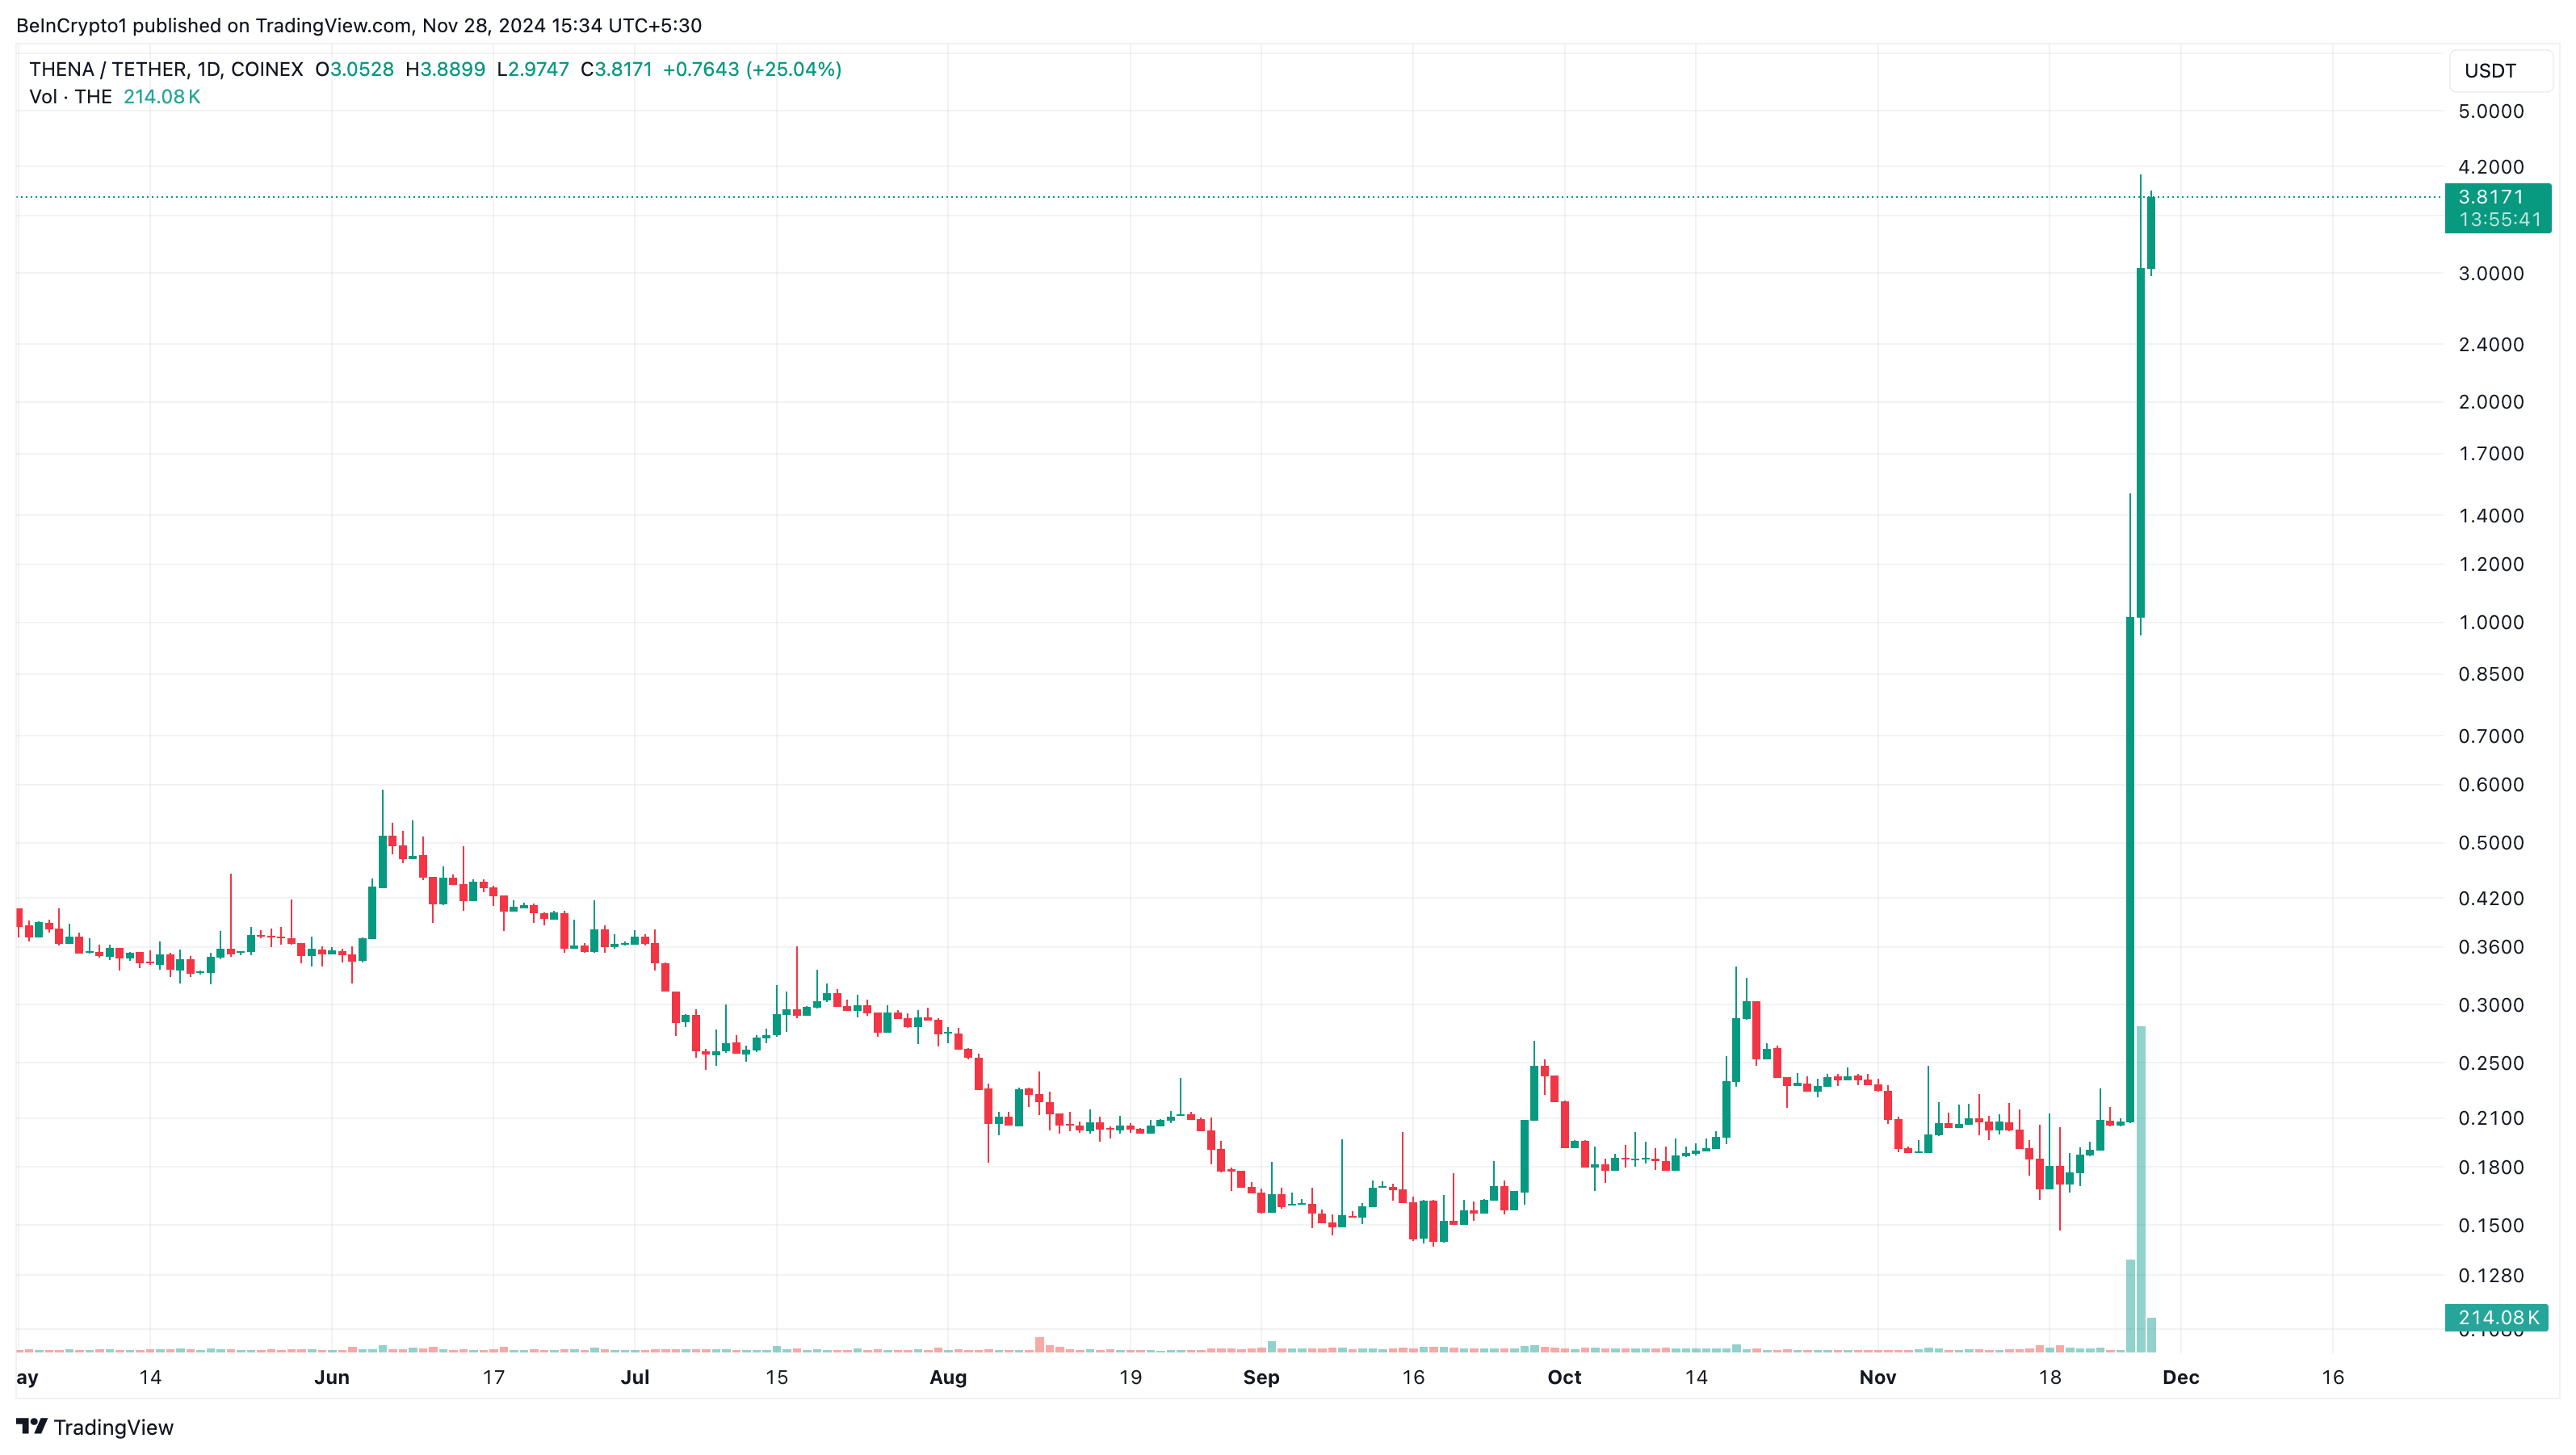
THE, the native token of the decentralized exchange built on the BNB Chain, is part of the trending altcoins today due to its price increase. In the last 24 hours, THENA’s price has increased by 130% and currently sits at $3.88.
This development was also aided by Binance’s support of the cryptocurrency through its listing some days ago. Before the development, THE was swinging between $0.15 and $0.50. However, it appears that the Binance listing has brought more attention to the altcoin.
As a result, the volume has also increased. Should volume continue to climb as well as the price, then THE could hit $5. On the other hand, if profit-taking increases, this might not happen. In that case, the value could decline below $2.
Sui (SUI)
Like THENA, Sui is also one of the trending altcoins today due to its price increase. However, it is important to note that the crypto did not replicate THE’s performance. Instead, it climbed slightly by 5% in the last 24 hours.
Despite the altcoin’s increase, the Money Flow Index (MFI) on the daily chart, has dropped below the neutral line. The MFI measures the level of buying and selling pressure around a cryptocurrency.
When it rises, it means buying pressure in the present. However, since it has dropped in SUI’s case, it indicates selling pressure. Considering this current condition, the altcoin’s value might drop to $2.38.
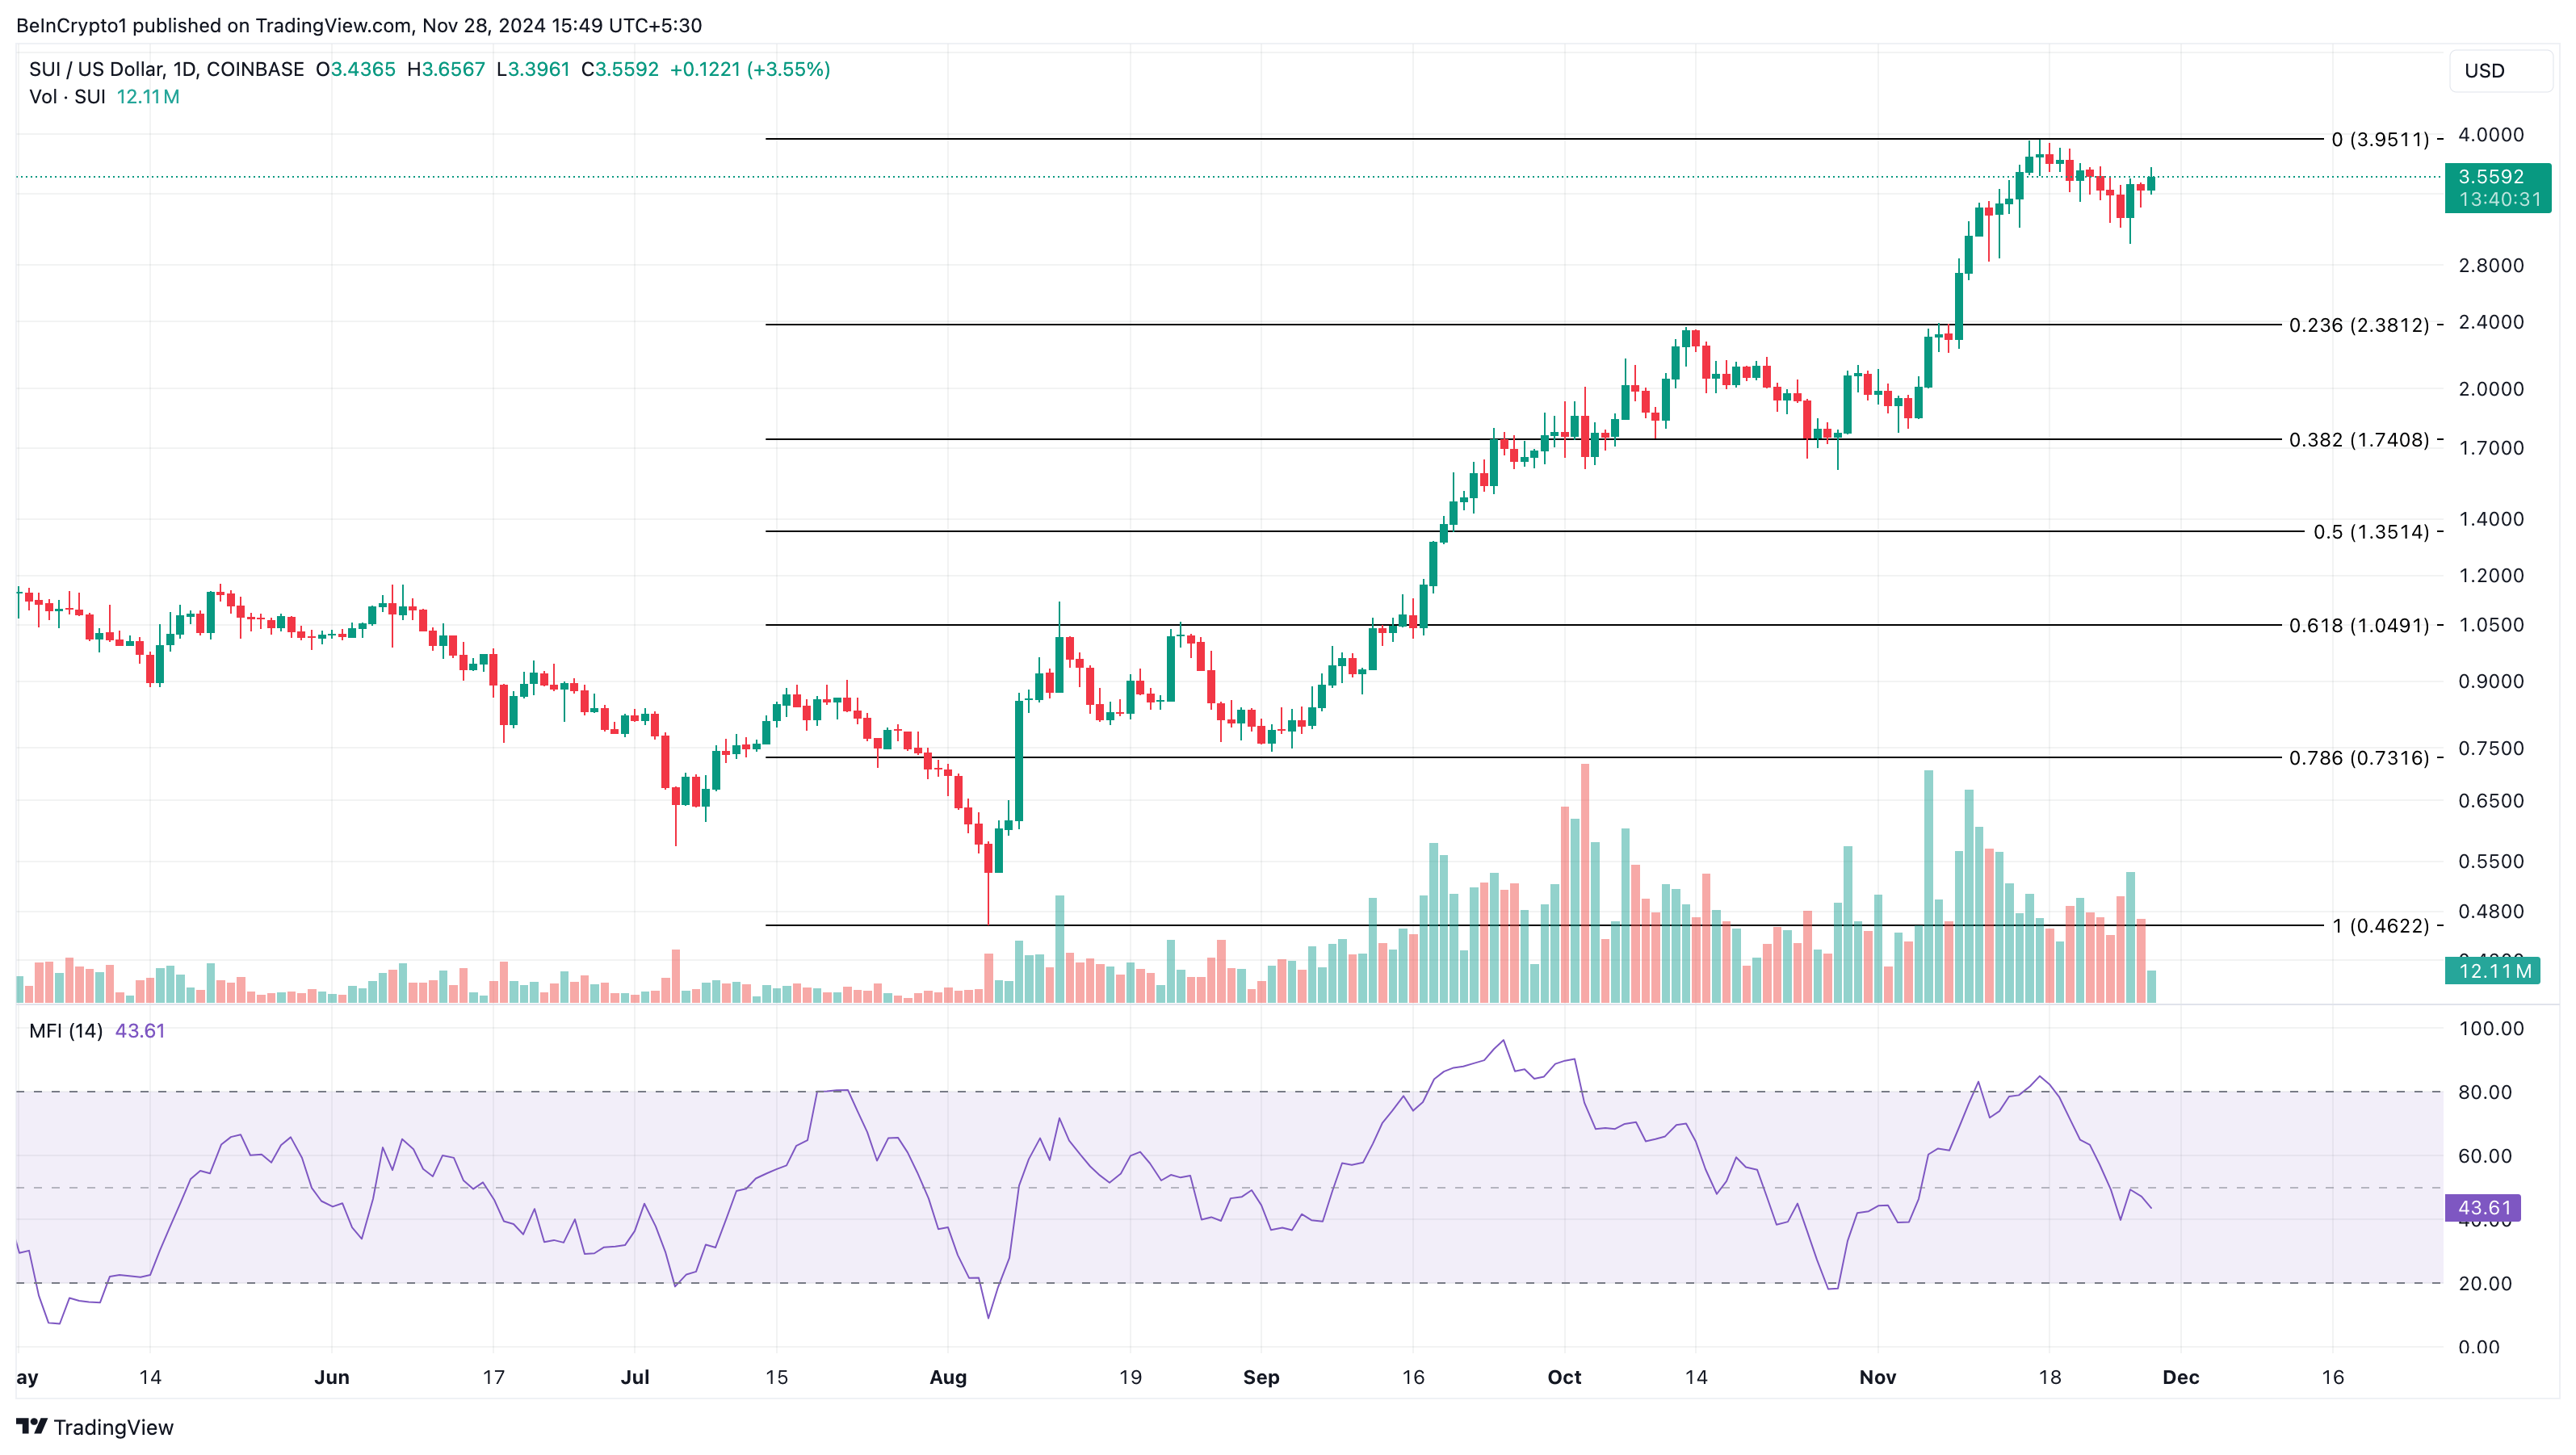
But if buying pressure comes into play again, this forecast might be invalidated. In that situation, SUI’s price might rally above $3.95.
Just a Chill Guy (CHILLGUY)
CHILLGUY is one of the trending altcoins today, with reasons similar to THENA. Just yesterday, Binance listed the Solana meme coin on its perpetual market, causing a brief spike in the token’s value.
However, in the last 24 hours, the price has decreased by 16.40%, suggesting that the listing was a “buy the rumor, sell the news” event. On the 4-hour chart, the volume around the token has decreased. Hence, the price is likely to continue to drop, with possible targets around $0.45.
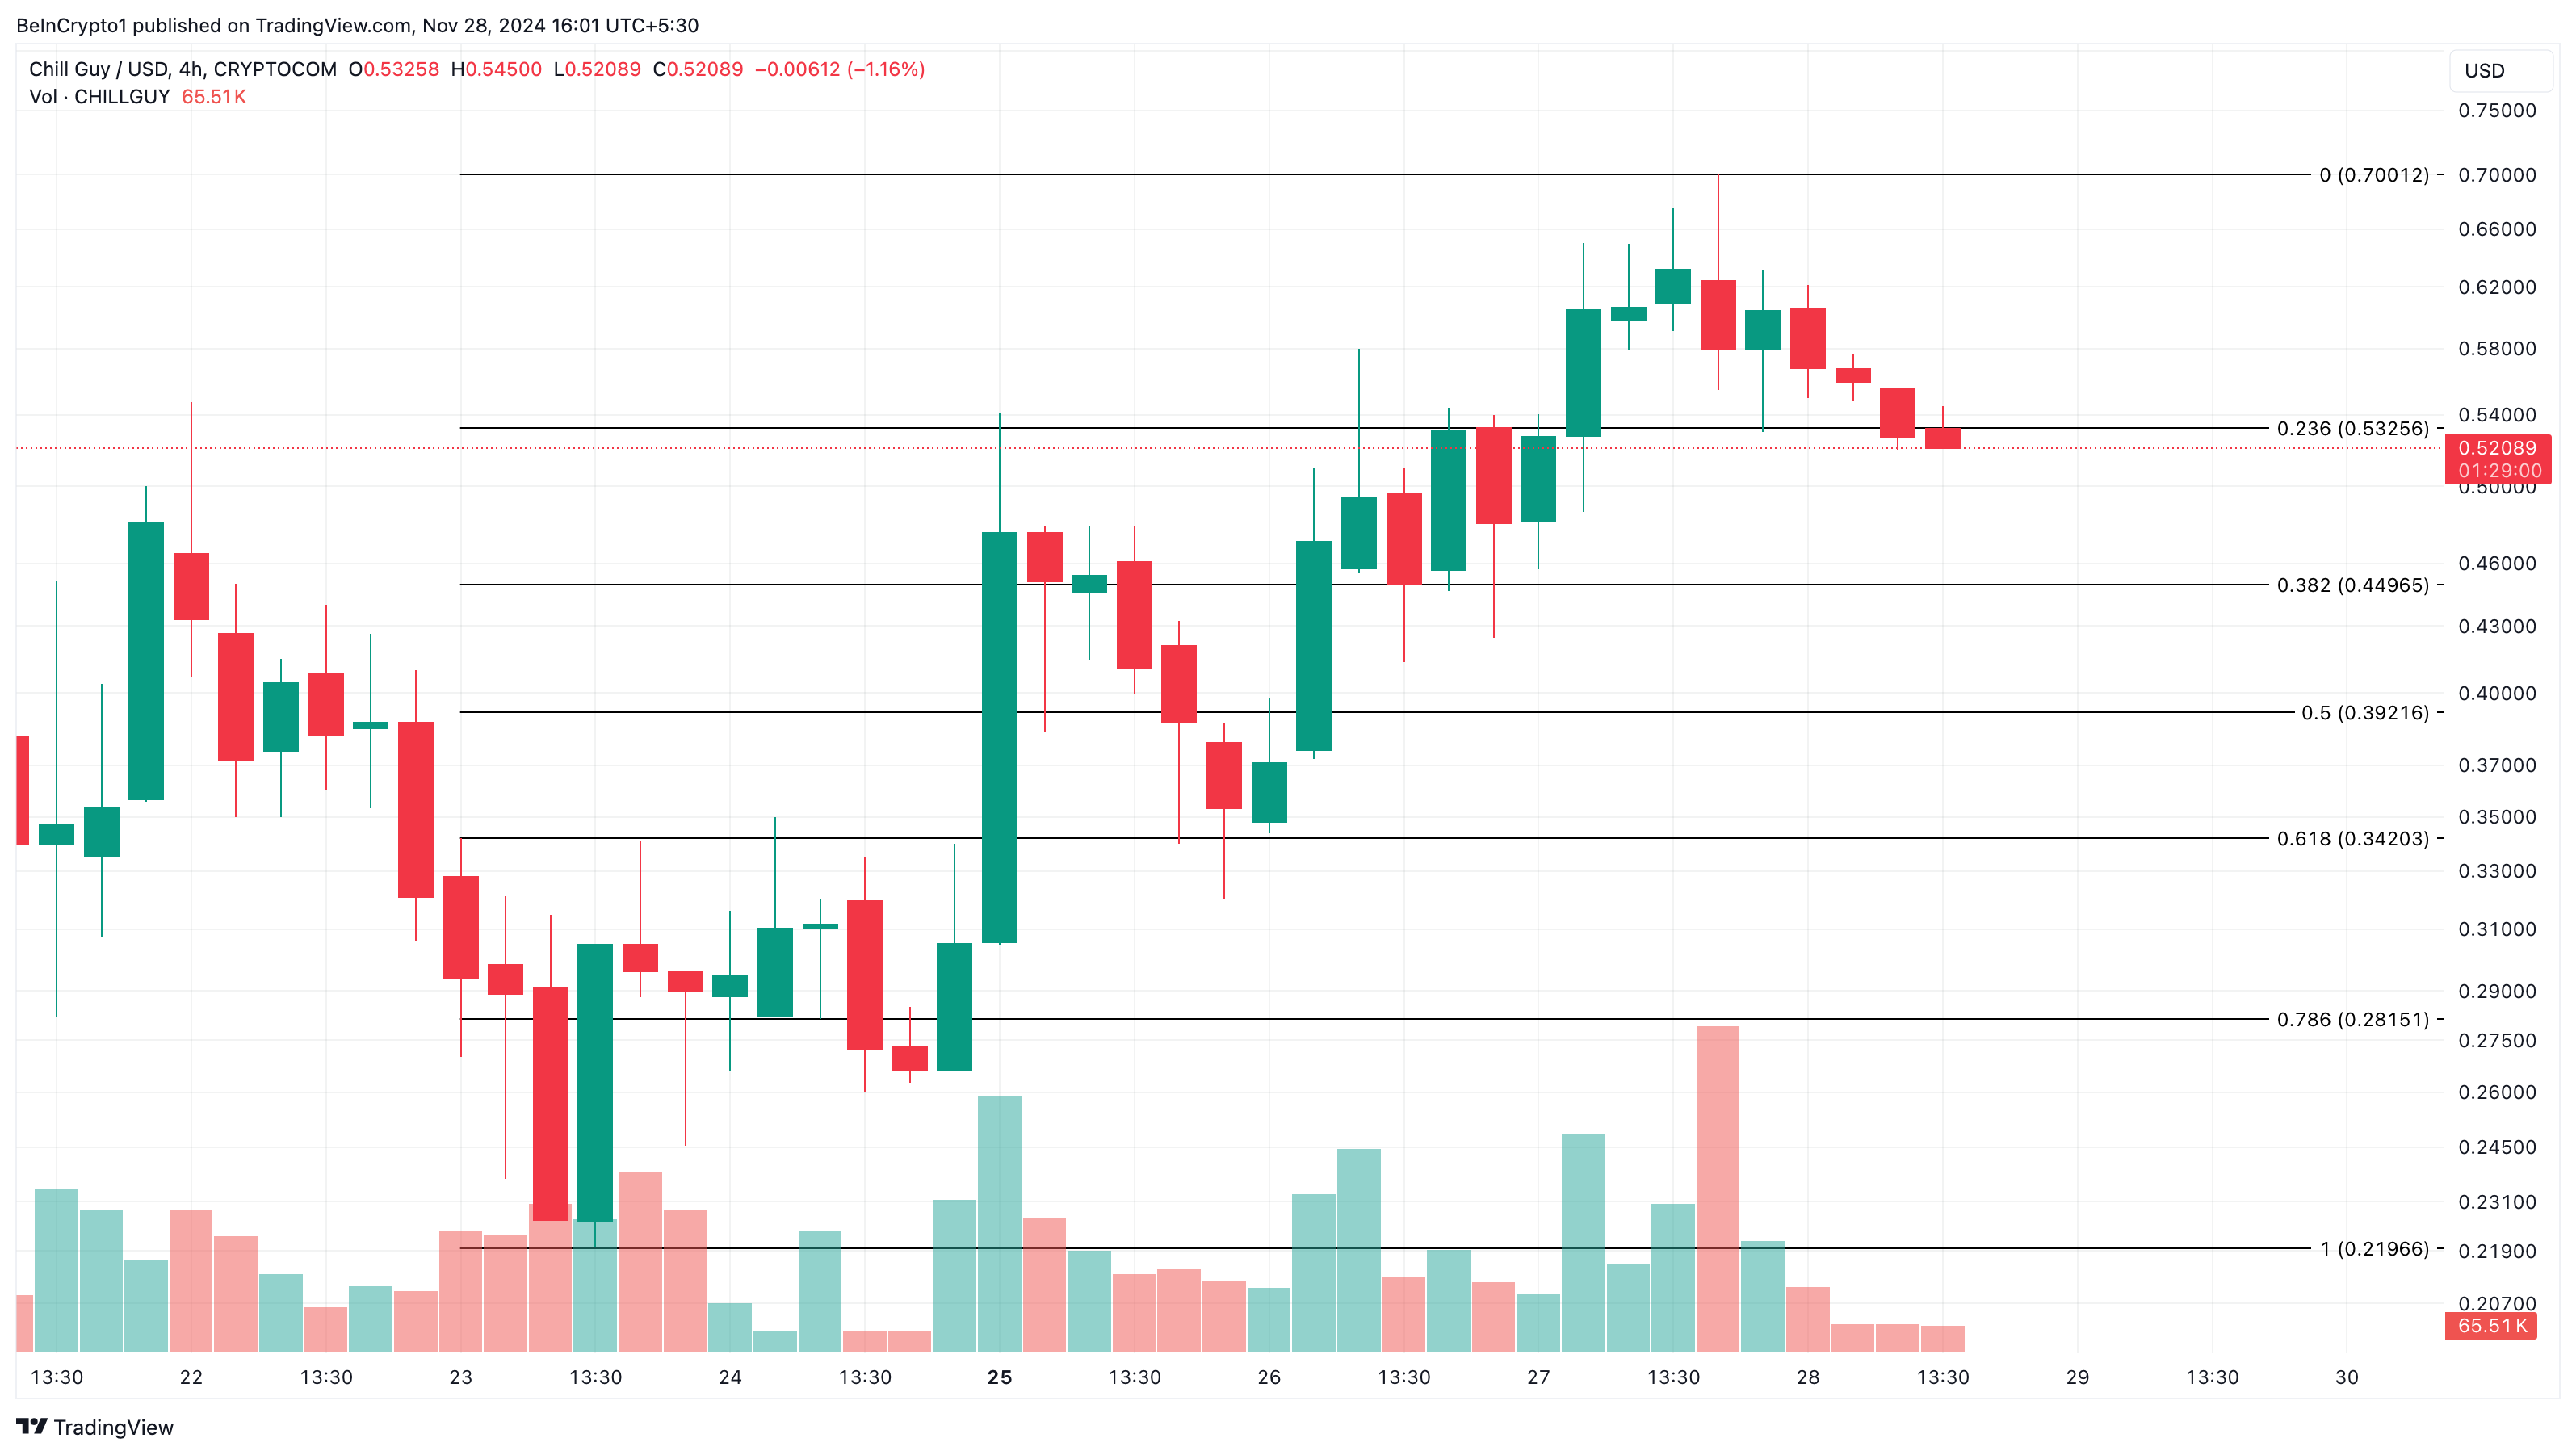
On the other hand, if interest in CHILLGUY jumps again, this might not happen, and the price might rise to $0.70.
Disclaimer
In line with the Trust Project guidelines, this price analysis article is for informational purposes only and should not be considered financial or investment advice. BeInCrypto is committed to accurate, unbiased reporting, but market conditions are subject to change without notice. Always conduct your own research and consult with a professional before making any financial decisions. Please note that our Terms and Conditions, Privacy Policy, and Disclaimers have been updated.
Market
US Bitcoin Spot ETFs Achieve All-Time High Inflows of $6.2 Billion

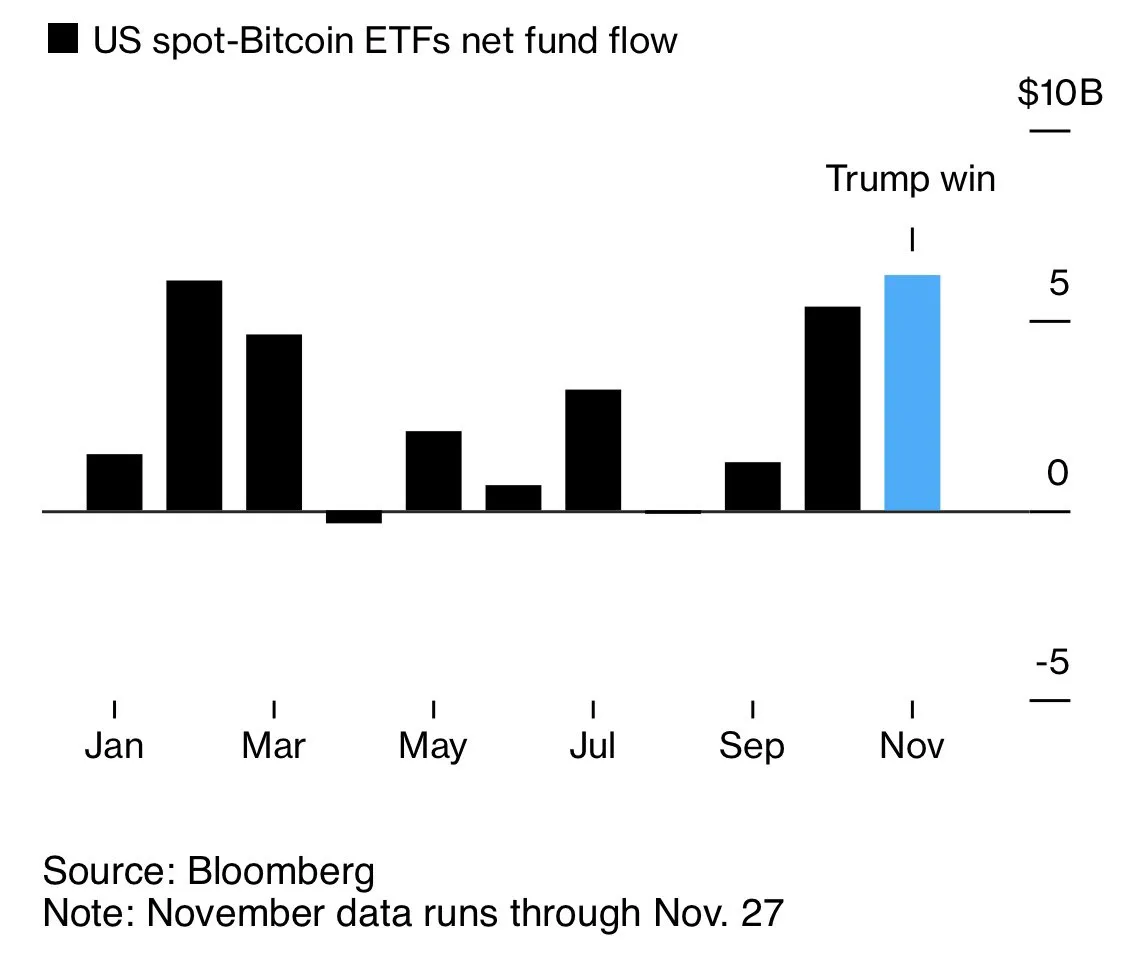
Bitcoin spot ETFs (exchange-traded funds) witnessed a landmark month in November, with net inflows surging to an unprecedented $6.2 billion. This financial instrument, which offers institutional investors indirect access to Bitcoin (BTC), broke the previous record set earlier this year.
The optimism driving this influx coincides with President-elect Donald Trump’s pro-crypto agenda, which has spurred investor confidence in digital assets and related financial products.
Political Winds Boost Bitcoin ETFs Past Key Milestones In November
Following the landmark approval of spot Bitcoin ETFs in January, the financial instruments have recorded a net $6.2 billion in combined netflows in November, according to data compiled by Bloomberg. With this, the US Bitcoin spot ETFs have breached the February peak of $6 Billion.
“Spot BTC ETFs set to break monthly inflow record… $6.2 billion so far in November. The previous high was $6 billion in February,” said Nate Geraci, president of The ETF Store.
Donald Trump’s electoral victory has been a critical catalyst for the record-breaking inflows. His administration has promised a favorable regulatory environment for cryptocurrencies, including reversing restrictive policies enacted during the Biden era.
The announcement of plans to establish a strategic Bitcoin reserve and appoint crypto-friendly regulators has further bolstered market sentiment. These drove Bitcoin close to the $100,000 threshold.
This optimism extends to spot Bitcoin ETFs, which saw their largest single-day inflow of $1.38 billion immediately following the election. BlackRock, a leader in the space, recorded over $1 billion in a single day, reflecting the significant interest from institutional investors seeking exposure to Bitcoin through regulated avenues.
Beyond record inflows, Bitcoin ETFs have also witnessed rapid accumulation of holdings, approaching 1 million BTC collectively. Analysts project that by year-end, these ETFs could surpass the estimated holdings of Bitcoin’s creator, Satoshi Nakamoto. Such a milestone would solidify their dominance in the market.
BlackRock’s iShares Bitcoin Trust (IBIT) stood out with its record-breaking volumes, recently surpassing gold-based ETFs in market traction. This shift signals a growing preference for digital assets among traditional investors. Other ETFs, such as those from Fidelity and Bitwise, have also experienced notable inflows, further expanding Bitcoin’s reach in mainstream finance.
Trump’s Policies Pave Way for ETF Expansion
Trump’s administration is expected to unlock further opportunities for crypto-based financial products. Already, crypto markets have seen options trading for Bitcoin ETFs. Recent approvals by the Options Clearing Corporation (OCC) have paved the way for the launch of options trading for Bitcoin ETFs. These developments provided investors with an additional tool to hedge and speculate on Bitcoin price movements.
Matt Hougan, Chief Investment Officer at Bitwise, described the developments in the space as potential game-changers. Specifically, they would allow institutional investors to enter the crypto space with greater confidence. This trend aligns with the broader institutional adoption of Bitcoin as a strategic asset amid favorable regulatory signals.
“A pro-crypto regulatory environment will provide air cover for institutional investors who have long wanted to allocate to the space. It’s a game-changer,” Hougan posted on X.
With ETFs playing a pivotal role in Bitcoin’s adoption, their continued growth could sustain BTC’s upward trajectory. Predictions suggest Bitcoin could reach new all-time highs, with some models targeting $117,000 if the current momentum persists. At the time of writing, BTC is trading for $96,390, a modest 0.64% gain since Friday’s session opened.
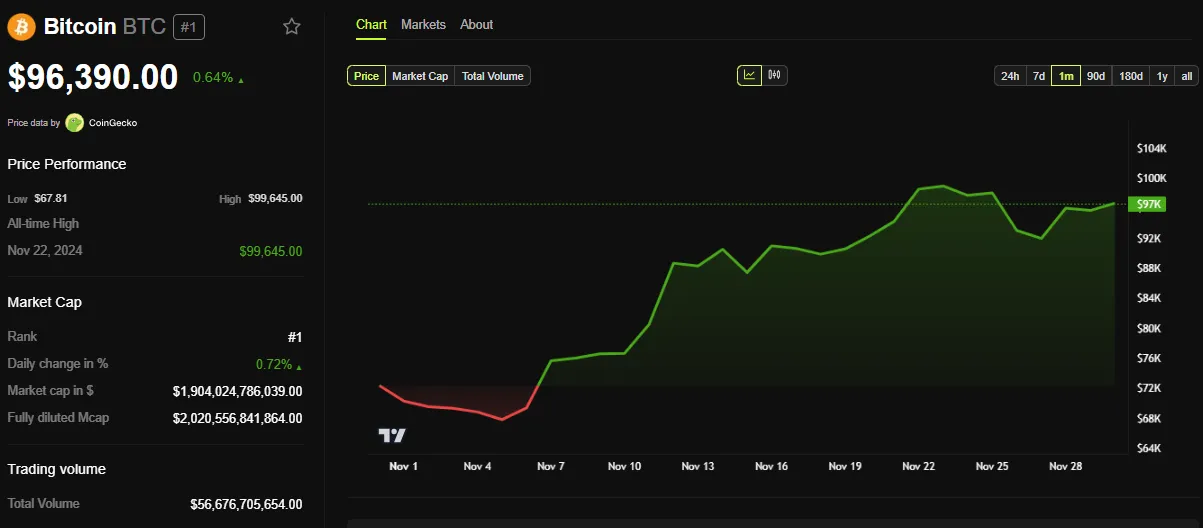
Meanwhile, the record inflows into US Bitcoin spot ETFs in November reflect a convergence of political and regulatory events with investor sentiment. Trump’s pro-crypto stance has reignited enthusiasm among investors, driving both price and adoption milestones.
As these ETFs grow in significance, they are reshaping the playing field of Bitcoin investing, positioning the pioneer crypto for broader acceptance in the financial system.
Disclaimer
In adherence to the Trust Project guidelines, BeInCrypto is committed to unbiased, transparent reporting. This news article aims to provide accurate, timely information. However, readers are advised to verify facts independently and consult with a professional before making any decisions based on this content. Please note that our Terms and Conditions, Privacy Policy, and Disclaimers have been updated.
Market
XRP Price Targets $1.60 Breakout: Is The Bull Run Back?

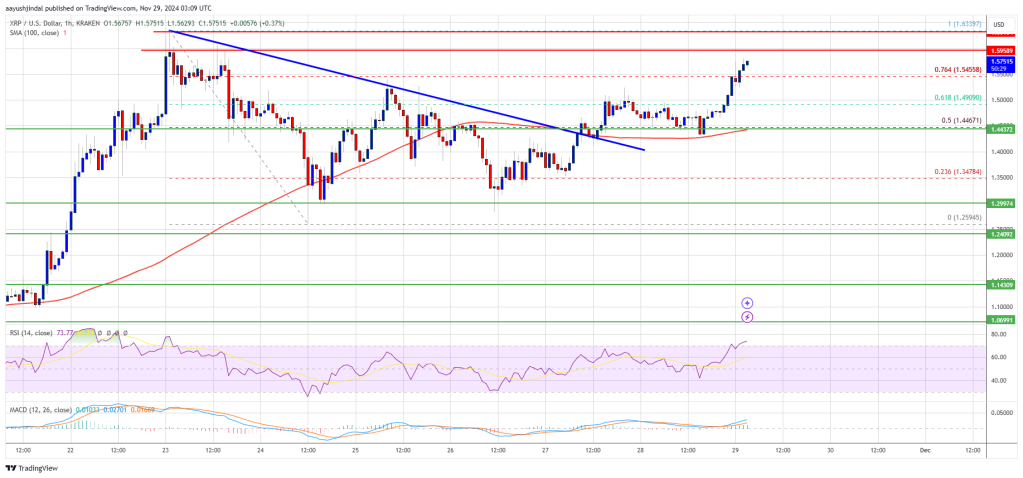
XRP price is rising and gaining pace above the $1.480 zone. The price is showing positive signs and might soon aim for a breakout above the $1.60 level.
- XRP price is eyeing a fresh increase above the $1.5850 resistance zone.
- The price is now trading above $1.520 and the 100-hourly Simple Moving Average.
- There was a break above a key bearish trend line with resistance at $1.4450 on the hourly chart of the XRP/USD pair (data source from Kraken).
- The pair might gain momentum if it clears the $1.600 resistance.
XRP Price Starts Fresh Increase Above $1.50
XRP price remained supported near the $1.400 zone. It formed a base and recently started an upward move like Bitcoin and like Ethereum. There was a move above the $1.420 and $1.4350 resistance levels.
There was a break above a key bearish trend line with resistance at $1.4450 on the hourly chart of the XRP/USD pair. The pair was able to clear the $1.50 level. There was a clear move above the 61.8% Fib retracement level of the downward move from the $1.6339 swing high to the $1.2594 low.
The price is now trading above $1.50 and the 100-hourly Simple Moving Average. It is also above the 76.4% Fib retracement level of the downward move from the $1.6339 swing high to the $1.2594 low.
On the upside, the price might face resistance near the $1.5850 level. The first major resistance is near the $1.600 level. The next key resistance could be $1.6350. A clear move above the $1.6350 resistance might send the price toward the $1.6650 resistance. Any more gains might send the price toward the $1.680 resistance or even $1.6920 in the near term. The next major hurdle for the bulls might be $1.70.
Another Pullback?
If XRP fails to clear the $1.600 resistance zone, it could start a downside correction. Initial support on the downside is near the $1.500 level. The next major support is near the $1.480 level.
If there is a downside break and a close below the $1.480 level, the price might continue to decline toward the $1.4550 support. The next major support sits near the $1.400 zone.
Technical Indicators
Hourly MACD – The MACD for XRP/USD is now gaining pace in the bullish zone.
Hourly RSI (Relative Strength Index) – The RSI for XRP/USD is now above the 50 level.
Major Support Levels – $1.5000 and $1.4800.
Major Resistance Levels – $1.6000 and $1.6350.
Market
Solana (SOL) Momentum Builds: $250 Could Just Be The Beginning

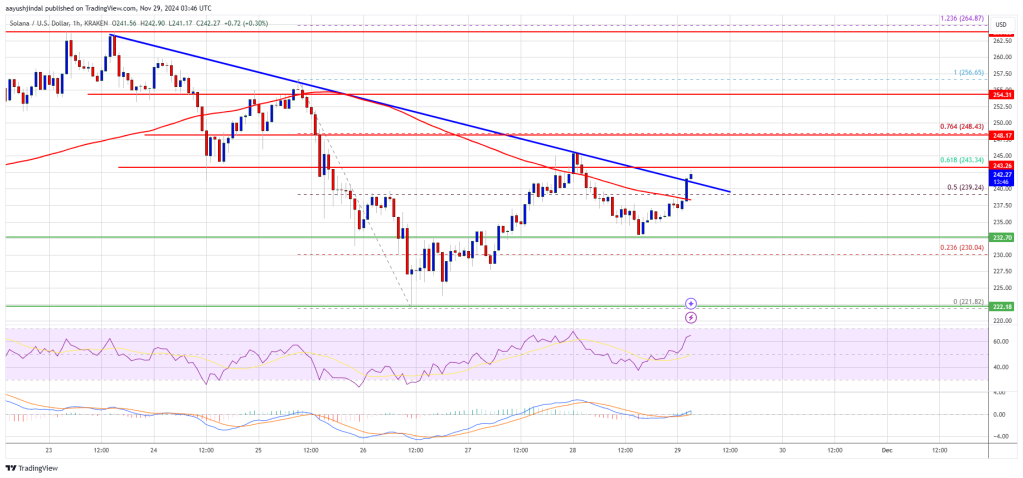
Solana started a fresh increase from the $220 zone. SOL price is rising and aiming for a sustained upward move above the $250 resistance.
- SOL price started a fresh increase after it settled above the $225 level against the US Dollar.
- The price is now trading above $240 and the 100-hourly simple moving average.
- There was a break above a key bearish trend line with resistance at $240 on the hourly chart of the SOL/USD pair (data source from Kraken).
- The pair could start a fresh increase if the bulls clear the $250 zone.
Solana Price Eyes Sustained Increase
Solana price formed a support base and started a fresh increase above the $225 level like Bitcoin and Ethereum. There was a decent increase above the $230 and $232 resistance levels.
There was a move above the 50% Fib retracement level of the downward move from the $256 swing high to the $221 low. Besides, there was a break above a key bearish trend line with resistance at $240 on the hourly chart of the SOL/USD pair.
Solana is now trading above $240 and the 100-hourly simple moving average. On the upside, the price is facing resistance near the $244 level or the 61.8% Fib retracement level of the downward move from the $256 swing high to the $221 low.
The next major resistance is near the $248 level. The main resistance could be $250. A successful close above the $250 resistance level could set the pace for another steady increase. The next key resistance is $265. Any more gains might send the price toward the $278 level.
Are Dips Supported in SOL?
If SOL fails to rise above the $248 resistance, it could start a downside correction. Initial support on the downside is near the $240 level or the 100-hourly simple moving average. The first major support is near the $232 level.
A break below the $232 level might send the price toward the $230 zone. If there is a close below the $230 support, the price could decline toward the $220 support in the near term.
Technical Indicators
Hourly MACD – The MACD for SOL/USD is gaining pace in the bullish zone.
Hourly Hours RSI (Relative Strength Index) – The RSI for SOL/USD is above the 50 level.
Major Support Levels – $240 and $232.
Major Resistance Levels – $248 and $250.
-

 Market11 hours ago
The next Pepe with a potential for 1,000% gains
-

 NFT23 hours ago
BitBasel + VESA
-

 Market9 hours ago
The Biggest Names in Blockchain in 2024 Revealed
-

 Market17 hours ago
Can Shiba Inu Coin Holders Push SHIB Price Higher?
-

 Altcoin17 hours ago
Is Altcoin Season Here? Analysts Share Key Insights
-

 Market16 hours ago
Hidden Altcoins Gems For December
-

 Ethereum13 hours ago
Ethereum Eyes $3,900 – Key Resistance Break Could Spark A Surge
-

 Market13 hours ago
RWA Altcoins to Watch This December


