Market
Can the ETH Coin Price Revisit Its Year-To-Date High?
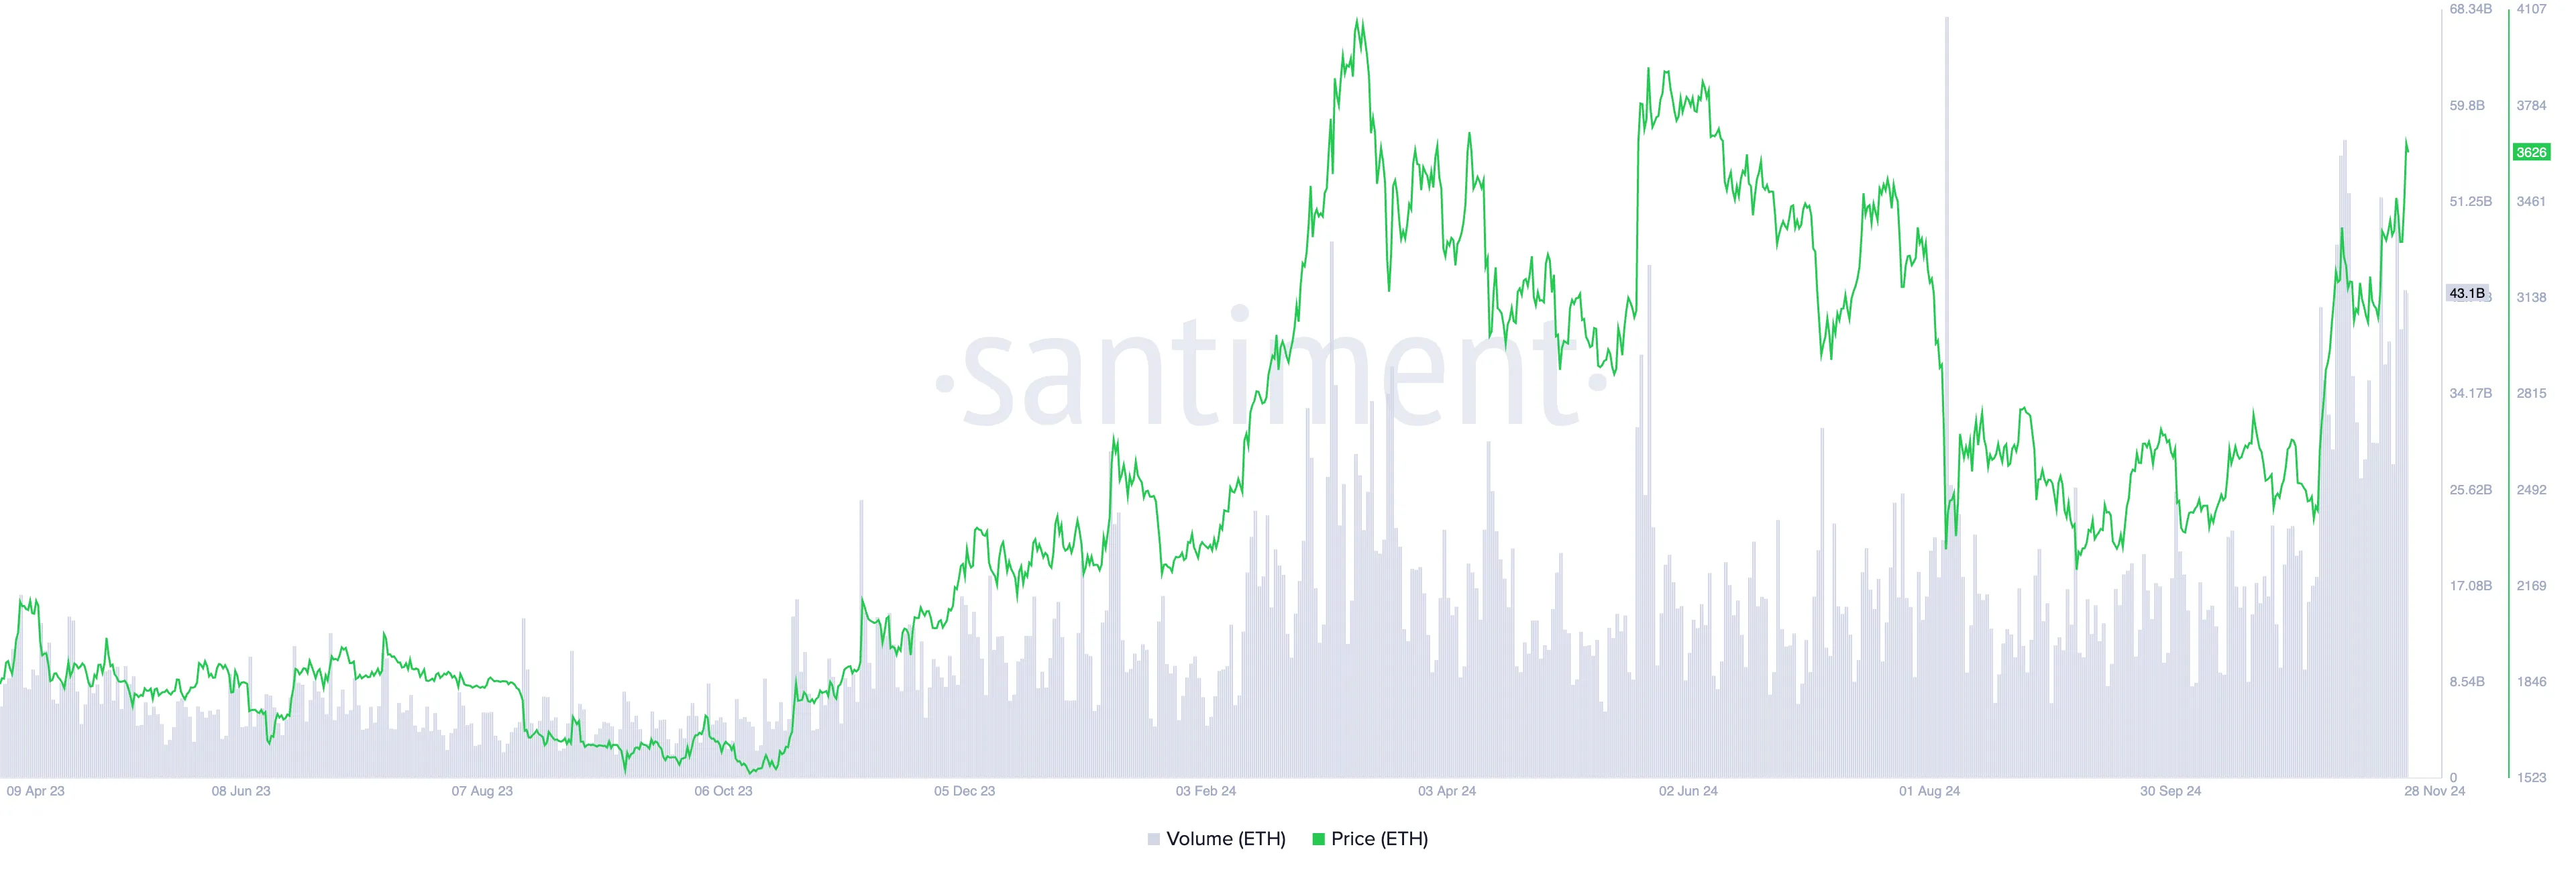
Leading altcoin Ethereum (ETH) has experienced a notable price surge over the past 24 hours, breaking the $3,600 mark. As of this writing, ETH exchanges hands at $3,613, a level it last traded at in June.
This rebound has been fueled by a massive trading volume exceeding $43 billion in the past 24 hours. This hints at a sustained rally toward the psychological $4,000 price mark.
Ethereum Price Surge Hints at Altcoin Season
ETH’s trading volume has totaled $43 billion over the past 24 hours. This surge in trading activity has propelled the coin’s value to a price last observed five months ago.
When an asset’s trading volume climbs alongside its price, it indicates strong market interest and confidence in the upward movement. This combination suggests that the price rally is backed by significant buying activity, making it more sustainable.
Therefore, ETH’s high trading volume reflects the uptick in market demand and broad participation. This reduces the likelihood of a sudden reversal.
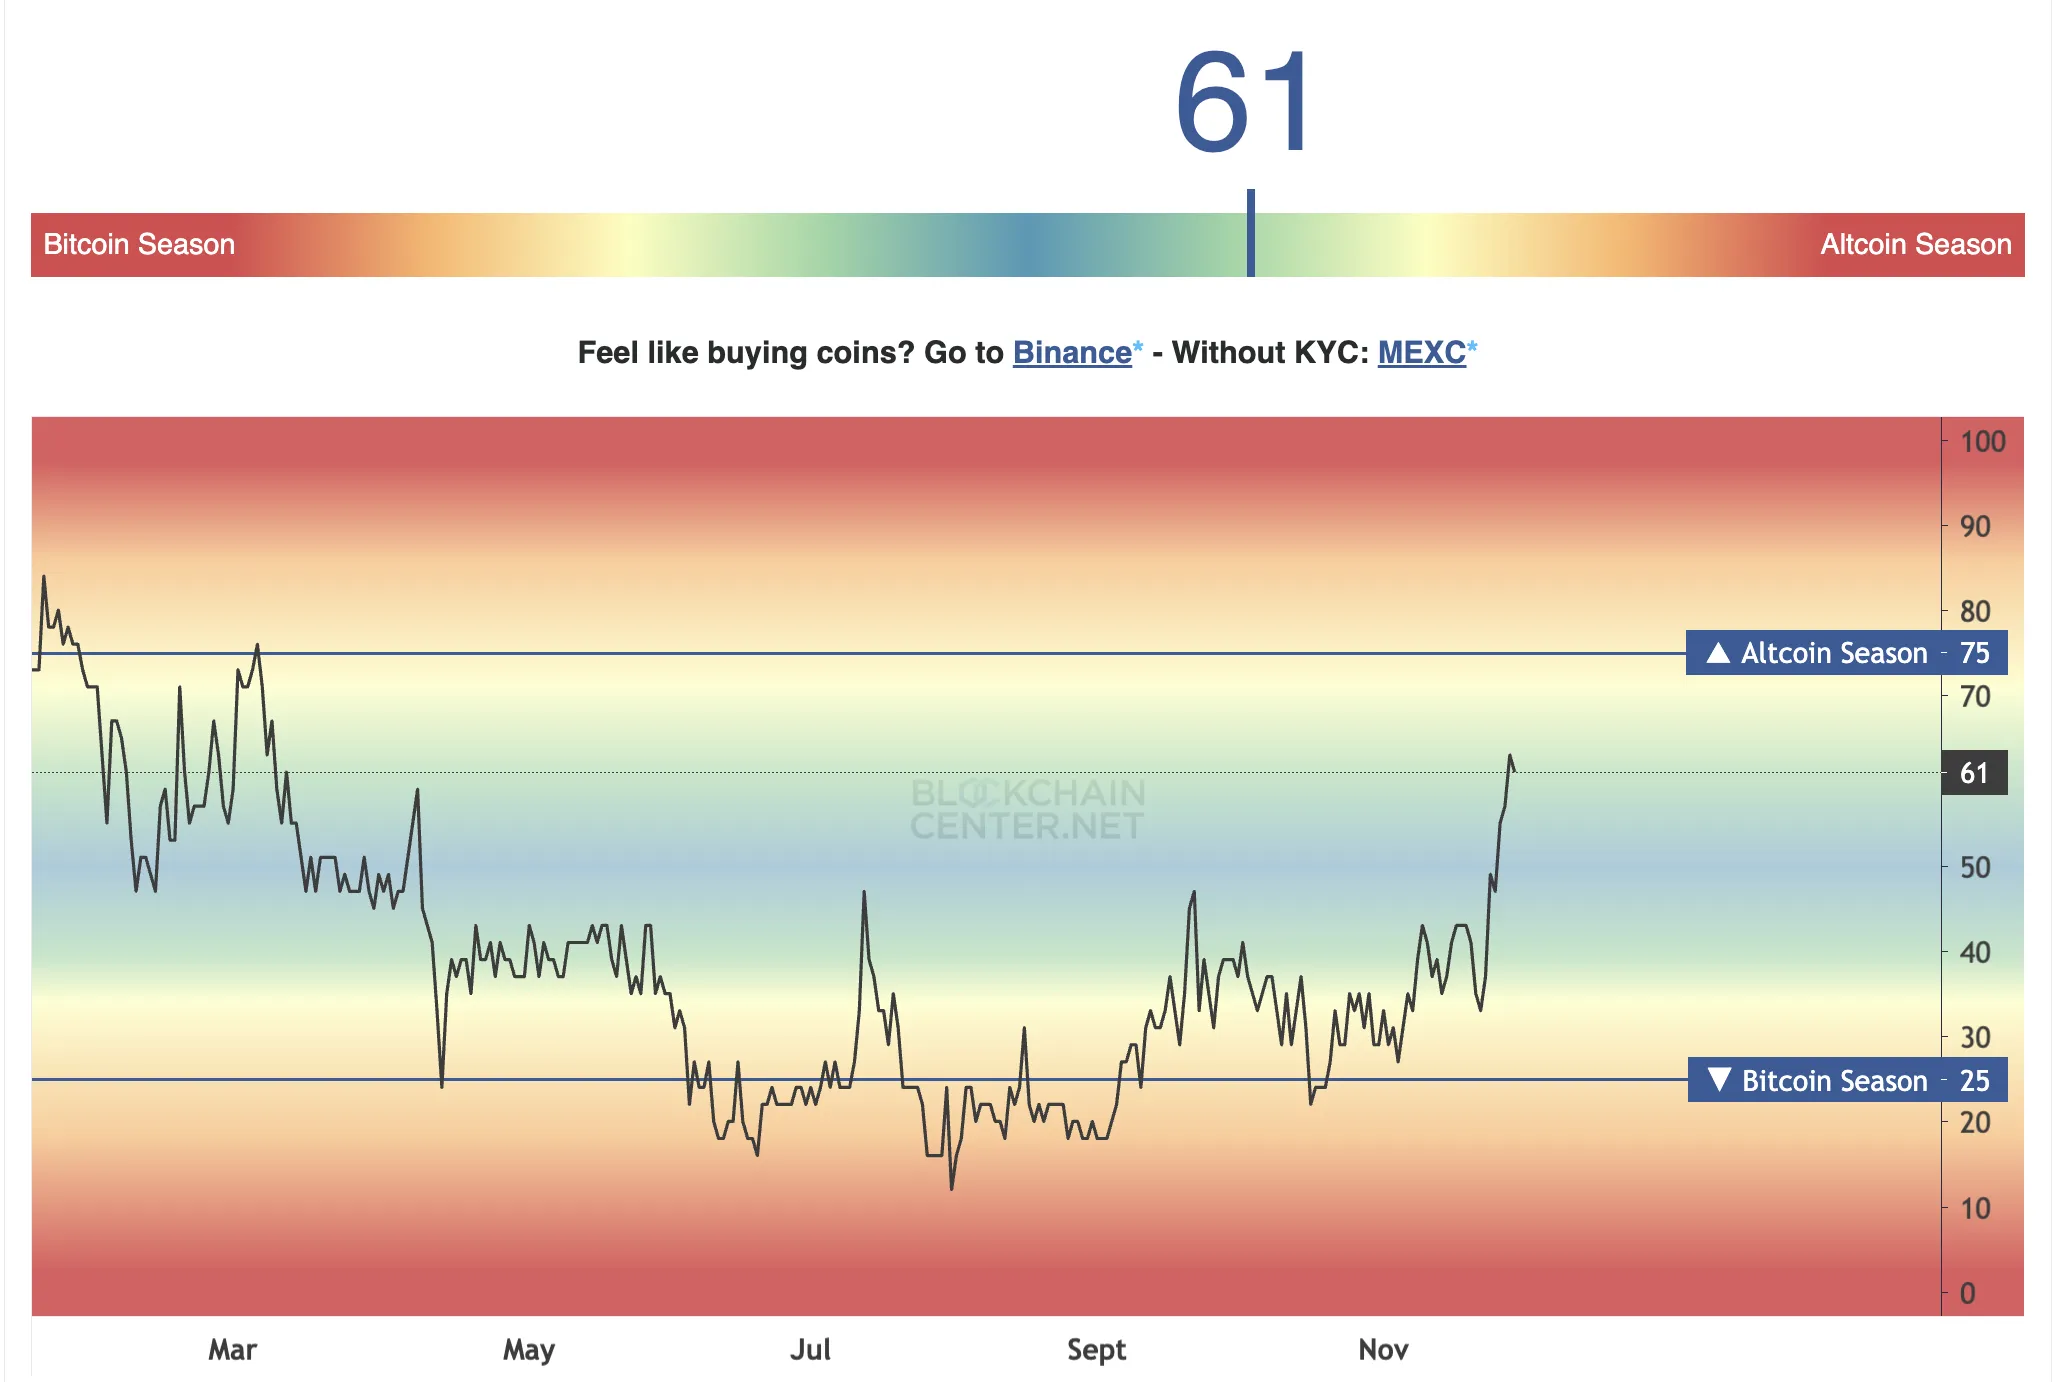
Further, Ethereum’s recent surge suggests a potential shift toward the altcoin season. According to Blockchain Center’s Altcoin Season Index (ASI), the score now stands at 61 out of 100, nearing the 75-point threshold to signal the commencement of the highly-anticipated time.
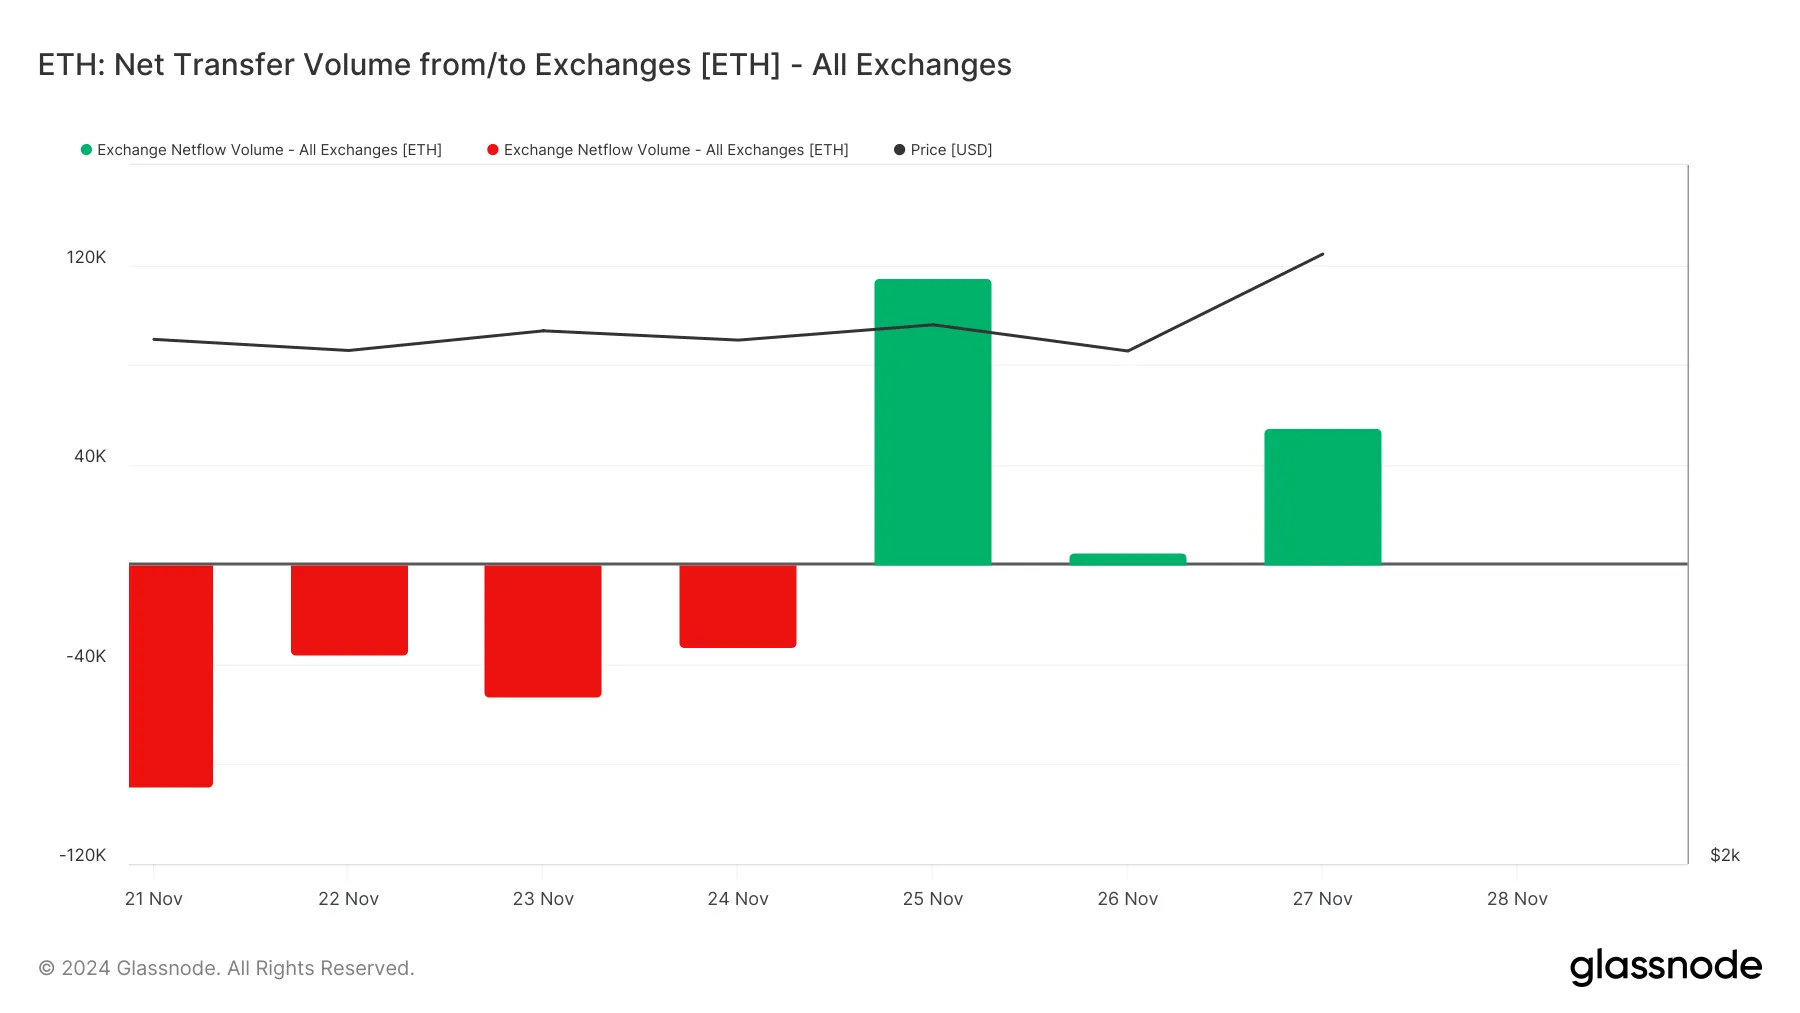
Notably, some profit-taking activity is already underway due to this price surge. This is reflected in the coin’s positive exchange netflow volume. On Wednesday, 54,974 ETH valued above $199 million were sent to exchanges.
The exchange netflow volume metric measures the difference between inflows into and outflows from exchanges over a specific period. When an asset’s netflow is positive, more coins are moving into exchanges than leaving, often signaling potential selling pressure as traders prepare to sell.
This increase in supply on exchanges can weigh on the price if demand does not match the heightened availability.
ETH Price Prediction: Rally Toward Year-To-Date High
Despite this, the overall bullish sentiment in the Ethereum market remains strong, suggesting that the uptrend may persist. The setup of ETH’s Parabolic Stop and Reverse (SAR) indicator, as assessed on a daily chart, confirms this bullish outlook.
This indicator identifies potential trend reversals and provides dynamic support and resistance levels. It places dots above or below the price chart: dots below the price suggest a bullish trend, while the dots above indicate a bearish trend.
As in ETH’s case, when the SAR rests below the price, it signals upward momentum and suggests a bullish trend. If the bullish trend persists, the ETH coin price may breach resistance at $3,669 and climb toward its year-to-date high of $4,093.
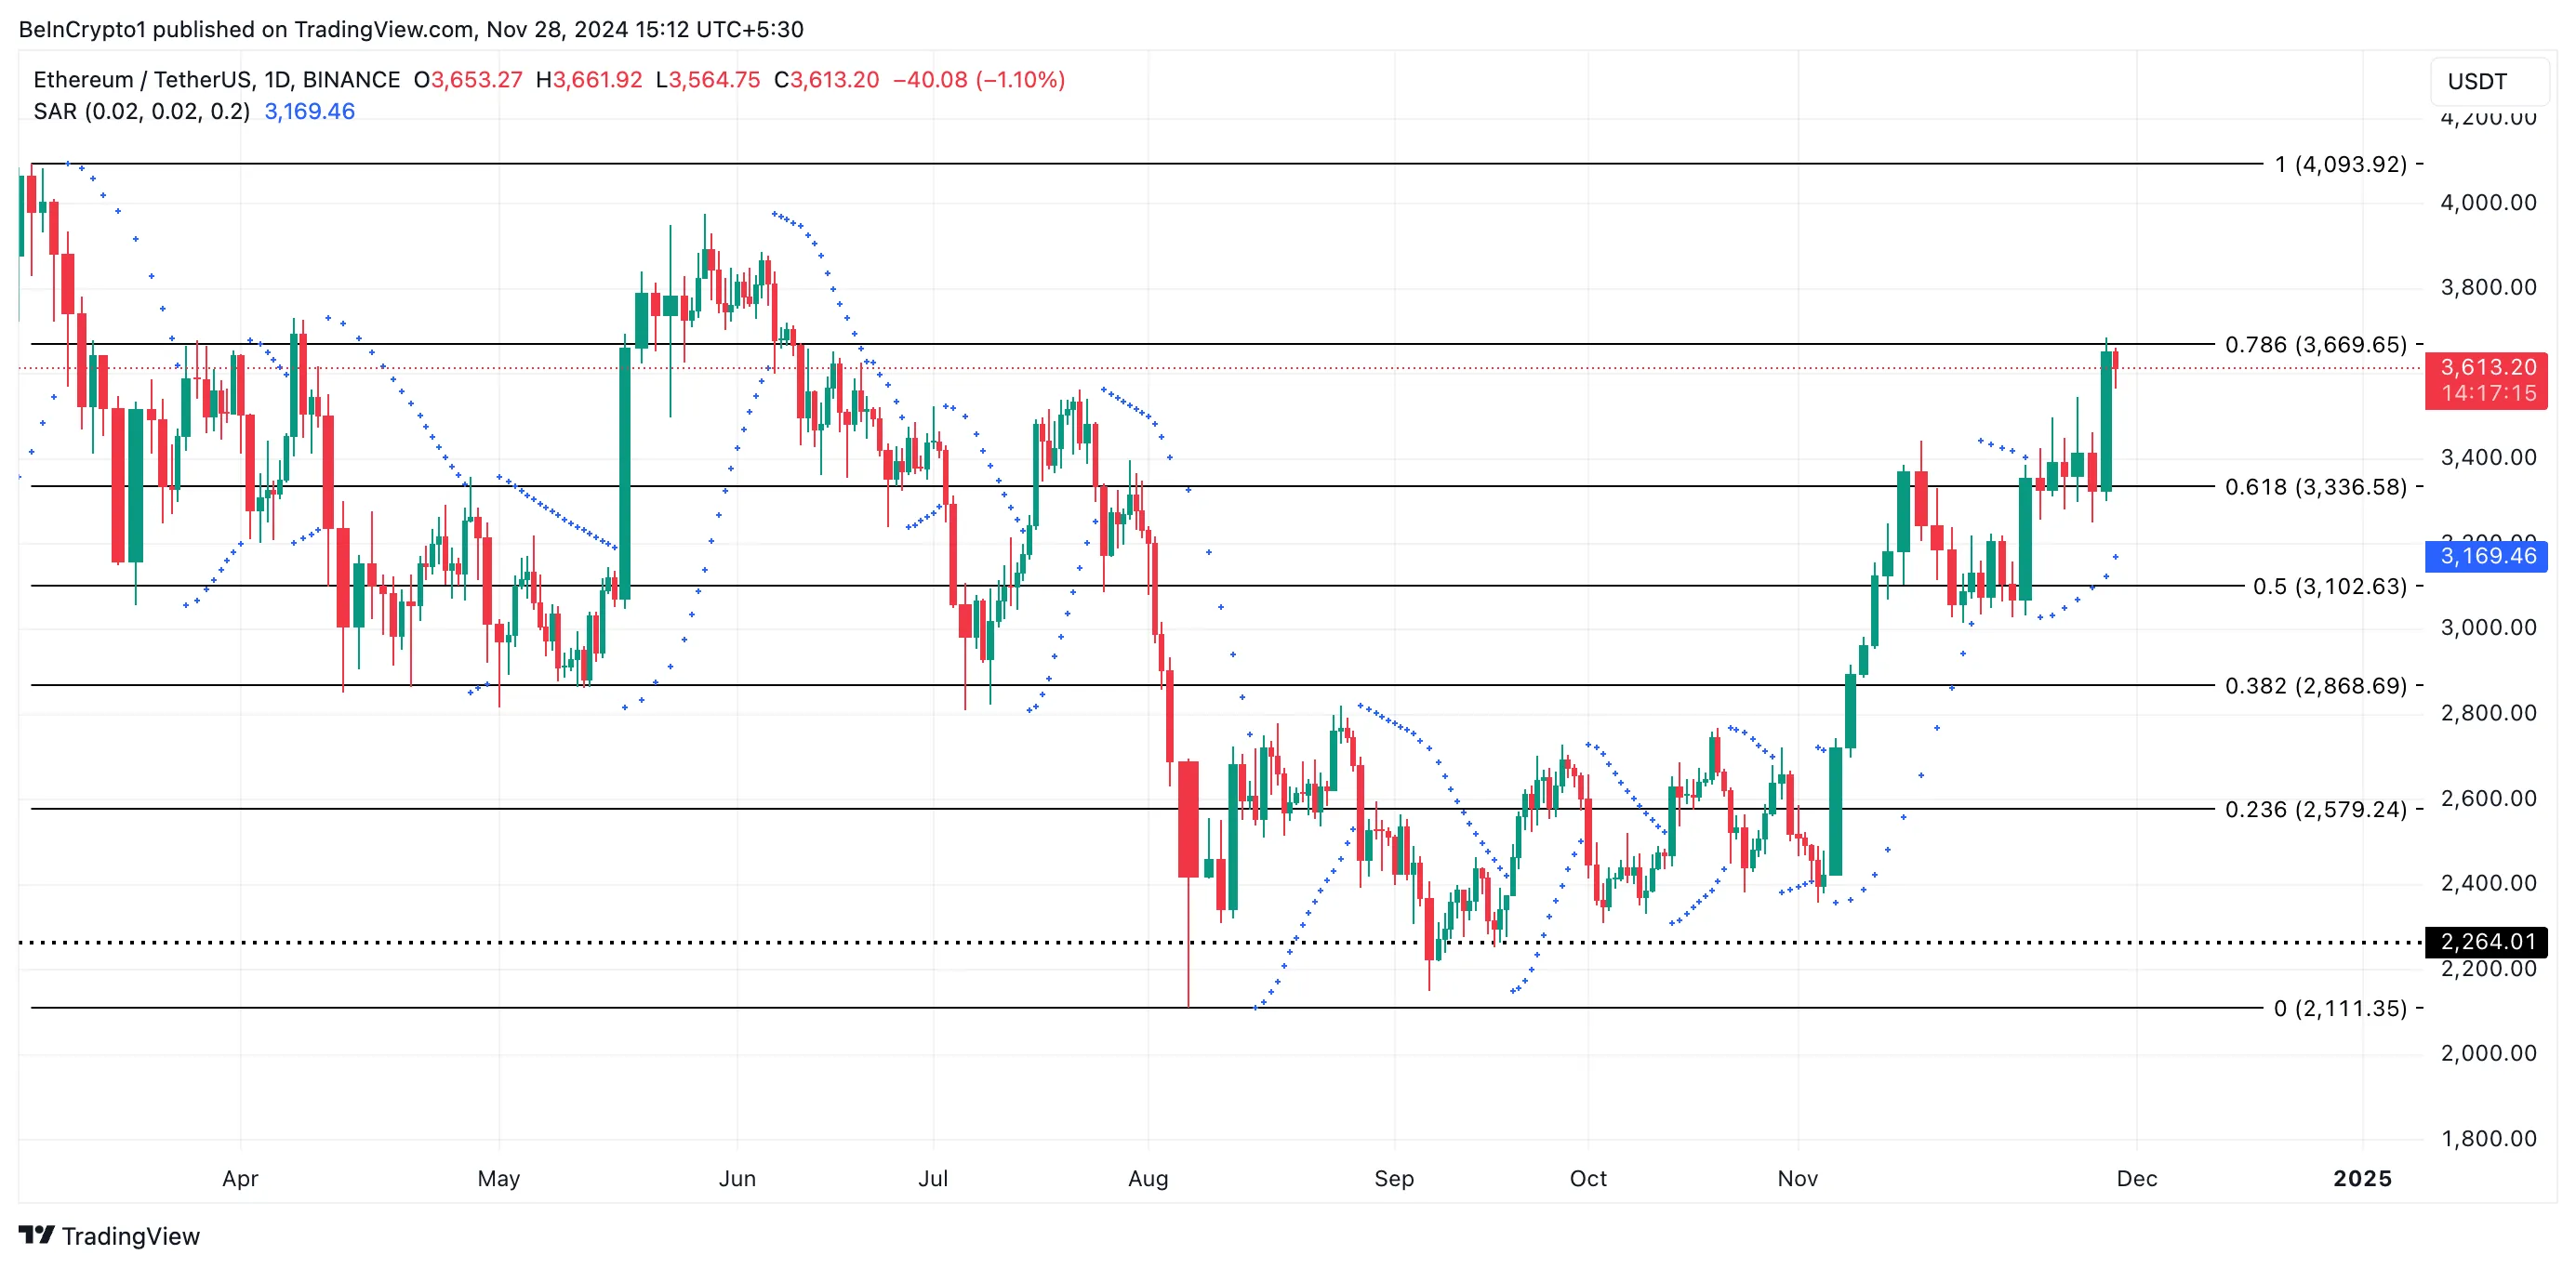
On the other hand, a decline in bullish pressure will occasion the ETH coin price to fall toward support formed at $3,336.
Disclaimer
In line with the Trust Project guidelines, this price analysis article is for informational purposes only and should not be considered financial or investment advice. BeInCrypto is committed to accurate, unbiased reporting, but market conditions are subject to change without notice. Always conduct your own research and consult with a professional before making any financial decisions. Please note that our Terms and Conditions, Privacy Policy, and Disclaimers have been updated.
Market
$1.7 Million Stolen, User Withdrawals Suspended


XT.com, a Seychelles-based crypto exchange handling over $3.4 billion in daily trading volume, has experienced a suspected hack involving $1.7 million.
Since then, the platform has suspended all customer withdrawals.
Blockchain security firm PeckShield revealed that the attacker had already converted the stolen funds into 461.58 Ether. XT.com initially said withdrawals were suspended due to wallet upgrades and maintenance.
However, the exchange has since acknowledged the incident and stated that user funds were not affected. XT.com also assured users that withdrawal services would gradually resume starting tomorrow, November 29.
“Today, XT detected an abnormal transfer from our platform wallet. Rest assured, this will not affect our users. We always maintain reserves 1.5x greater than user assets to ensure maximum security. Our team is investigating, and we remain committed to protecting your assets,” the exchange posted on X (formerly Twitter).
Founded in 2018, XT.com allows trading for more than 1,000 cryptocurrencies. According to CoinGecko data, it’s the 21st largest centralized exchange based on daily trading volume.
“The amount involved in this incident is approximately 1 million USDT across 12 different currencies. These assets are owned by the platform and will not in any way harm the interests of our customers or users,” XT.com said in official statement.
Crypto Hacks Are Not Slowing Down
Cyber attacks continue to be a major pain point for the crypto industry. Despite notable advancements in smart contract security and increasing crypto adoption, hacks continue to rack up millions every year.
By September 2024, cybercriminals had stolen $2.1 billion from the industry. This is significantly higher than the $1.6 billion stolen throughout 2023. The overvall value by the end of 2024 will be much higher.
In October, blockchain lender Radiant Capital suffered its second major attack of the year, losing over $50 million in a multi-chain exploit. Hackers compromised a private key, enabling them to drain user assets through automated wallet functions.
Back in July, one of India’s largest exchanges, WazirX, suffered a $235 million breach. The exchange even offered a $23 million bounty for the hacker to return the funds but in no vain.
WazirX customers are yet to receive reimbursement for their lost funds. Recently, the Indian police arrested an individual who was linked to the hack. However, the wider investigation remains open.
The latest XT.com hack shows yet again how vulnerable centralized exchanges are to the growing cyber threats.
Disclaimer
In adherence to the Trust Project guidelines, BeInCrypto is committed to unbiased, transparent reporting. This news article aims to provide accurate, timely information. However, readers are advised to verify facts independently and consult with a professional before making any decisions based on this content. Please note that our Terms and Conditions, Privacy Policy, and Disclaimers have been updated.
Market
Hidden Altcoins Gems For December

November was marked by Bitcoin reaching a new all-time high, with other coins like Solana and SUI following its lead. Although the altcoins season may not be here yet, as BTC continues to dominate the charts, projects like Virtual Protocol (VIRTUAL), Pyth Network (PYTH), and Raydium (RAY) are showcasing impressive growth.
VIRTUAL has surged 71.29% in the last seven days, driven by the narrative about artificial intelligence coins. Meanwhile, PYTH and RAY are capitalizing on ecosystem dominance and utility, with both tokens gaining significant traction and highlighting the expanding potential of DeFi and blockchain technology.
Virtual Protocol (VIRTUAL)
Recently achieving a new all-time high, VIRTUAL broke past the $1 billion market cap and solidified its position as a rising star in the artificial intelligence altcoins narrative.
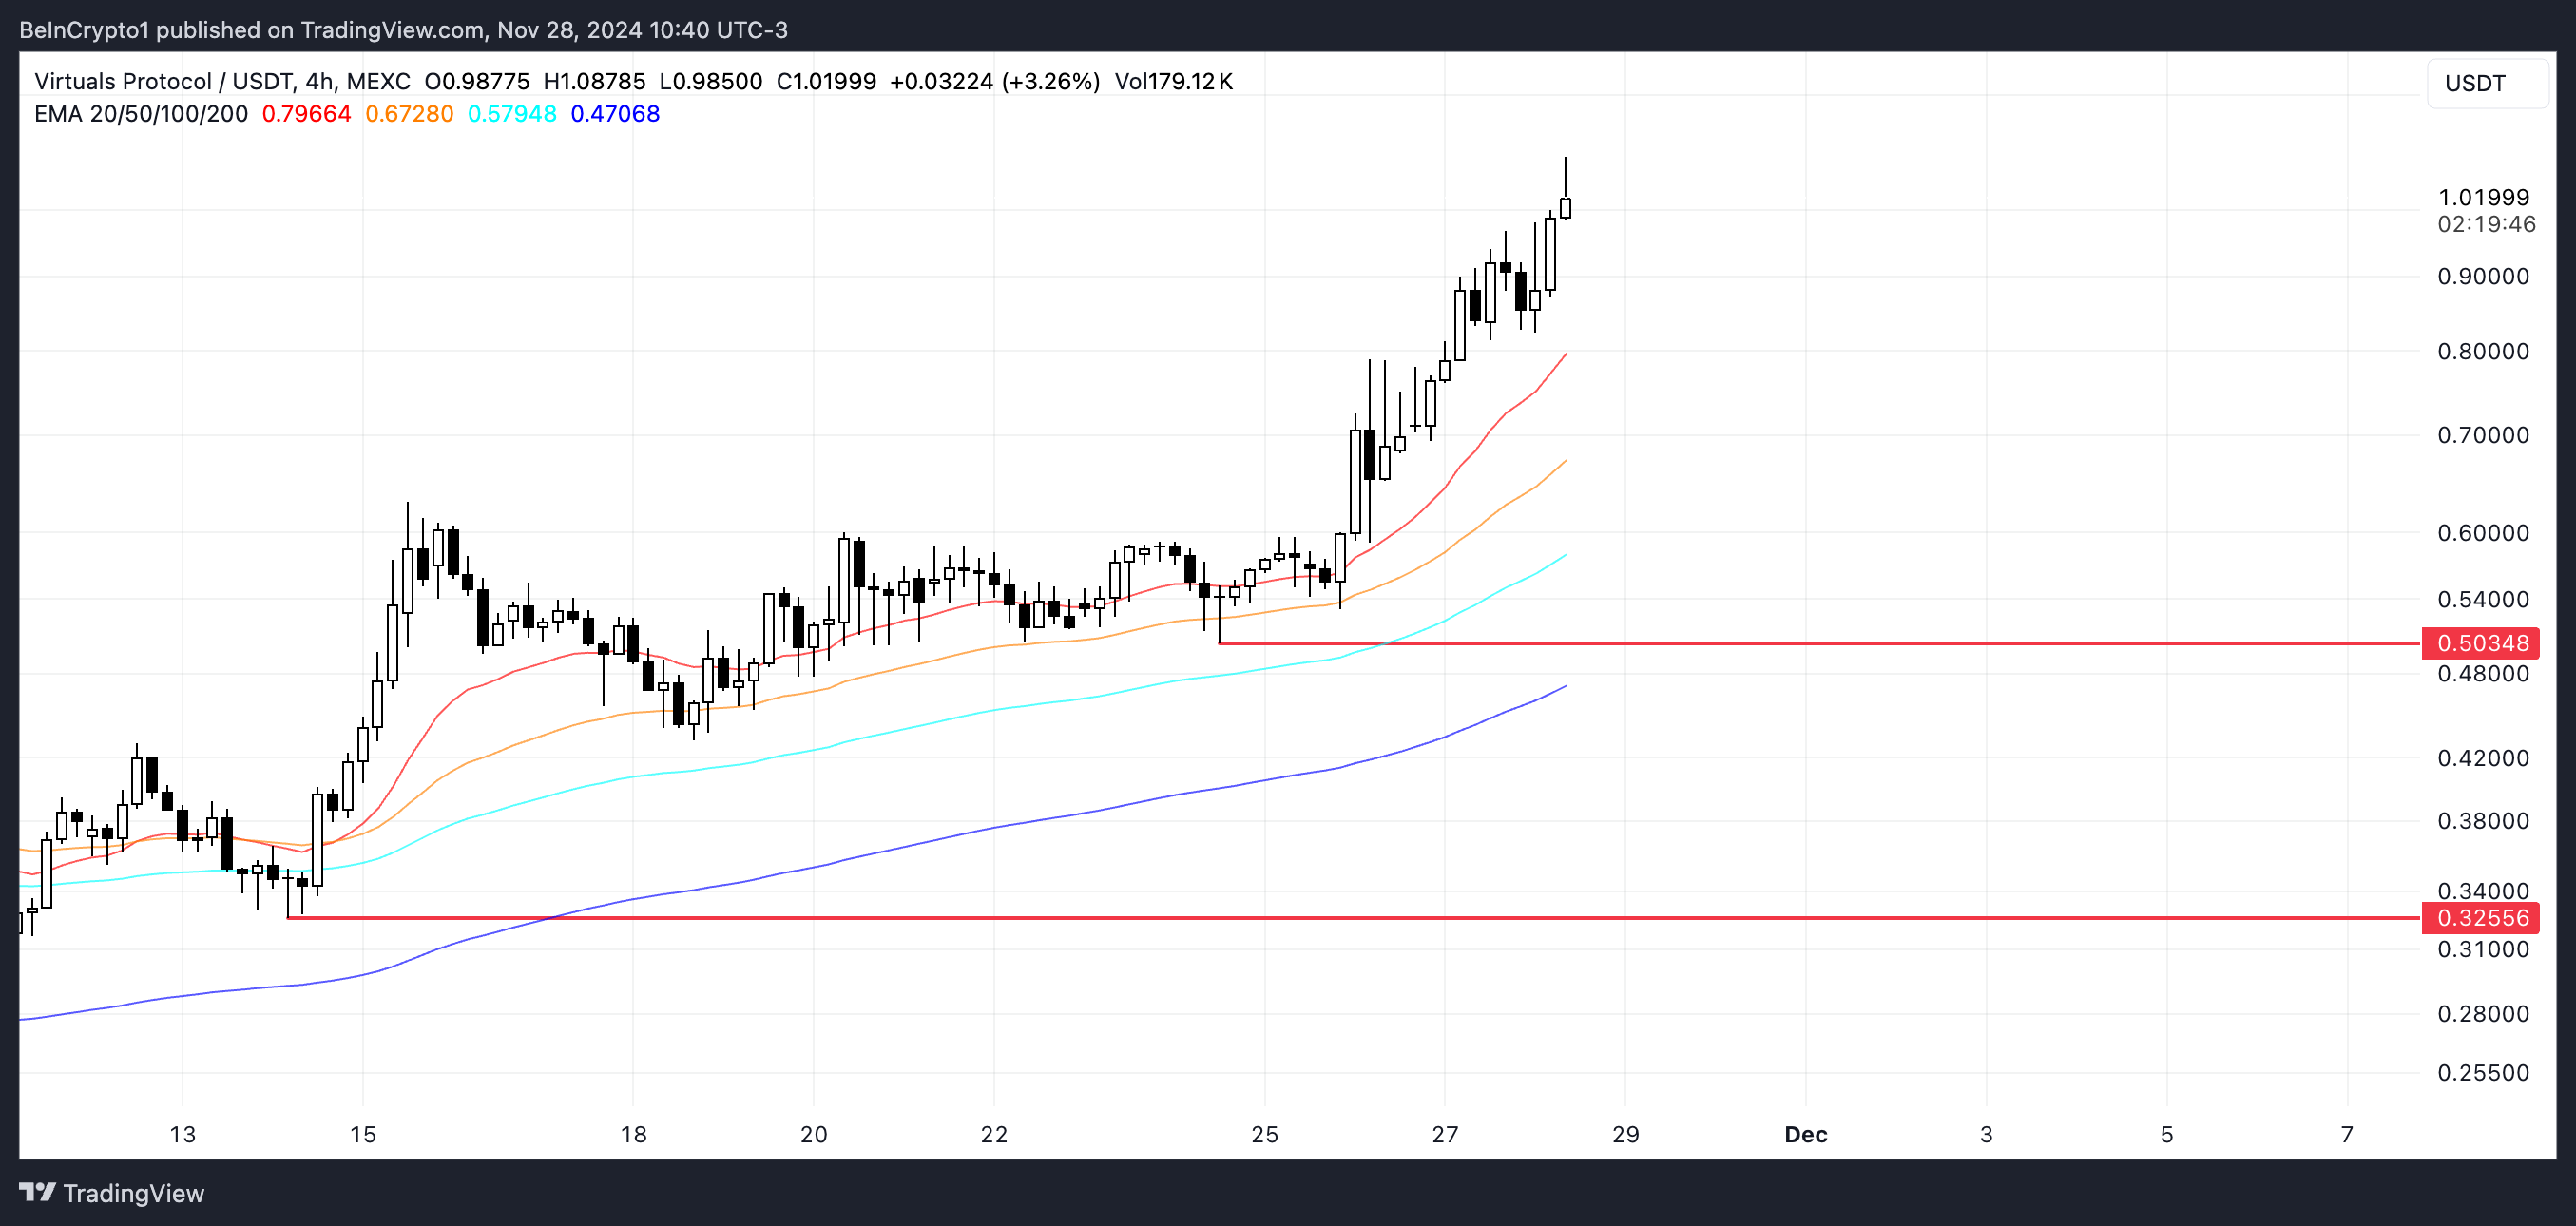
The coin has surged 161.75% in the past month, driven by growing interest in AI-focused blockchain projects. As the AI coin narrative continues to gain traction, VIRTUAL’s momentum suggests there could still be significant upside potential.
This recent surge has propelled VIRTUAL to become the fifth-largest AI coin by market cap. It now ranks behind RENDER, TAO, FET, and WLD while surpassing AKT.
Pyth Network (PYTH)
Pyth (PYTH), the native token of Pyth Network, has risen 27.14% over the past 30 days, reflecting renewed interest in the blockchain oracle for market data. While PYTH reached an all-time high of $1.15 on March 16, 2024, its price remains roughly 60% below that level.

The network’s TVL has grown to $520 million from $408 million last month. That shows progress but is still far below its record $1.37 billion in March.
If PYTH maintains its current momentum, it could break through the $0.49 resistance and test $0.55 or even $0.60 in the near term. Its oracle business could also be positively impacted by altcoins season.
Raydium (RAY)
Raydium (RAY) has emerged as the most dominant decentralized exchange globally, surpassing platforms like Uniswap and PancakeSwap in fees generated.
Over the past 30 days, Raydium has brought in over $200 million in fees, outperforming major projects like Jito, Solana, Ethereum, Circle, and Uniswap, second only to Tether. Raydium could continue growing as meme coins become more relevant in the crypto ecosystem.

RAY is currently up 61.40% in the past month and an astounding 1,345.81% in the past year, though it remains 67.87% below its all-time high from 2021.
Given Raydium’s dominance and rapid growth, the token’s recent performance could signal the beginning of an even stronger upward trajectory as altcoins season is just getting started.
Disclaimer
In line with the Trust Project guidelines, this price analysis article is for informational purposes only and should not be considered financial or investment advice. BeInCrypto is committed to accurate, unbiased reporting, but market conditions are subject to change without notice. Always conduct your own research and consult with a professional before making any financial decisions. Please note that our Terms and Conditions, Privacy Policy, and Disclaimers have been updated.
Market
Can Shiba Inu Coin Holders Push SHIB Price Higher?

Shiba Inu (SHIB) coin holders, instrumental in the meme coin’s recent recovery, are driving the potential for another rally. Over the past three days, a significant number of SHIB tokens have been moved off exchanges, signaling strong activity.
With this in place, SHIB’s price might climb above $0.000025. But do other metrics align with the bias?
Shiba Inu Investors Continue to HODL
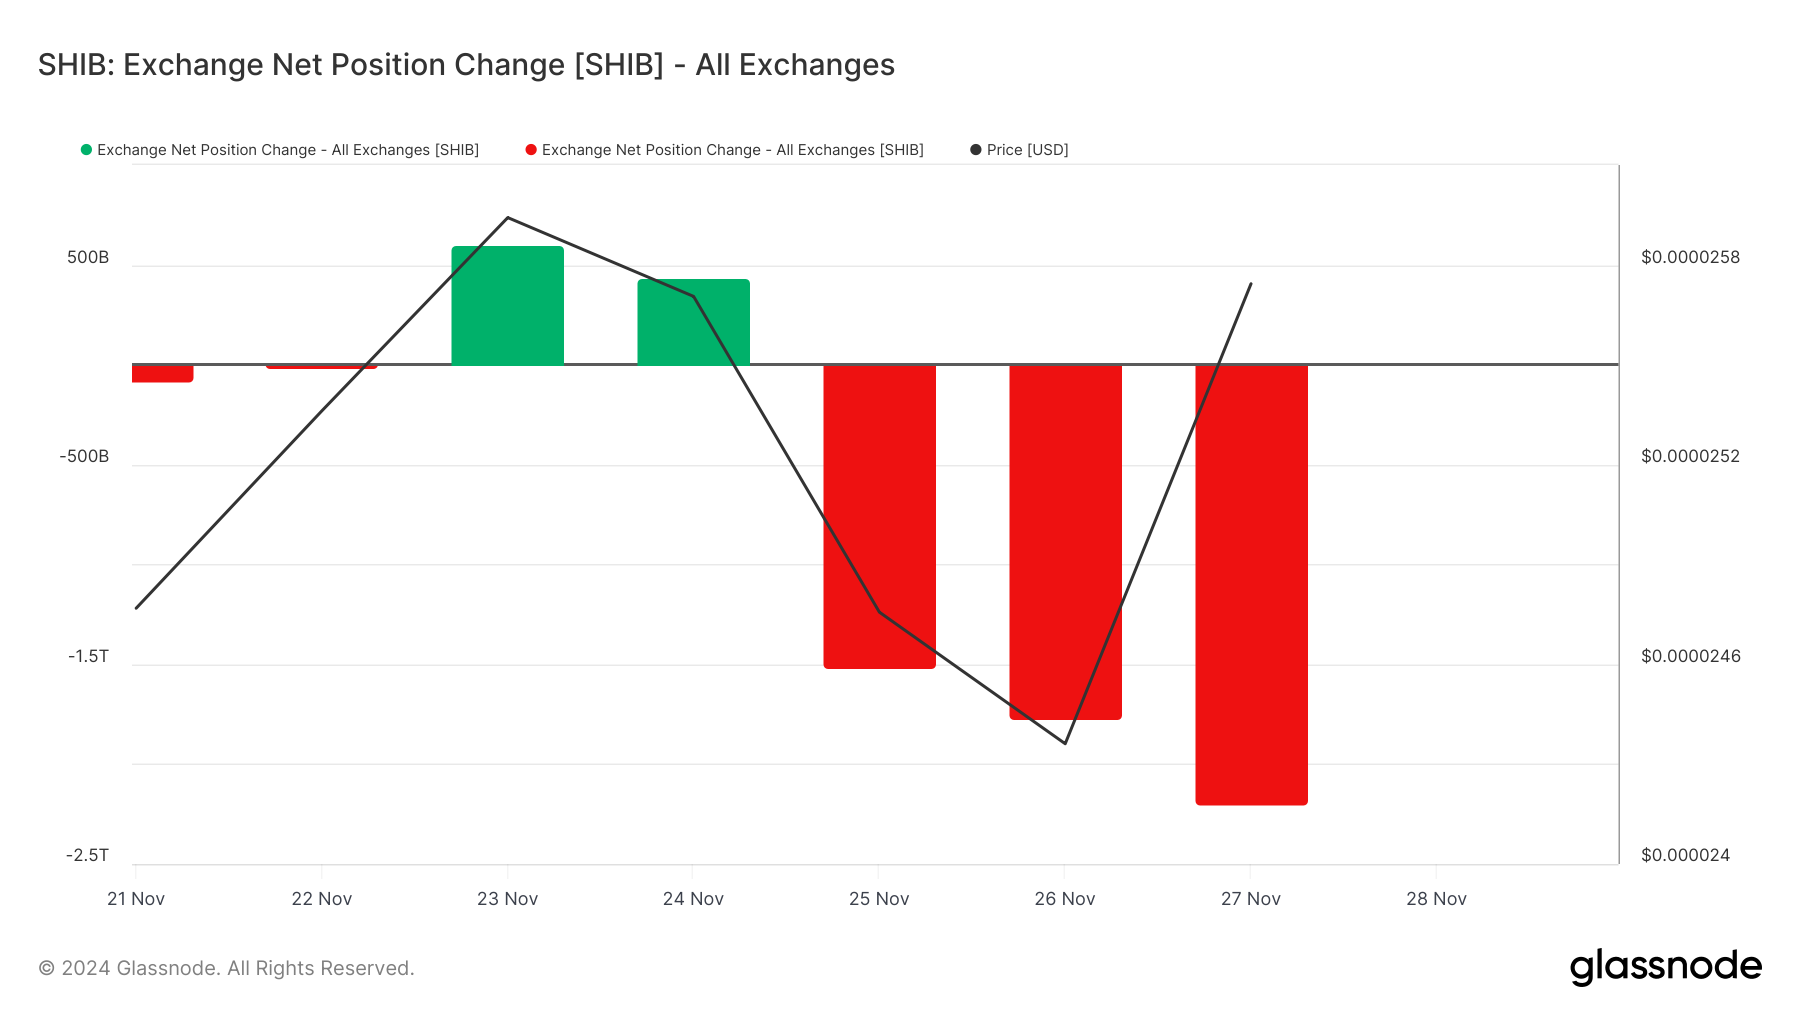
On November 23, Glassnode data showed an increase in the number of SHIB tokens on exchanges. Interestingly, this coincided with the token’s price drop to $0.000024. However, over the last three days, Shiba Inu coin holders have taken a cumulative 5.45 trillion tokens off exchanges.
At the cryptocurrency’s current price, this is worth about $162 million. Typically, when more tokens enter exchanges, it means that most holders are willing to sell, which could negatively affect the price.
Since most Shiba Inu coin holders move their assets off these platforms, they do not plan to let go in the short term. If sustained, then SHIB’s price could climb higher soon.
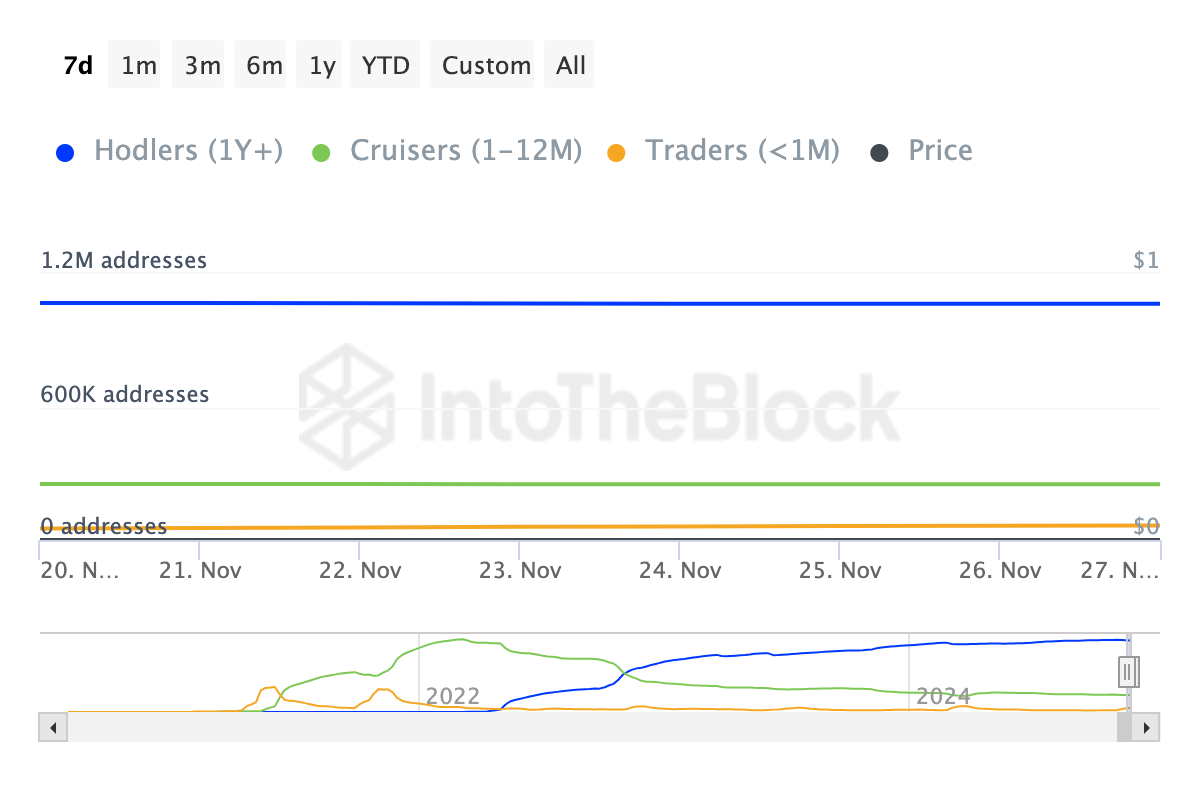
Besides that, data from IntoTheBlock shows that several short-term SHIB holders have refrained from selling the token within the last 30 days. This data is according to the Balance by Time Held.
When the metric increases, it implies that most holders still have a chunk of the asset in their possession. On the other hand, a decline implies that most are selling, which is bearish for the cryptocurrency.
Therefore, if these short-term Shiba Inu holders maintain their position, then the token’s value might not experience a significant drawdown.
SHIB Price Prediction: Token Forms Bull Flag
On the daily chart, SHIB’s price has formed a bull flag on the daily chart. A “bull flag” is a technical chart pattern that indicates a potential continuation of an uptrend. It begins with a sharp price surge (the “flagpole”) followed by a brief consolidation in a tight range (the “flag”).
This pattern resembles a flag on a pole and suggests that once the consolidation phase ends, the price is likely to break out. As seen below, SHIB’s price seems to be following this pattern. Thus, if buying pressure increases, the token’s value could surge to $0.000030.
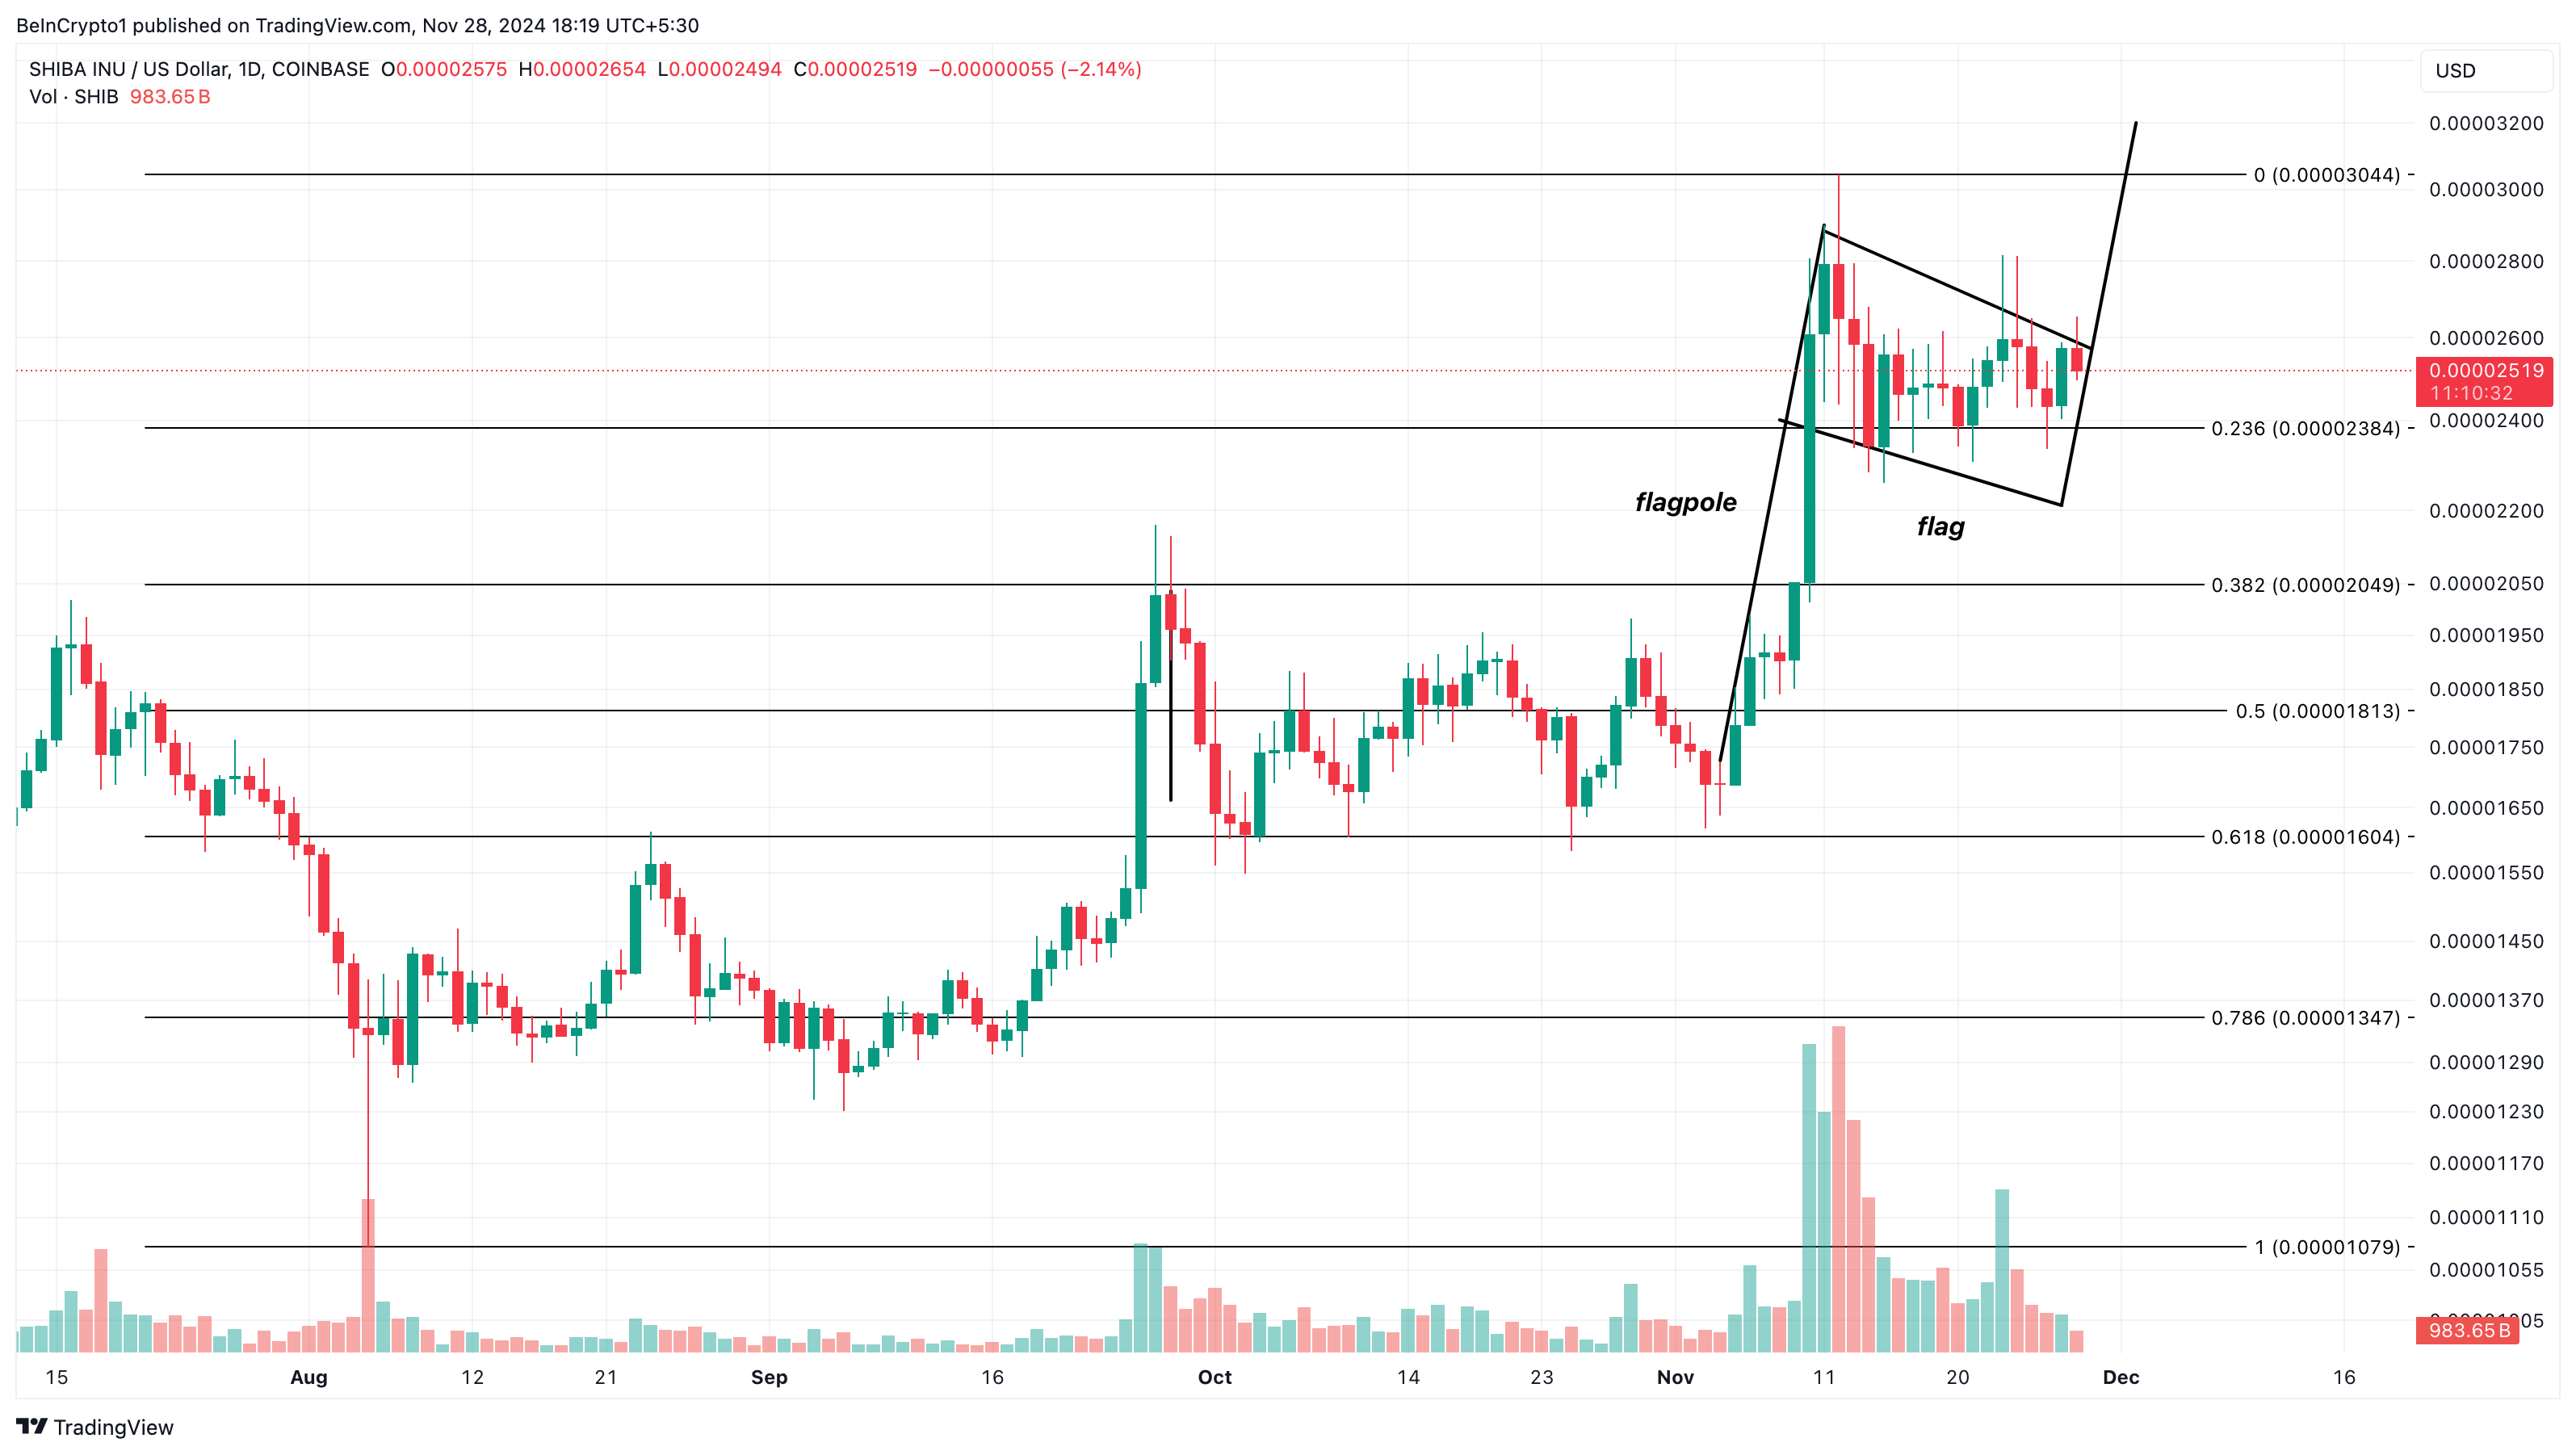
In a highly bullish scenario, the crypto’s value could rise to $0.000032. On the flip side, if Shiba Inu coin holders decided to move more tokens into exchanges, this trend might change. Should that be the case, the meme coin could drop to $0.000020.
Disclaimer
In line with the Trust Project guidelines, this price analysis article is for informational purposes only and should not be considered financial or investment advice. BeInCrypto is committed to accurate, unbiased reporting, but market conditions are subject to change without notice. Always conduct your own research and consult with a professional before making any financial decisions. Please note that our Terms and Conditions, Privacy Policy, and Disclaimers have been updated.
-

 NFT8 hours ago
BitBasel + VESA
-

 Regulation20 hours ago
Vancouver mayor proposes Bitcoin as city reserve asset for stability
-

 Market17 hours ago
This is Why Paul Atkins Will Likely Lead Trump’s SEC After Gensler
-
 Altcoin9 hours ago
SHIB Burn Rate Spikes 4500%, Shiba Inu Coin To Set Go Parabolic?
-

 Market22 hours ago
21Shares Launches Four New Crypto ETP Focusing on AI Tokens
-

 Market8 hours ago
$10 Million GFT Floods Market
-

 Market21 hours ago
How Did Long-Term Bitcoin Holders Reacted to BTC’s Rally?
-

 Altcoin8 hours ago
Telegram CEO Pavel Durov Endorses MAJOR Token, Will Hold For Next 10 Years


