Market
Uniswap (UNI) Price Extends Gains with Room for More Growth

Uniswap (UNI) price has surged roughly 15% in the last 24 hours, fueled by strong bullish momentum. The RSI has climbed to 67, indicating UNI is approaching overbought territory but still has room for further gains before a potential correction.
If the uptrend continues, UNI could test resistance at $13.3 and $14.8, with a potential push to $17, but a reversal could see it retest supports at $12 or drop to $8.59.
UNI RSI Isn’t Overbought Yet
Uniswap RSI surged from 50 to 67 in just one day, reflecting a strong increase in bullish momentum. The RSI, or Relative Strength Index, measures the speed and magnitude of price movements on a scale of 0 to 100.
Values above 70 indicate overbought conditions and a potential for a correction, while values below 30 suggest oversold conditions and possible recovery. The current RSI of 67 suggests UNI is approaching overbought territory but still has room for further gains.

Given the recent momentum, UNI price could continue climbing until the RSI surpasses 70, signaling stronger bullish sentiment in the short term.
Historically, coins often experience corrections after entering overbought zones. Still, with the RSI not yet there, the surge may have more room to run, as it happened at the beginning of November.
Uniswap BBTrend Is Very Positive
UNI BBTrend is currently at 16.5, remaining positive since November 24 after briefly turning negative between November 23 and November 24. The BBTrend, or Bollinger Bands Trend, measures the strength and direction of price movements relative to the Bollinger Bands.
Positive values indicate upward momentum, while negative values reflect downward pressure. The positive BBTrend signals that Uniswap is currently in a bullish phase.

Although UNI’s BBTrend is still high at 16.5, it has declined slightly from 18 yesterday, suggesting a slight weakening of bullish momentum.
This drop indicates that while the uptrend is intact, the strength of the current rally may not be as strong as before. If the BBTrend continues to decline, it could signal an upcoming consolidation or correction in UNI’s price.
UNI Price Prediction: Can It Reach $17 In November?
If Uniswap price strong uptrend continues, the price is likely to test resistances at $13.3 and $14.8 in the near term. Breaking through these levels could push UNI price as high as $17, marking its highest price since March and representing a potential 36% gain.
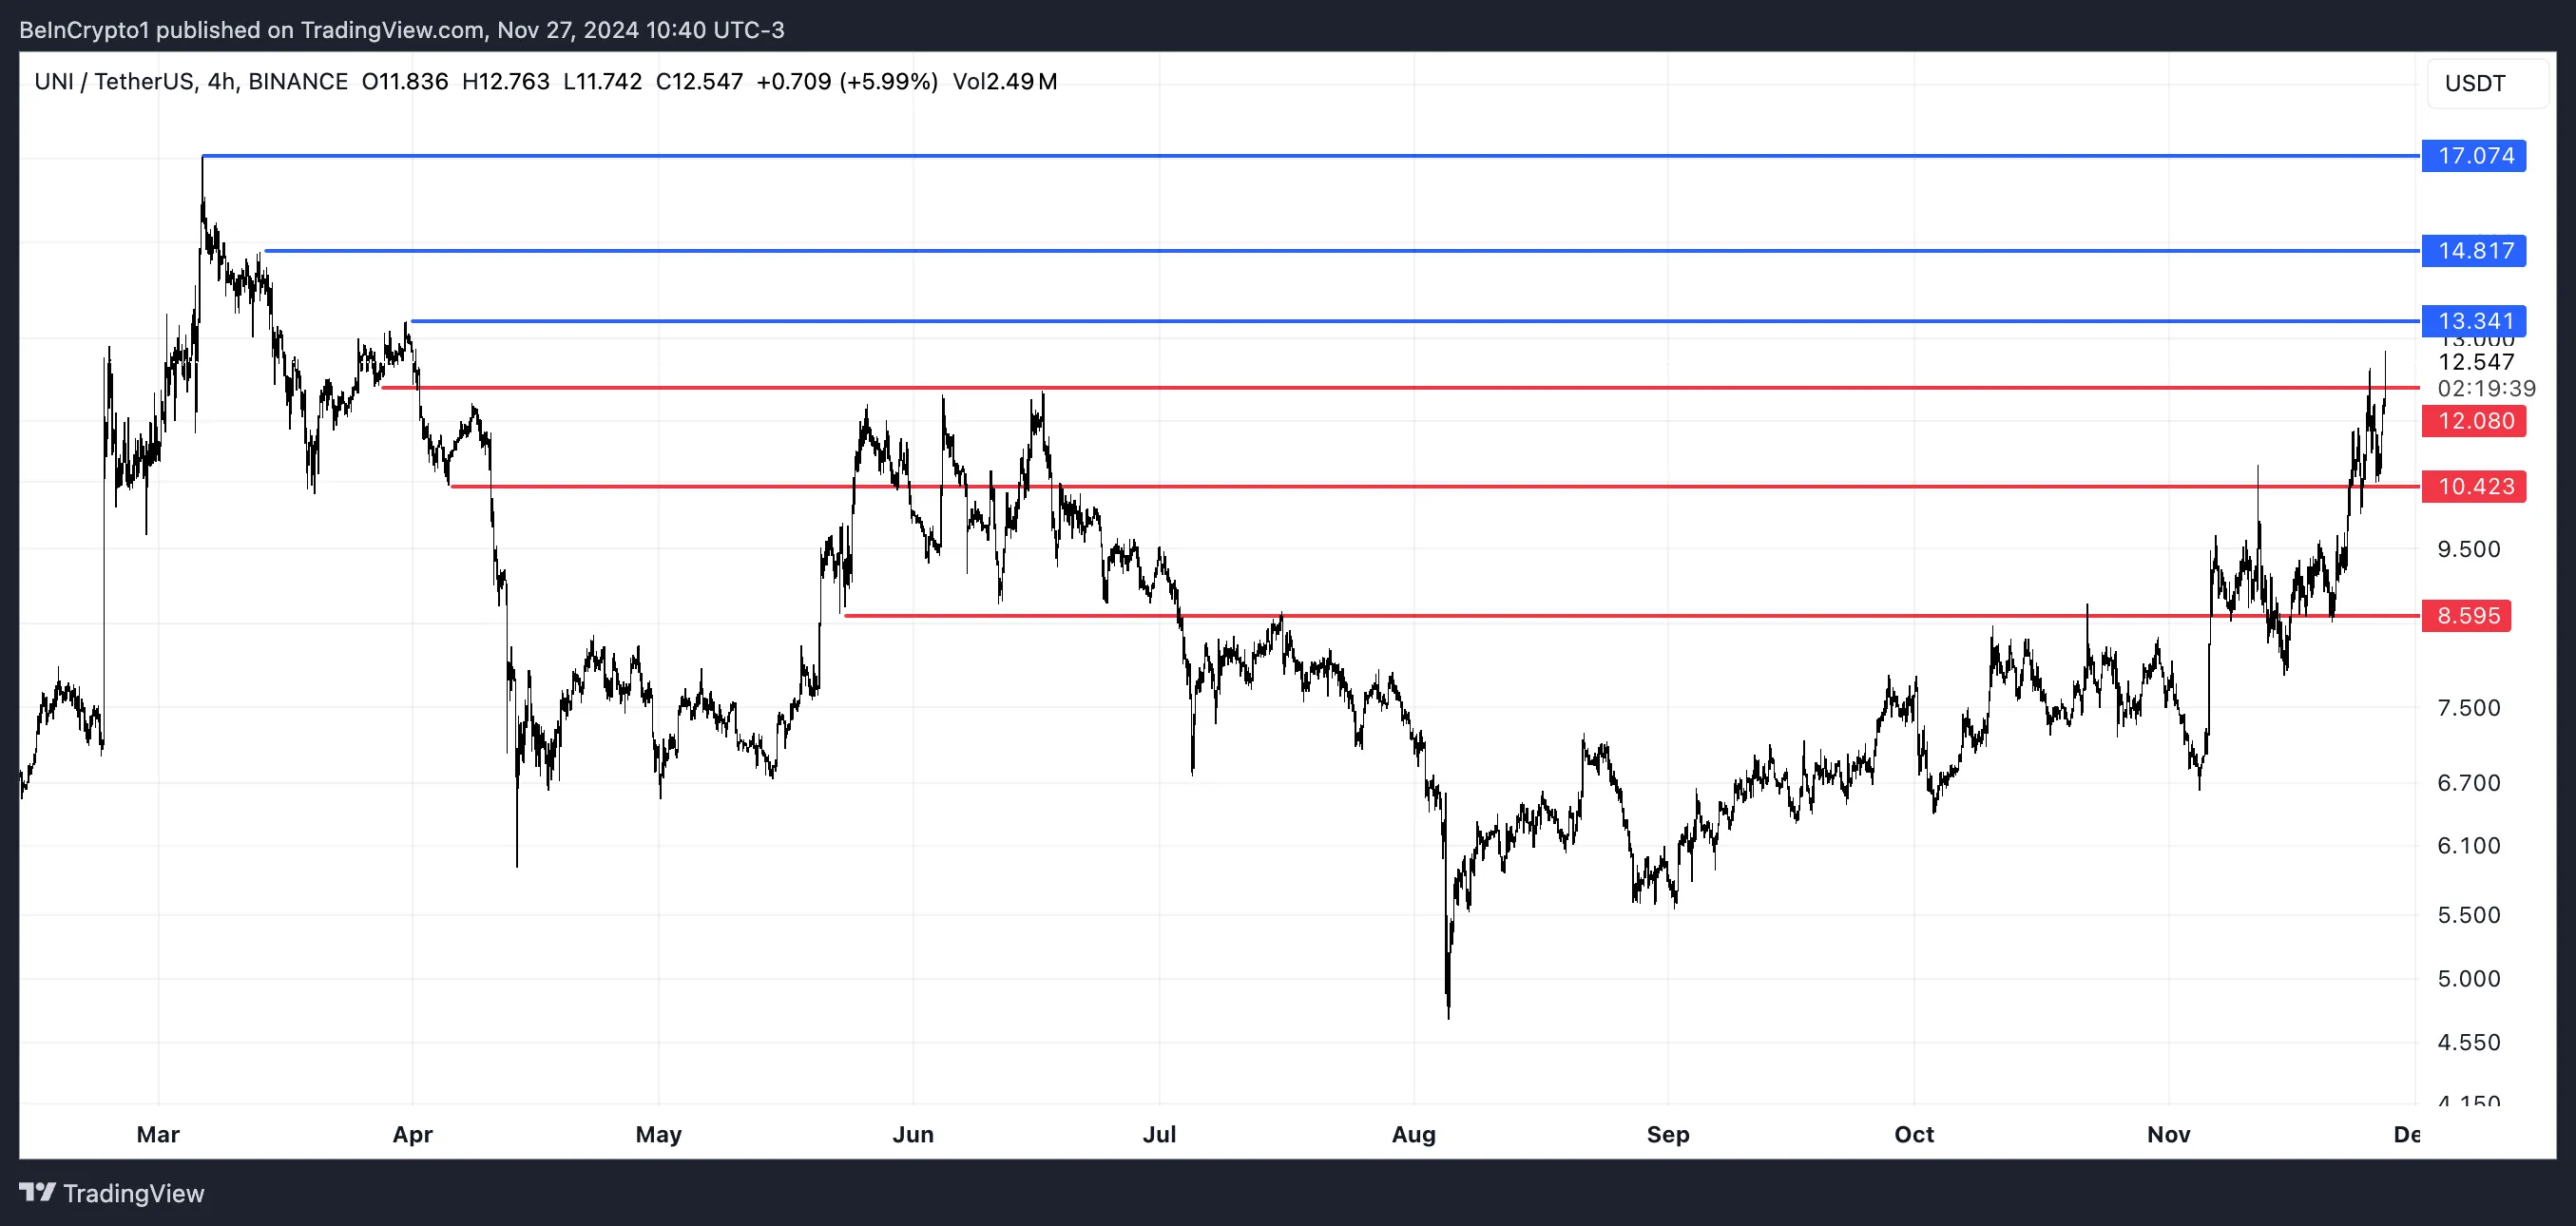
However, if the uptrend reverses, UNI price could face a retest of key supports at $12 and $10.4. Should these levels fail to hold, the price might drop further to $8.59, marking a substantial 31% correction.
Disclaimer
In line with the Trust Project guidelines, this price analysis article is for informational purposes only and should not be considered financial or investment advice. BeInCrypto is committed to accurate, unbiased reporting, but market conditions are subject to change without notice. Always conduct your own research and consult with a professional before making any financial decisions. Please note that our Terms and Conditions, Privacy Policy, and Disclaimers have been updated.
Market
This Is Why Ethereum Price May Evade Falling Below $3,000

Recently, Ethereum (ETH) showed signs of falling below $3,000 but held firm as bulls defended the altcoin.
Now trading at $3,480, here’s what could be next for ETH.
Ethereum Still Has More Room to Grow
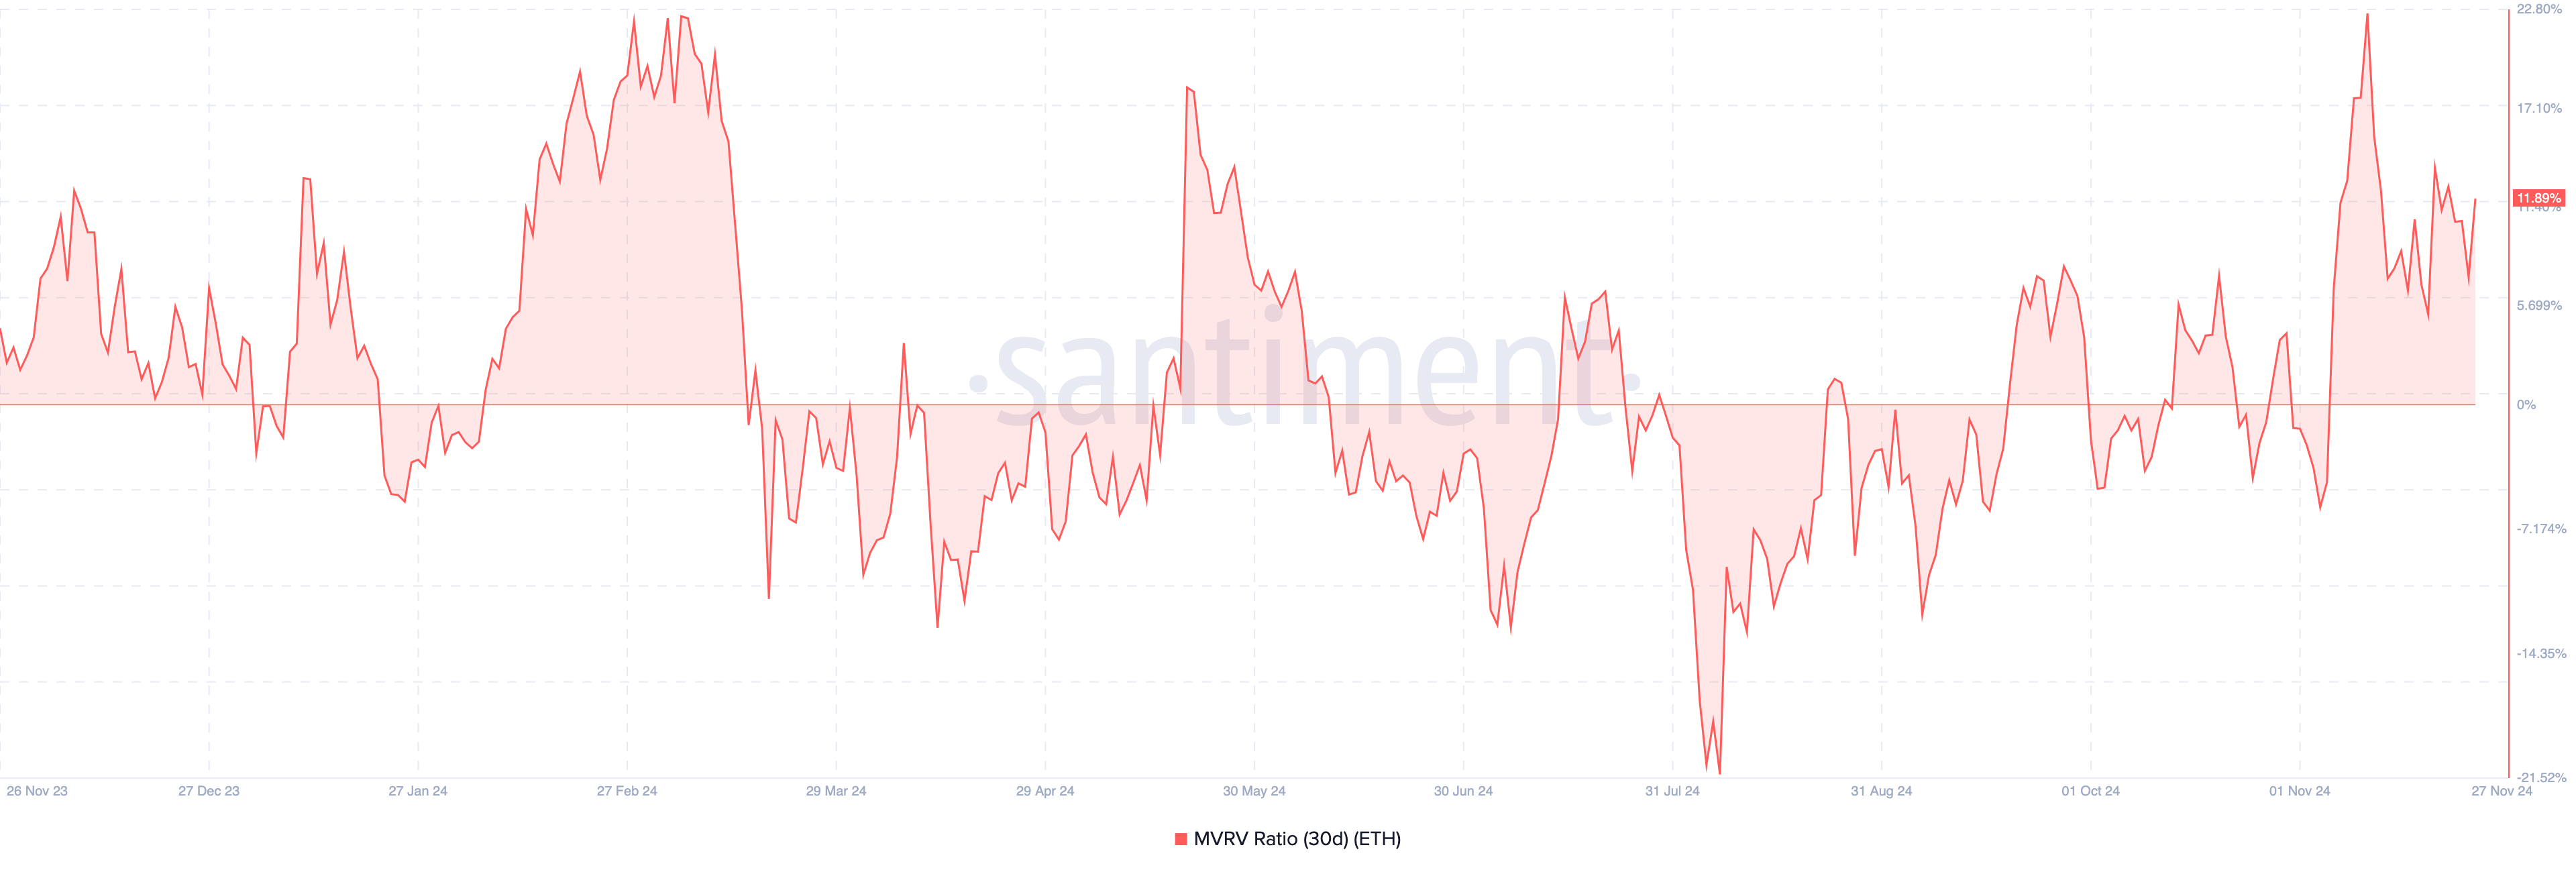
One metric that has consistently proven reliable for analyzing Ethereum is the Market Value to Realized Value (MVRV) ratio, a tool for assessing the profitability of holders and identifying potential market tops or bottoms. The MVRV ratio compares a cryptocurrency’s market value to its realized value, offering insights into whether the asset is overvalued or undervalued.
When the MVRV ratio rises, it indicates that more holders are in profit. However, if it climbs to an extreme high, it suggests the asset may be overvalued, increasing the risk of a price correction. Conversely, when the MVRV ratio declines, it points to reduced profitability.
If the ratio hits an extreme low, it signals undervaluation, which can present an attractive accumulation opportunity for investors. For ETH, the 30-day MVRV ratio has risen to 11.89%. However, this ratio is not close to the local top, which is usually around 18% and 22%. Therefore, this development suggests that Ethereum’s price.
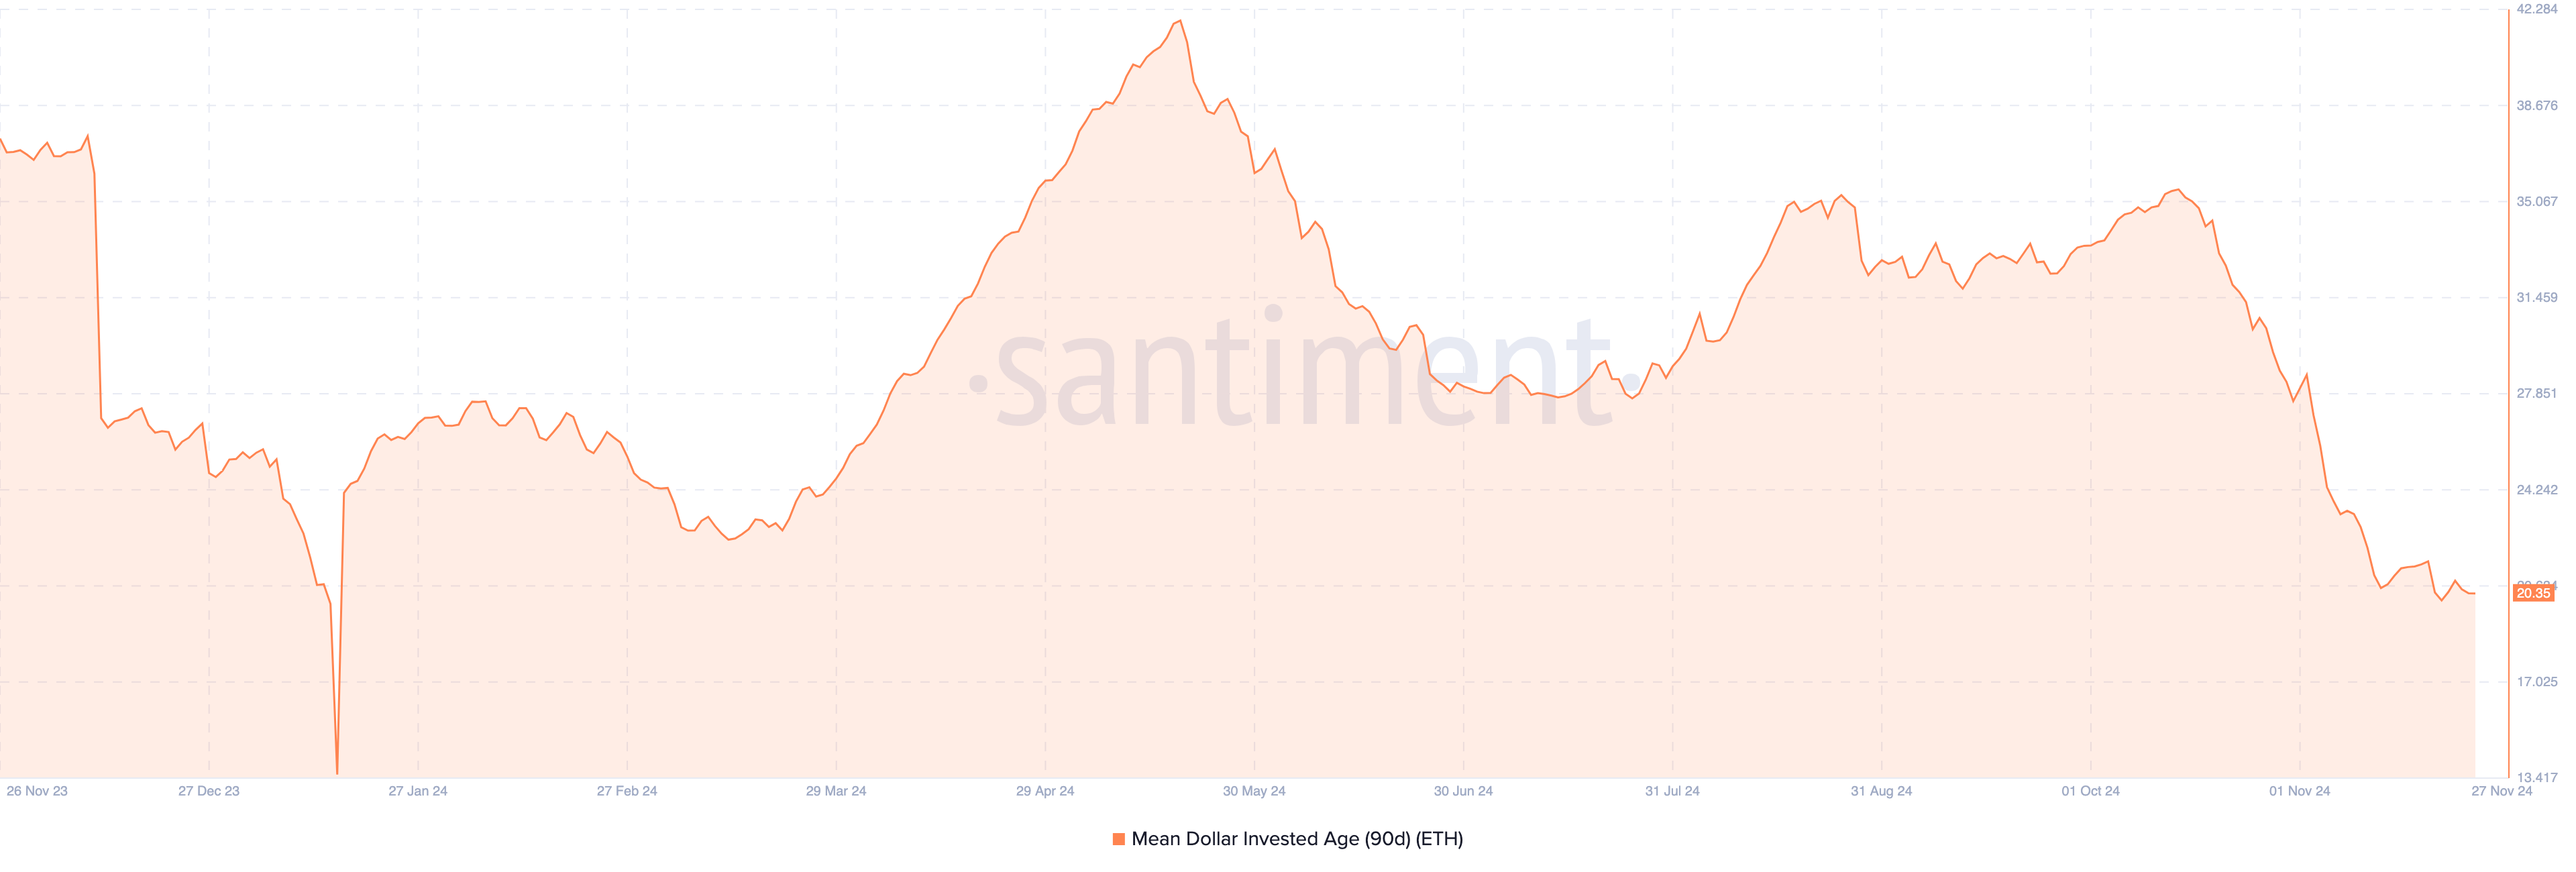
Beyond the MVRV ratio, the Mean Dollar Invested Age (MDIA) also suggests that Ethereum may avoid a further price drop. MDIA measures the average age of all coins on a blockchain, weighted by their purchase price.
A rising MDIA indicates that coins are becoming more stagnant, reducing the likelihood of a significant price surge.
Conversely, a declining MDIA suggests that previously dormant coins are moving, signaling increased trading activity, which is the case with ETH. If this trend persists, it could boost Ethereum’s chances of a price rally.
ETH Price Prediction: $4,000 Could Be Coming
On the daily chart, Ethereum’s price has formed an inverse head-and-shoulders pattern. This pattern typically emerges after a prolonged downtrend, signaling a potential sellers’ exhaustion point.
The pattern comprises three key parts: the left shoulder, which marks the first uptrend; the head, signaling the end of the downtrend; and the right shoulder, indicating the rebound.
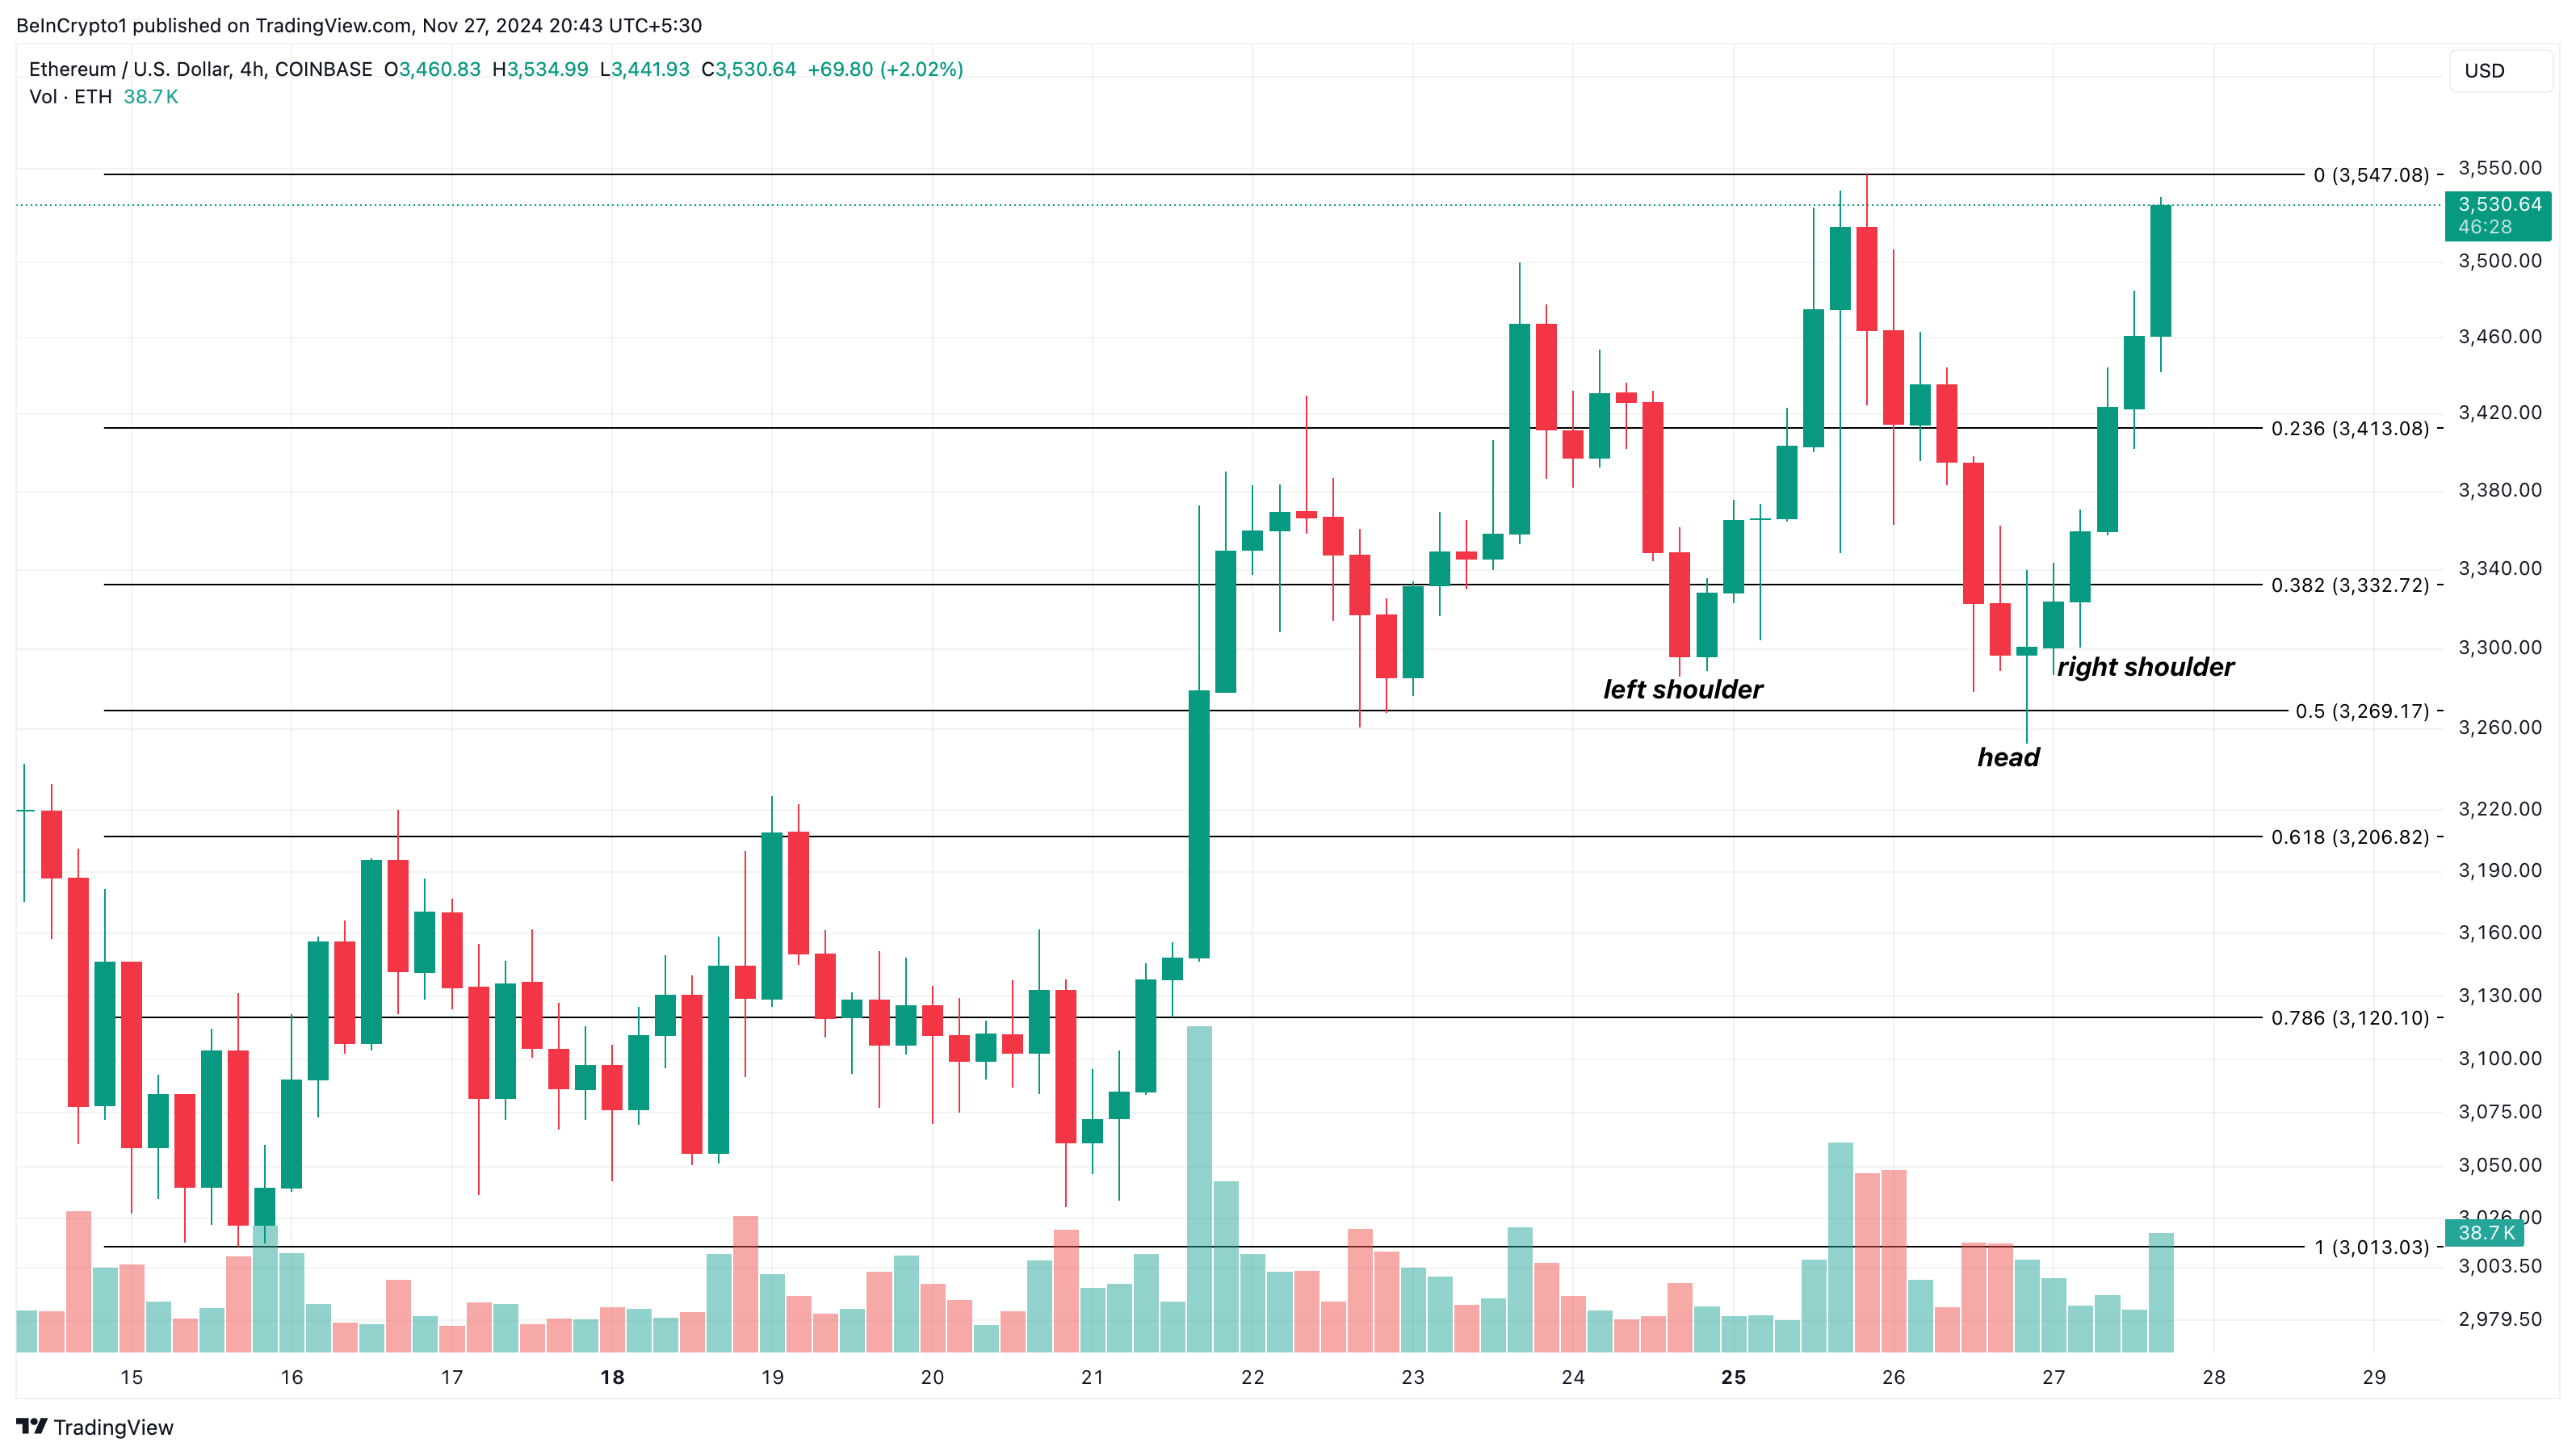
With ETH trending in an uptrend, the cryptocurrency is likely to rise toward $4,000 in the short term. On the other hand, if selling pressure rises, this might change, and ETH could decline to $3,206.
Disclaimer
In line with the Trust Project guidelines, this price analysis article is for informational purposes only and should not be considered financial or investment advice. BeInCrypto is committed to accurate, unbiased reporting, but market conditions are subject to change without notice. Always conduct your own research and consult with a professional before making any financial decisions. Please note that our Terms and Conditions, Privacy Policy, and Disclaimers have been updated.
Market
XRP Price Bullishness Continues, Analyst Shoots For $1.9 With Next Leg-Up
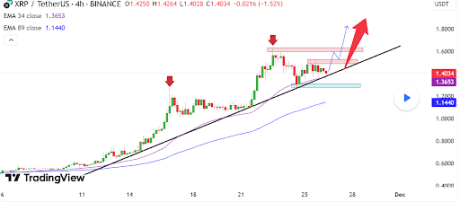
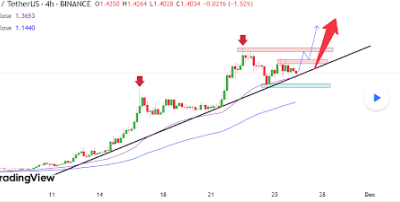
The XRP price is consolidating just below the $1.4 mark, but the technical structure continues to show bullish strength. Interestingly, XRP has been down by about 4.35% in the past 24 hours, reaching a 24-hour low of $1.296, according to Coinmarketcap data.
According to an XRP analysis on TradingView, the technical setup is still pointing to a continued price surge. The analysis suggests that XRP could soon rally further, with a near-term price target set at $1.90.
XRP Price Bullishness Continues
The XRP price surge earlier this month was very unprecedented. Particularly, the XRP price surged from a low of $0.4976 on November 3 to reach a three-year high of $1.6 on November 23. This translates to a 220% price increase in over 20 days.
Related Reading
However, since it reached this three-year high, XRP has entered a correction phase, retreating by almost 20%. Despite this price correction, XRP has largely traded above a main trendline that has propped up the price during the journey up.
As it stands, technical analysis shows that the XRP price is about to bounce off or break below this trendline, which could make or do its price trajectory from here. An adherence to this main trendline would see XRP bouncing up to the upside, much like it did on November 24. After bouncing up at this point, XRP continued from a low of $1.2775 to retest the $1.54 price level again on November 24.
Now, with the XRP price retesting this major trendline, the more bullish option is an immediate bounce to the upside. A break to the upside would see XRP resuming its uptrend up to the $1.9 price level. Keeping this in mind, the analyst emphasized critical price zones that could shape XRP’s trajectory in the coming sessions. The range between $1.520 and $1.620 has been identified as a crucial area where the price could encounter strong resistance in the coming sessions.

Related Reading
What’s Next For XRP?
At the time of writing, XRP is trading at $1.39 and is still trading around this main trend line. However, the price has yet to show a decisive bounce from this level. Particularly, current price action points to a continued consolidation in the past few hours.
While the XRP price continues to exhibit signs of bullishness, there exists the possibility of a break to the downside. This break to the downside would be highlighted by a daily close below $1.38. Should this occur, XRP is likely to extend its decline with a retest of the next significant support at $1.32.
Featured image created with Dall.E, chart from Tradingview.com
Market
How Did Long-Term Bitcoin Holders Reacted to BTC’s Rally?

Long-term Bitcoin (BTC) holders have started taking profits since the cryptocurrency price attempted to reach $100,000. As a result, Bitcoin’s price has retraced to $93,000, affecting the value of the broader crypto market capitalization.
Is Bitcoin’s price rebounding? Short-term investors may want to know as this on-chain analysis examines the chances.
Activity Around Bitcoin Drops, Holders Book Gains
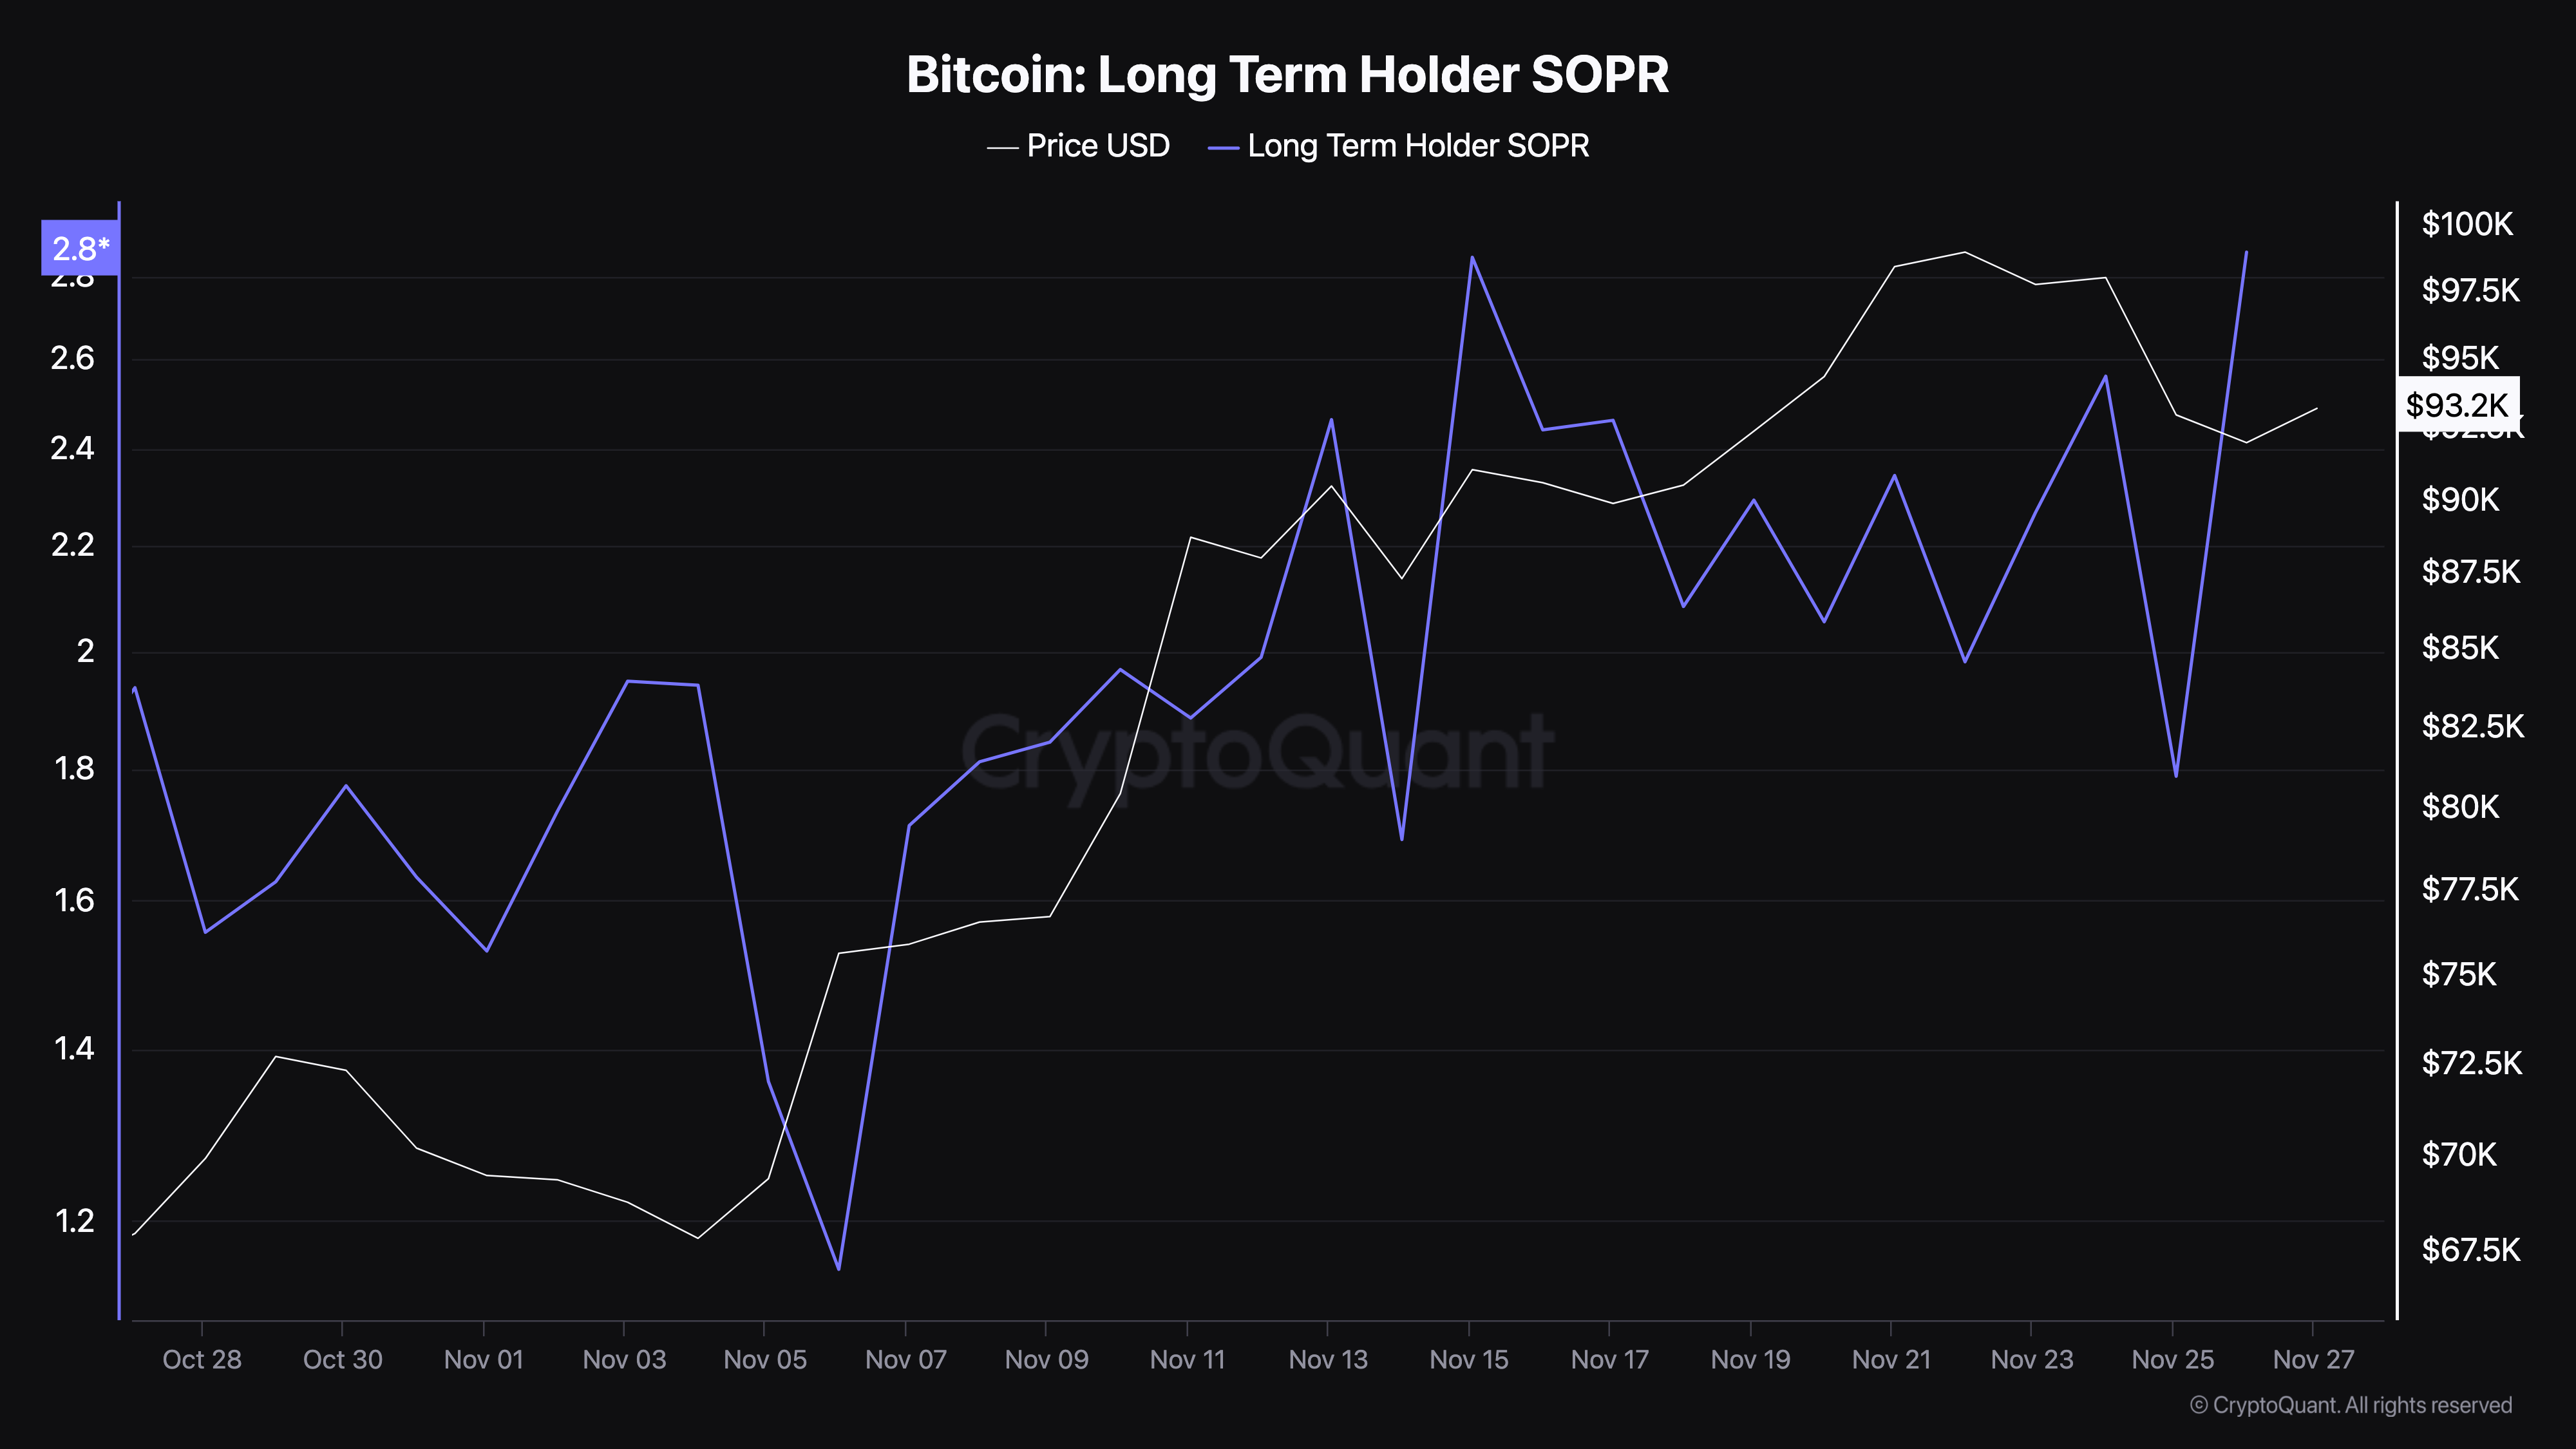
According to CryptoQuant, Bitcoin’s long-term profit output ratio has surged to 2.86. This ratio measures the activity of long-term investors who have held the coin for more than 155 days.
When the ratio is over 1, it means that these long-term Bitcoin holders are selling at a profit. On the other hand, if the profit output ratio is less than 1, it implies that holders are selling at a loss. Since the reading is higher, it indicates that these holders are booking profits from the recent price hike.
Besides that, it is noteworthy to mention that this profit-taking is the highest holders have taken since August 30. Should this continue, then BTC price risks falling below the $93,000 threshold.
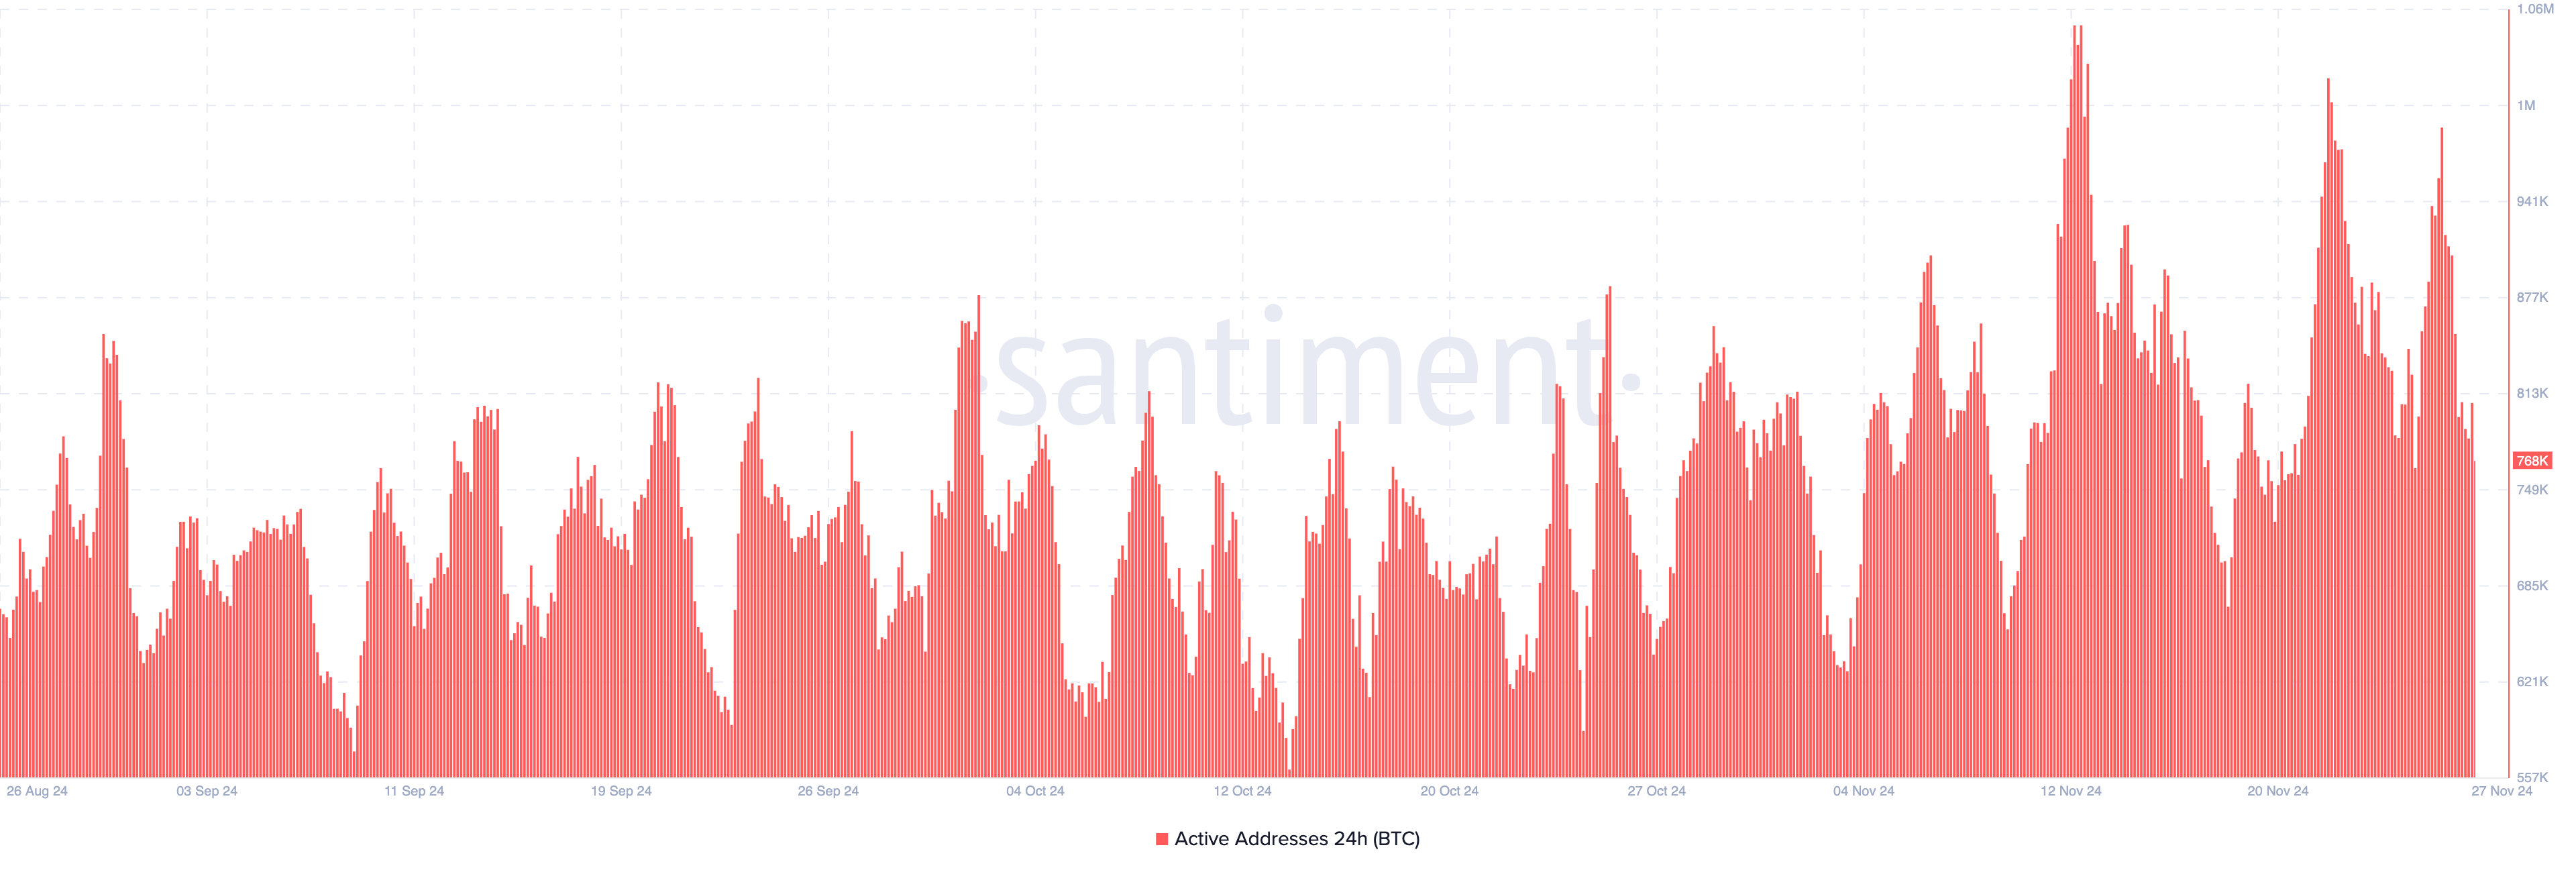
Beyond that, active addresses on the Bitcoin network have significantly decreased this week, which could spell trouble for the cryptocurrency’s price if the trend persists. Active addresses measure the number of unique addresses involved in transactions, reflecting user engagement with the blockchain.
When active addresses increase, it indicates growing network activity and adoption. Conversely, a decline suggests reduced participation.
On November 26, Bitcoin’s active addresses were nearly 1 million, showcasing significant traction. However, as of this writing, the figure has dropped to 768,000, a noticeable decline. If active address activity continues to wane, it may signal weakened market sentiment and could contribute to further price declines, as previously highlighted.
BTC Price Prediction: Time to Go Below $90,000?
On the daily chart, Bitcoin’s price has fallen below the dotted lines of the Parabolic Stop and Reverse (SAR) indicator. This technical tool identifies support and resistance levels.
Dotted lines below the price signal strong support, while lines above the price suggest resistance that could lead to a decline. Currently, Bitcoin faces the latter scenario.
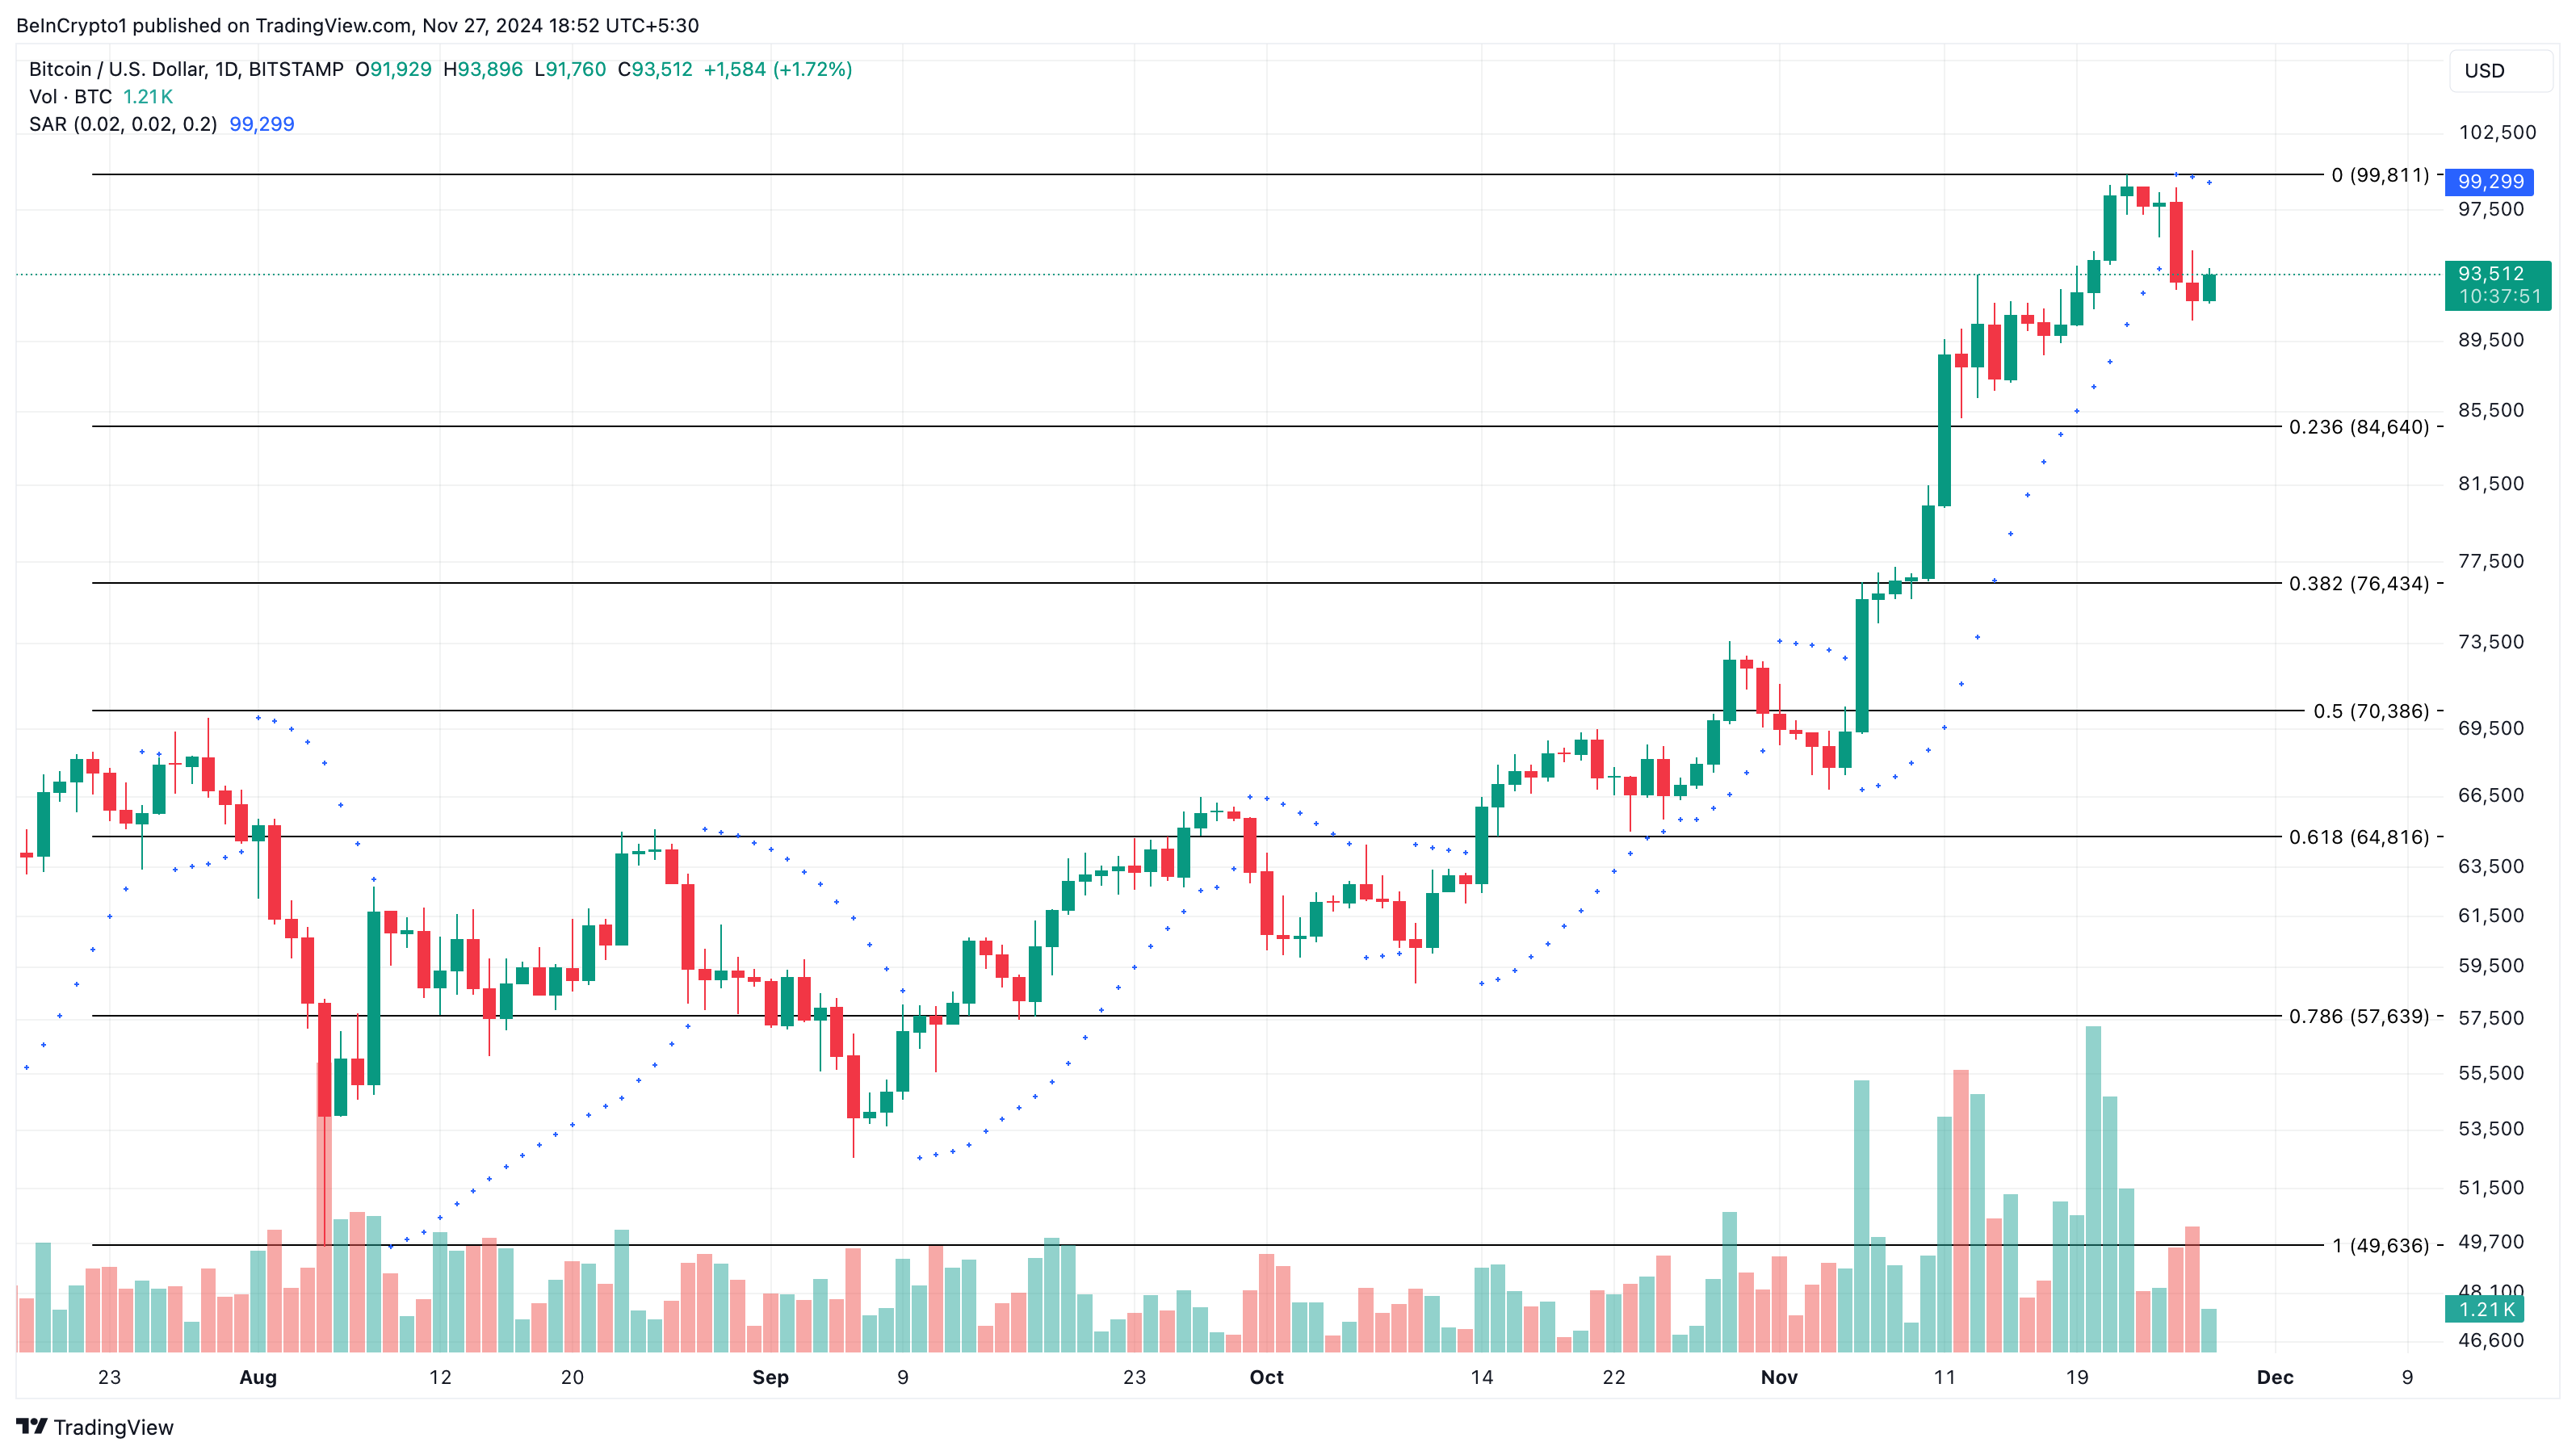
If this resistance persists, BTC could drop to $84,640. However, if long-term holders reduce profit-taking, Bitcoin’s value might rise instead, potentially reaching $99,811.
Disclaimer
In line with the Trust Project guidelines, this price analysis article is for informational purposes only and should not be considered financial or investment advice. BeInCrypto is committed to accurate, unbiased reporting, but market conditions are subject to change without notice. Always conduct your own research and consult with a professional before making any financial decisions. Please note that our Terms and Conditions, Privacy Policy, and Disclaimers have been updated.
-

 Market24 hours ago
Metaverse Crypto Developments Boost Engagement in November
-

 Regulation24 hours ago
Donald Trump Plans To Give CFTC Oversight of $3T Crypto Market
-

 Market23 hours ago
Kraken Closes NFT Marketplace Amid Market Challenges
-

 Altcoin23 hours ago
Analyst Says the Dogecoin Price Will Keep Outperforming Bitcoin While This Altcoin Aims for a 43,209% Rally
-

 Regulation23 hours ago
US Court Rules Tornado Cash Smart Contracts Not Property, Lifts Ban
-

 Market22 hours ago
Solana (SOL) Price Correction Threatens Death Cross Formation
-

 Altcoin21 hours ago
Analyst Reveals The ‘Truth’ Behind This Dogecoin Price Rally
-

 Market21 hours ago
Dogecoin (DOGE) Price Weakens as Bears Take Control


