Market
Will the Cardano Coin Price Rally Continue?

ADA, the native coin of the Cardano blockchain, has made a significant price breakthrough. It has surpassed the $1 mark for the first time in two years. As of this writing, the altcoin trades at $1.09, a price level last observed in April 2022. `
Over the past 24 hours, ADA’s price has rocketed by 24%, and its trading volume has increased by 131% during the same period. With heightening buying pressure, the Cardano coin price rally is poised to continue.
Cardano Holders See Green
Cardano’s ascent above the $1 price mark has put many of its holders in profit. According to IntoTheBlock’s Global In/Out of the Money indicator, 3.15 million addresses, which comprise 71% of all ADA holders, are “in the money.”
An address is said to be “in the money” if the current market price of the asset it holds is higher than the average cost at which the address acquired those tokens. This means the holder would profit if they sold their holdings at the current market price.
Conversely, 715,230 addresses, which comprise 16% of all ADA holders, are “out of the money.” These addresses would incur a loss if they sold at the current price. Per IntoTheBlock’s data, this cohort of investors acquired their coins when ADA sold above $1.40.

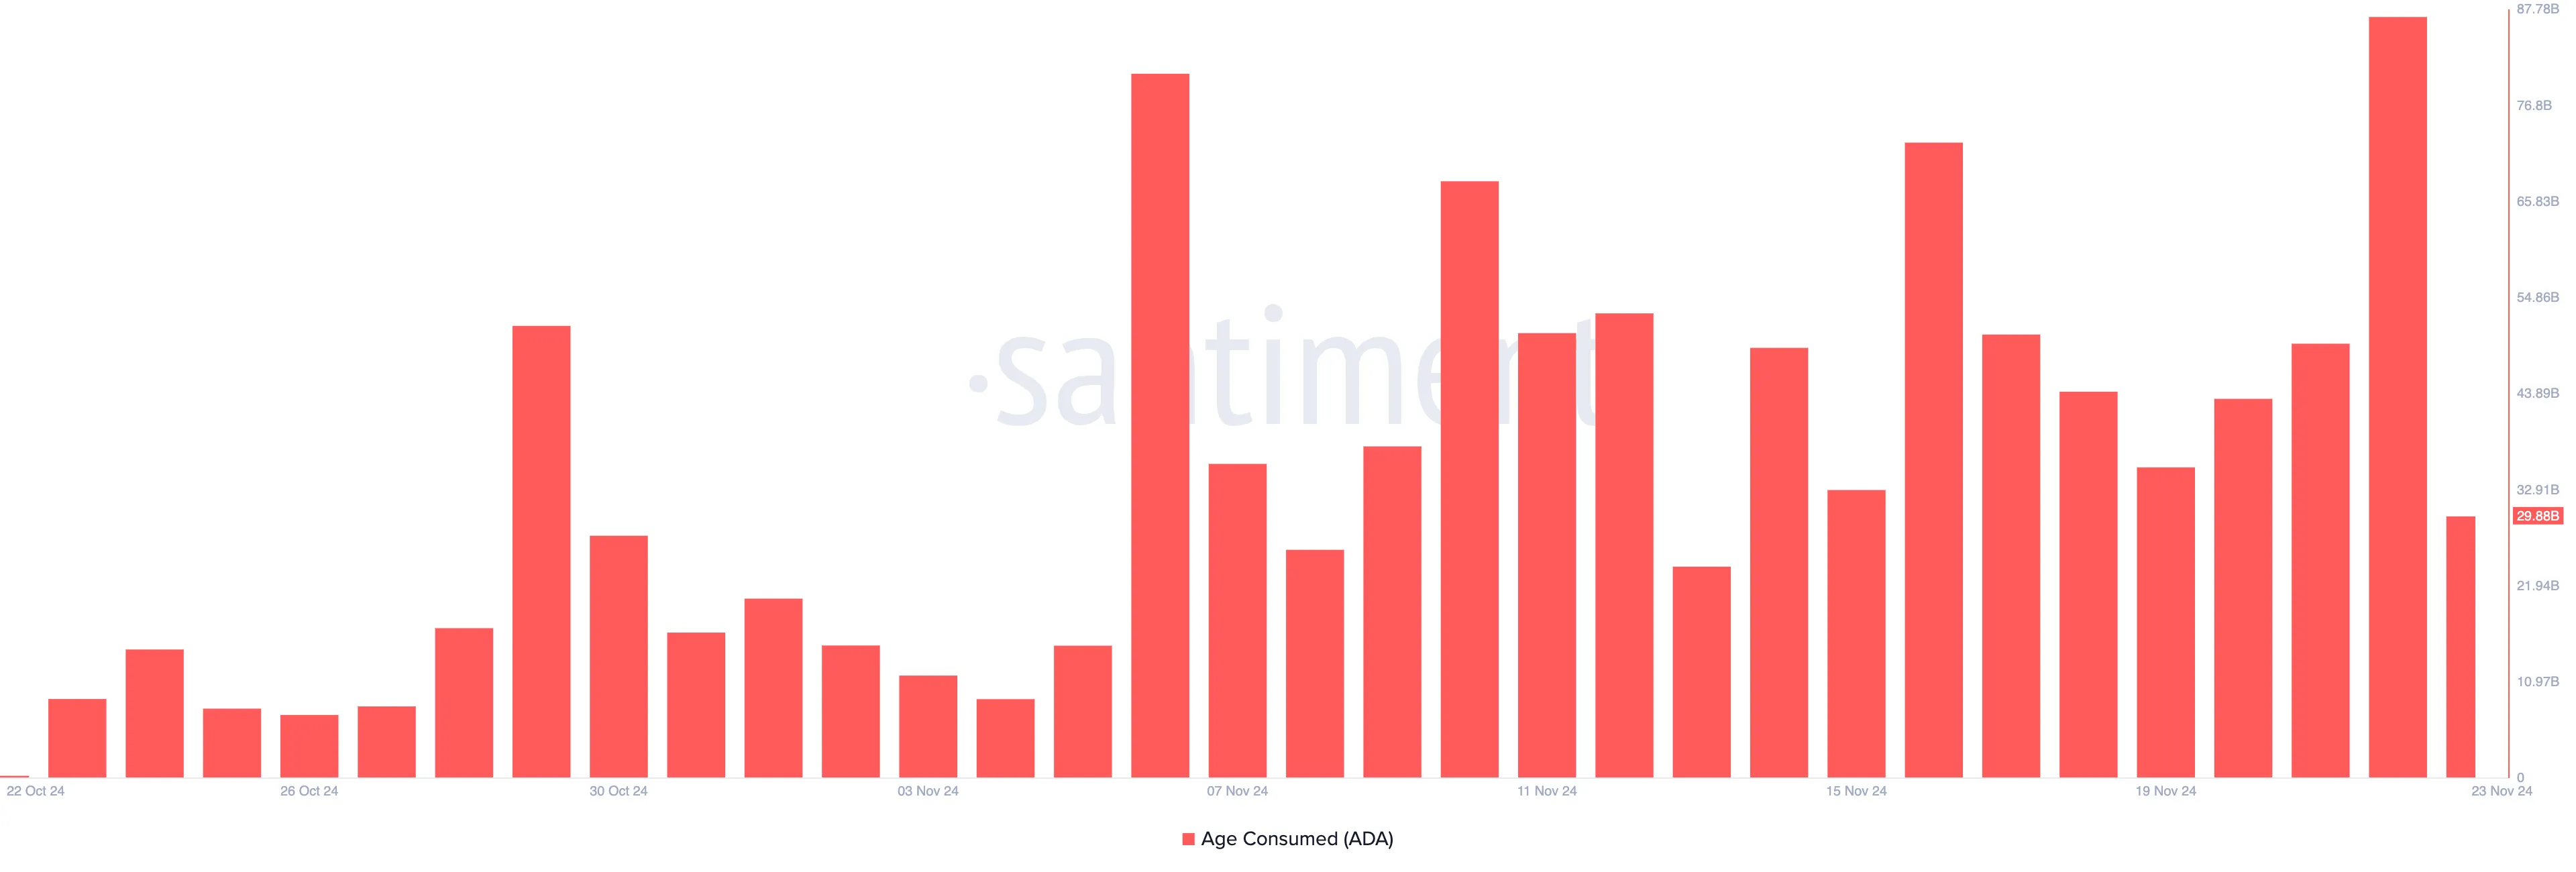
Notably, with many addresses now holding unrealized profits, long-term holders (LTHs) of ADA are repositioning, potentially to secure gains. This activity is reflected by the spike in ADA’s age-consumed metric, which, per Santiment’s data, skyrocketed to a monthly high of 86.91 billion on November 22, when the uptrend began.
This surge is notable because long-term holders rarely move their coins around. When they do, it often hints at a shift in market trends. Therefore, as in ADA’s case, if the spike is accompanied by increased trading volume and positive price action, it suggests that long-term holders are taking profits. This may fuel further price increases as new buyers enter the market.
ADA Price Prediction: The Upward Trend Is Strong
On the daily chart, ADA’s Aroon Up Line is at 100%. The Aroon indicator measures the strength and direction of a trend. When the Aroon Up line is at 100%, it indicates a strong upward trend, suggesting a recent high and a potential continuation of the bullish momentum.
If this holds and new demand continues to enter the market, the Cardano coin price rally will continue toward $1.24, a price high it last reached in March 2022.
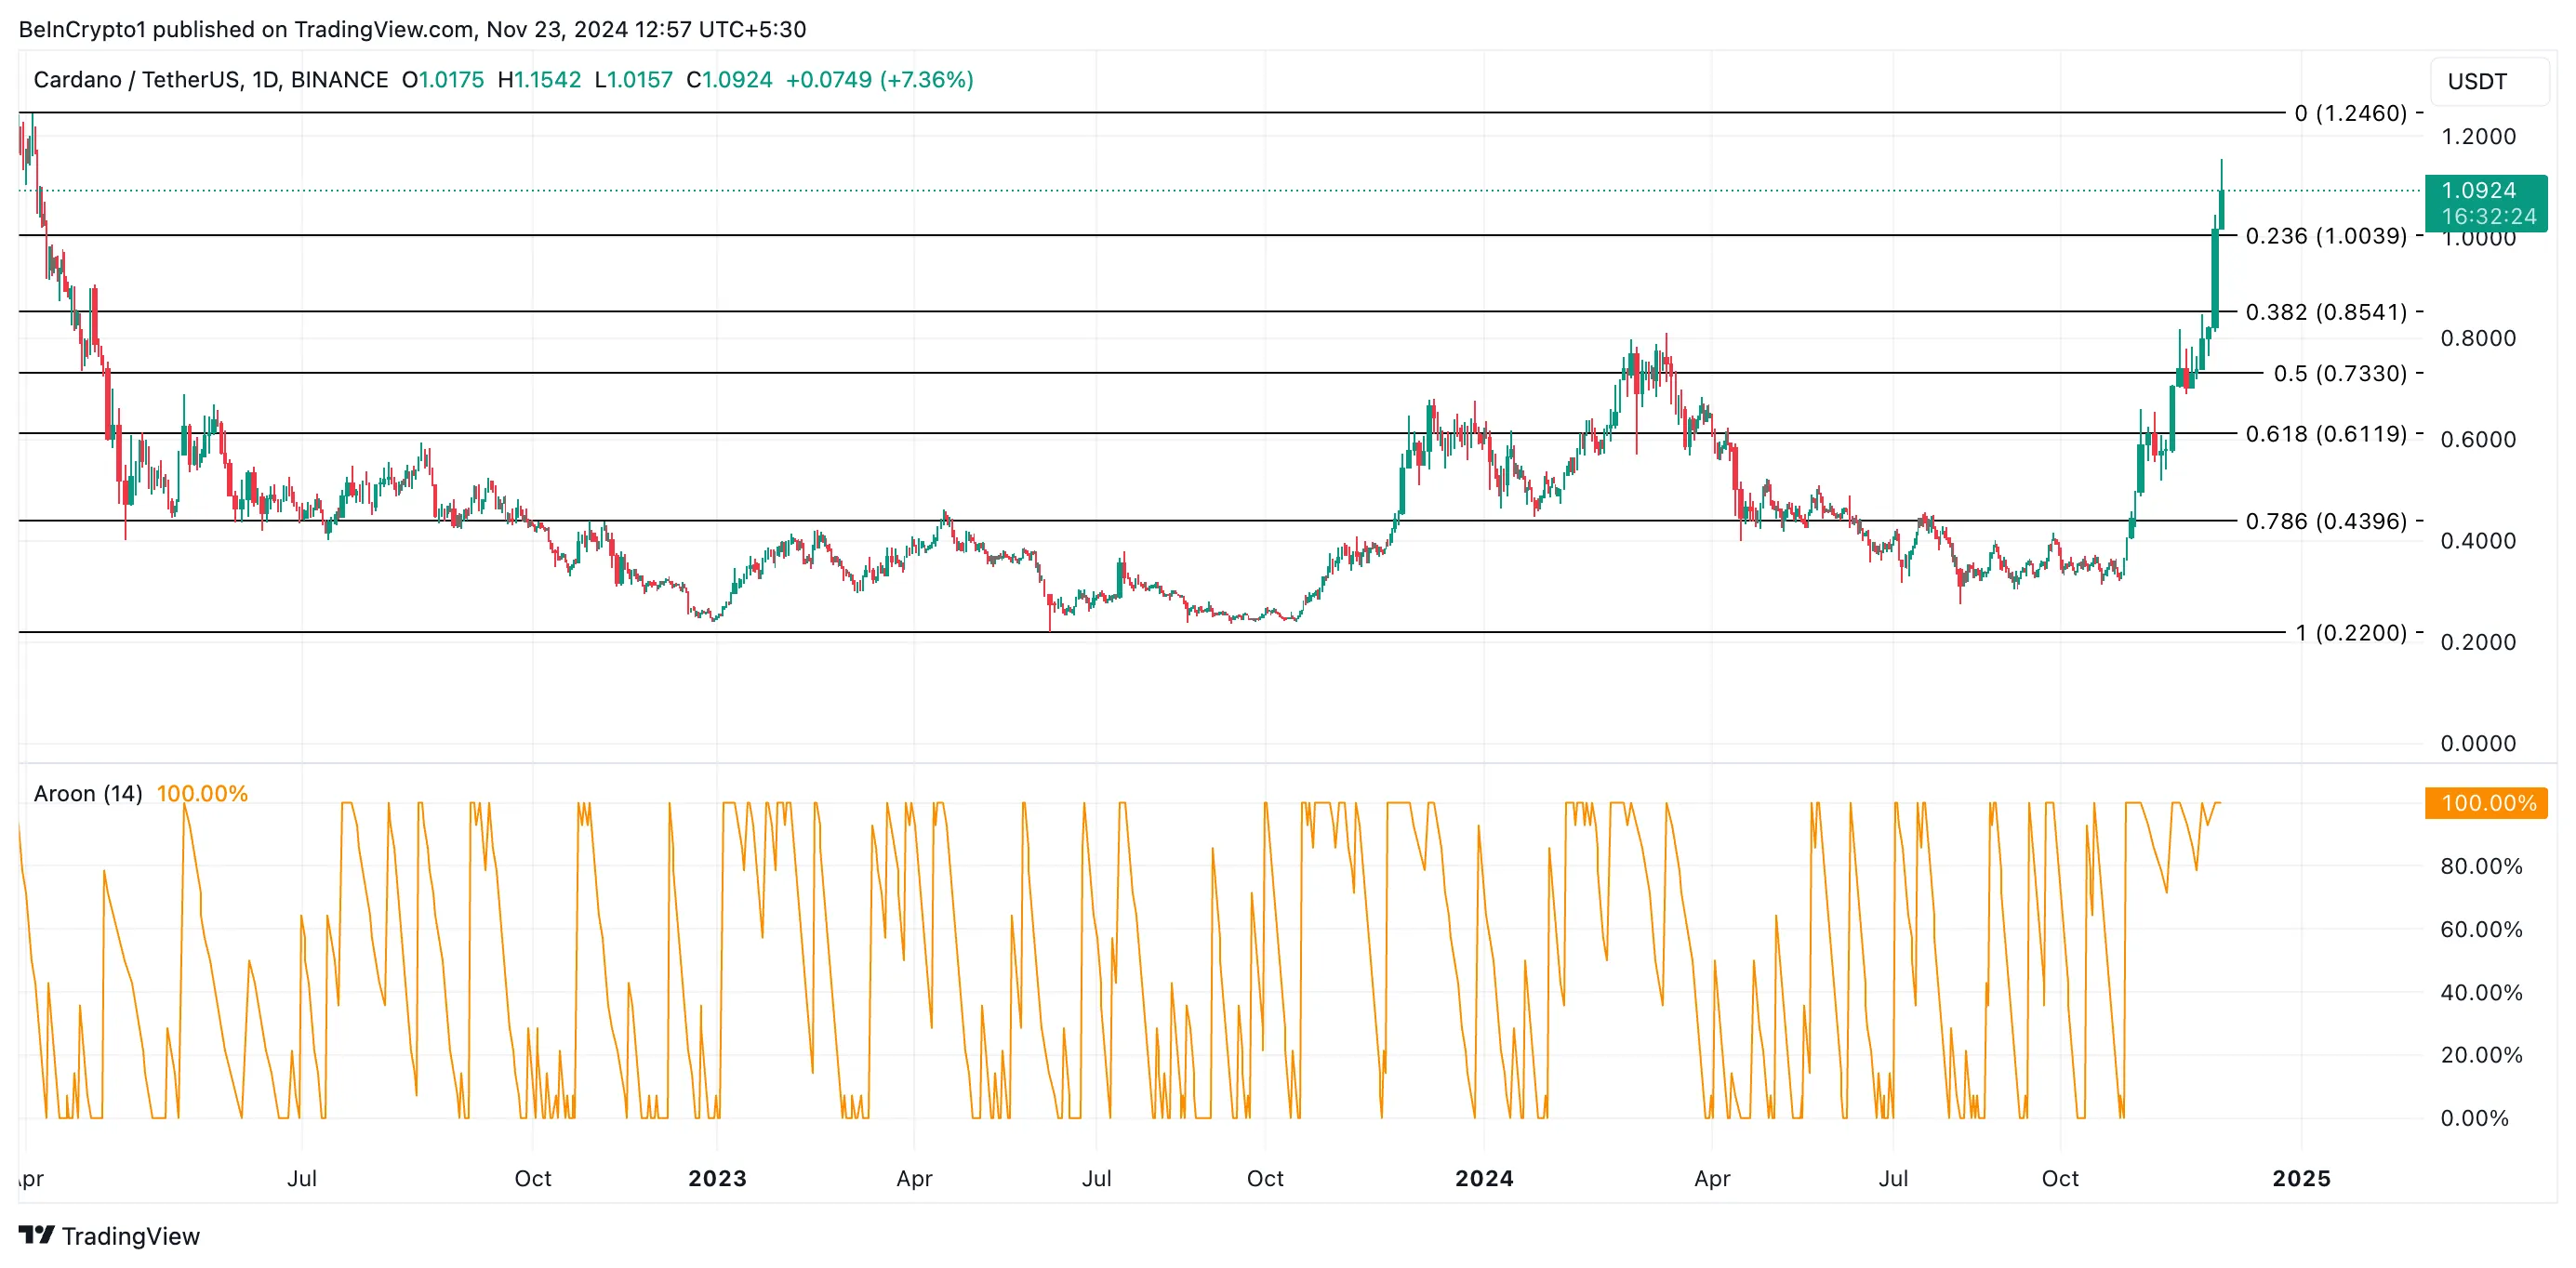
On the other hand, if profit-taking intensifies and buying pressure weakens, ADA’s price may fall to retest support at $1. Should this level fail to hold, the downtrend will be confirmed, and ADA’s price will plunge to $0.85.
Disclaimer
In line with the Trust Project guidelines, this price analysis article is for informational purposes only and should not be considered financial or investment advice. BeInCrypto is committed to accurate, unbiased reporting, but market conditions are subject to change without notice. Always conduct your own research and consult with a professional before making any financial decisions. Please note that our Terms and Conditions, Privacy Policy, and Disclaimers have been updated.
Market
XRP Battle Between Bulls And Bears Hinges On $1.97 – What To Expect

The crypto market watches with bated breath as XRP teeters at $1.97, a battleground where bullish conviction clashes with bearish determination. After a retreat from recent highs, the digital asset now faces a critical test.
The current standoff mirrors the broader tug-of-war in crypto markets, where sentiment shifts rapidly and key price levels dictate the next major move. For XRP, $1.97 isn’t just another number; it’s a line in the sand. A decisive hold here could reignite upward momentum, while a breakdown may embolden the bears.
Market Sentiment: Fear, Greed, Or Indecision?
According to Grumlin Mystery, a well-known crypto analyst, XRP is likely to experience a further downside in the near future, potentially dropping to $1.96. In his March 30th post on X, he highlighted that a decrease in liquidity within the crypto market is playing a crucial role in weakening XRP’s price stability, driven by the impact of US tariffs and the implementation of Trump’s policy changes.
Grumlin pointed out that restrictive trade policies and economic uncertainty have led to a slowdown in capital flow into riskier assets like cryptocurrencies. With reduced liquidity, market participants have less buying power, making it easier for bears to push prices lower. He warned that if these economic conditions persist, XRP could struggle to find strong support, and a drop below $1.96 could trigger further declines.
This drying up of liquidity has allowed sellers to gain the upper hand, exerting downward pressure on prices. As a result, XRP’s ability to hold support at $1.96 remains uncertain, and unless market conditions improve, a deeper correction could be on the horizon.
Grumlin Mystery further elaborated that a sharp change in Trump’s rhetoric regarding tariffs remains highly unpredictable, making it difficult to gauge its full impact on the financial markets, including cryptocurrencies. While many initially believed that Trump’s stance would be a major positive catalyst for the crypto market, the reality appears to be more complex.
The analyst emphasized that market uncertainty is increasing as traders struggle to anticipate the next move in U.S. economic policy. If Trump maintains or intensifies his tariff approach, it could further tighten liquidity conditions, making it even harder for XRP to sustain bullish momentum.
Possible Scenarios For XRP
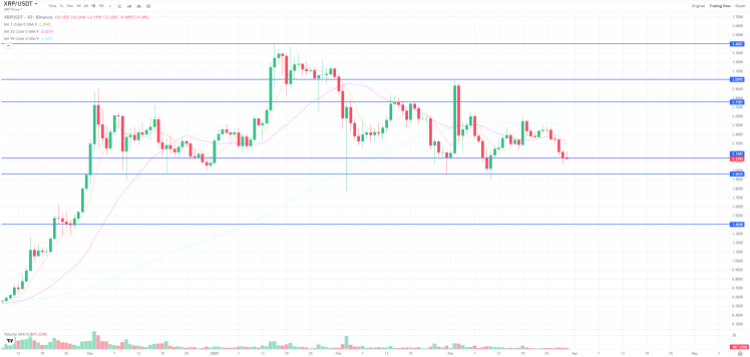
If buyers successfully defend the $1.96 level, XRP could see renewed upside momentum. A bounce from this support zone might trigger a rally toward $2.64, where the next resistance lies. A breakout above this level raises the potential to $2.92 or even $3.4, confirming a bullish recovery. Increased trading volume and improving market sentiment would be key indicators of this scenario playing out.
Sellers’ failure to maintain control and XRP’s failure to hold above $1.96 may cause a sharper decline. In this case, the next critical support levels to watch would be $1.70 and $1.34. Breaking below these levels could expose the asset to more losses to $0.93 or lower.
Market
Binance Managed 94% of All Crypto Airdrops and Staking Rewards

A new report shows that Binance almost has a monopoly in the CEX market in terms of crypto airdrop distribution and staking rewards. In 2024, the exchange received $2.6 billion of a total of $2.7 billion in rewards, amounting to 94% of the entire market segment.
In an exclusive press release shared with BeInCrypto, Binance also revealed that it’s making substantial changes to its airdrop services to improve user experience and make participation easier.
Binance Leads the Market in Crypto Airdrops
Binance, the world’s largest crypto exchange, has become the go-to platform for airdrops and staking rewards. It launched the HODLer airdrop program less than a year ago, providing many new projects with a comprehensive platform to reward early adopters.
In the past year, the exchange has become synonymous with the latest airdrops, as most users are accessing their rewards through the platform.

Based on this impressive performance in the airdrop sector, Binance has substantially upgraded a few of its services. The platform has revamped its Launchpool and BNB Earn pages, making it easier for users to both track and participate in airdrops.
“With these upgrades, we’re making it easier than ever for users to unlock the full potential of BNB and participate in high-quality token launches. The redesigned Binance Launchpool and BNB pages reflect our commitment to user education, simplicity, and maximizing rewards,” said Jeff Li, VP of Product at Binance.
The updated BNB page will give Binance users key benefits, such as real-time information on airdrops across its platforms, including Launchpool, Megadrop, and HODLer Airdrops.
Users will also see features like trading fee discounts, VIP perks, and a historical rewards section. These improvements are designed to help the firm maintain its significant dominance while continuing to focus on integrity.
Hopefully, these improvements will allow the firm to maintain its significant dominance while maintaining its usual integrity. Last month, Binance Research identified some systemic problems with airdrops in general, and the exchange seems particularly concerned with its reputation.
Disclaimer
In adherence to the Trust Project guidelines, BeInCrypto is committed to unbiased, transparent reporting. This news article aims to provide accurate, timely information. However, readers are advised to verify facts independently and consult with a professional before making any decisions based on this content. Please note that our Terms and Conditions, Privacy Policy, and Disclaimers have been updated.
Market
Pi Network Price Falls To Record New Low Amid Weak Inflows

Pi Network (PI) has experienced a significant downtrend recently, with price declines that have left many holders facing losses.
The altcoin has failed to break free from this negative momentum, and the market conditions continue to worsen. As a result, investors are losing confidence, and the price may continue to drop further.
Pi Network Continues To Suffer
The Chaikin Money Flow (CMF) continues to show bearish signs, remaining well below the zero line. This indicates that the network is suffering from outflows, meaning that investors are moving their funds out of Pi Network. Despite a bullish start, Pi failed to sustain interest, leading many holders to sell off their positions.
The outflow trend is concerning for investors, as the lack of positive momentum suggests a prolonged downtrend. The market sentiment remains bearish, with sellers outweighing buyers. As the CMF stays in the negative zone, it signals that Pi Network’s price could struggle to find stability in the short term.

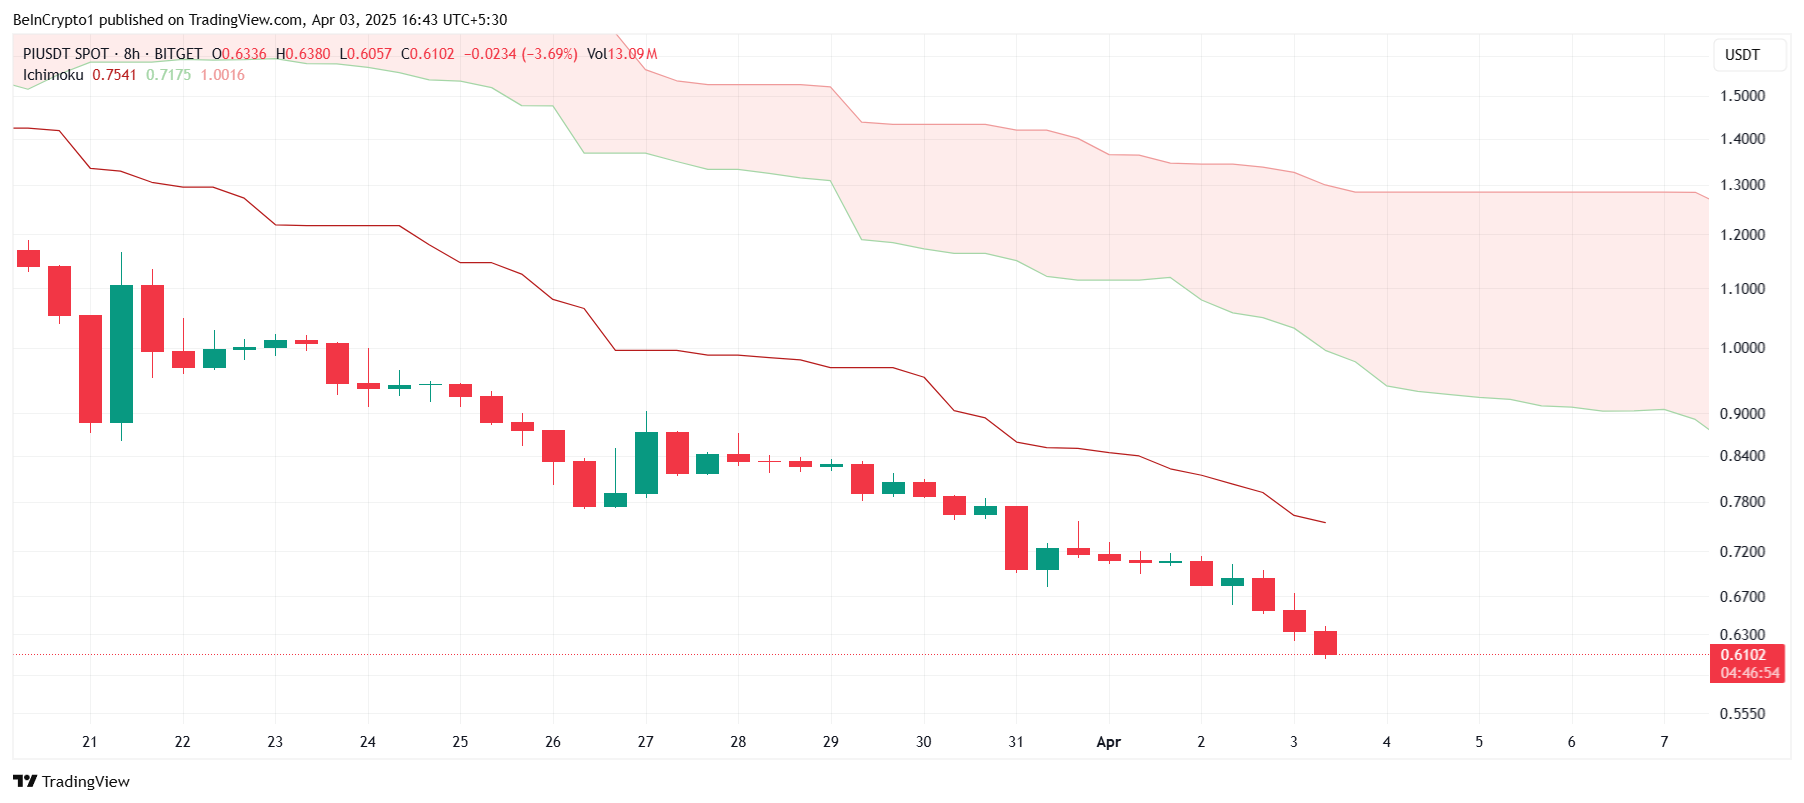
The Ichimoku Cloud, a widely used technical indicator, is hovering well above the candlesticks, signaling that the bearish trend is gaining strength. This indicates that there is little upward momentum in the market, and Pi Network is likely to face more downward pressure.
Additionally, broader market conditions are still negative, which suggests that Pi Network may fail to recover in the immediate future. With bearish technical indicators and a lack of support from investors, the outlook for Pi Network remains grim for now.
PI Price Hits A New Low
Pi Network is currently priced at $0.61, having formed a new all-time low of $0.60 after dropping by nearly 14% over the last 24 hours. The altcoin continues to struggle under the weight of negative sentiment and is not showing signs of reversal in the near term.
Based on the ongoing outflows and bearish technical indicators, Pi Network will likely continue its decline. It could fall further to $0.50, potentially forming new all-time lows. The current market conditions suggest that recovery is unlikely without a significant shift in sentiment.
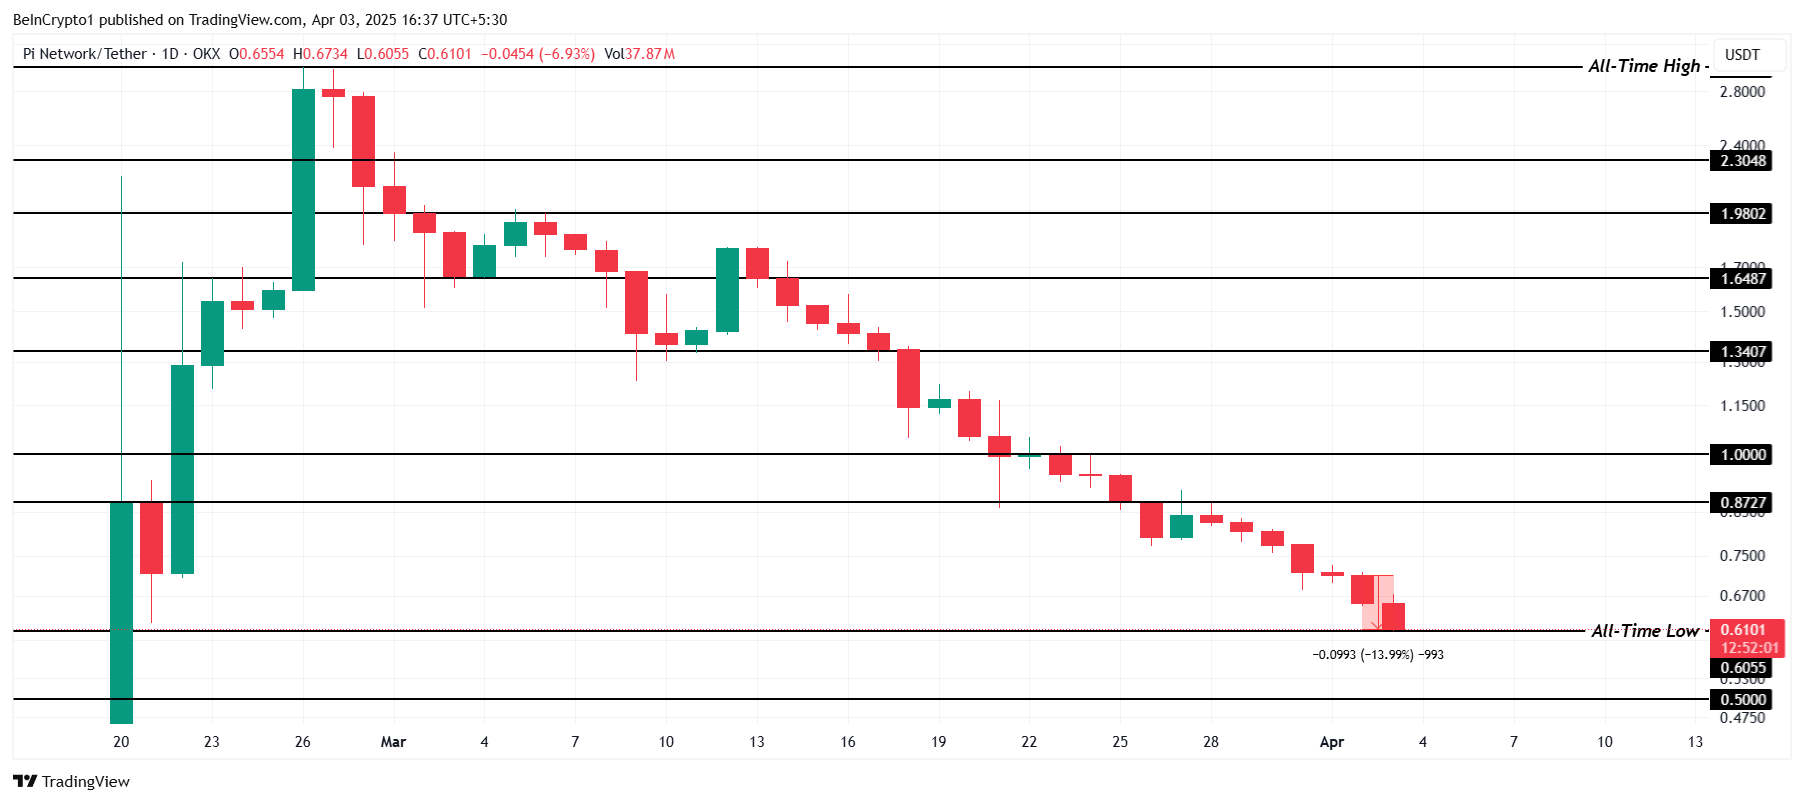
However, if Pi Network can bounce off the $0.60 level, it might regain some support and climb back to $0.87. This would help recover some of the recent losses and potentially give the altcoin another chance at a bullish move. But, without a strong catalyst, it may struggle to break through the resistance levels.
Disclaimer
In line with the Trust Project guidelines, this price analysis article is for informational purposes only and should not be considered financial or investment advice. BeInCrypto is committed to accurate, unbiased reporting, but market conditions are subject to change without notice. Always conduct your own research and consult with a professional before making any financial decisions. Please note that our Terms and Conditions, Privacy Policy, and Disclaimers have been updated.
-

 Ethereum23 hours ago
Why A Massive Drop To $1,400 Could Rock The Underperformer
-

 Altcoin21 hours ago
First Digital Trust Denies Justin Sun’s Allegations, Claims Full Solvency
-
 Altcoin22 hours ago
Will Cardano Price Bounce Back to $0.70 or Crash to $0.60?
-

 Market14 hours ago
XRP Price Under Pressure—New Lows Signal More Trouble Ahead
-

 Altcoin14 hours ago
Analyst Forecasts 250% Dogecoin Price Rally If This Level Holds
-

 Market13 hours ago
Cardano (ADA) Downtrend Deepens—Is a Rebound Possible?
-

 Market5 hours ago
Bitcoin’s Future After Trump Tariffs
-

 Altcoin17 hours ago
Binance Sidelines Pi Network Again In Vote To List Initiative, Here’s All


