
Market
Ethereum Price Readies for a Fresh Climb: Will Momentum Build?

Ethereum price started a consolidation phase near the $3,000 zone. ETH is slowly moving higher and might aim for a fresh surge above $3,220.
- Ethereum is consolidating and facing hurdles near $3,220.
- The price is trading above $3,150 and the 100-hourly Simple Moving Average.
- There was a break above a key bearish trend line with resistance at $3,130 on the hourly chart of ETH/USD (data feed via Kraken).
- The pair could start a fresh increase if it clears the $3,220 resistance zone.
Ethereum Price Faces Hurdles
Ethereum price remained supported above the $3,000 level like Bitcoin. ETH formed a base and recently moved above the $3,120 and $3,150 resistance levels.
There was a break above a key bearish trend line with resistance at $3,130 on the hourly chart of ETH/USD. The pair even cleared the $3,200 level and tested $3,220. A high was formed at $3,224 before there was a pullback. The price dipped below the 23.6% Fib retracement level of the upward move from the $3,051 swing low to the $3,224 high.
Ethereum price is now trading above $3,150 and the 100-hourly Simple Moving Average. On the upside, the price seems to be facing hurdles near the $3,200 level.

The first major resistance is near the $3,220 level. The main resistance is now forming near $3,250. A clear move above the $3,250 resistance might send the price toward the $3,320 resistance. An upside break above the $3,320 resistance might call for more gains in the coming sessions. In the stated case, Ether could rise toward the $3,450 resistance zone.
Another Drop In ETH?
If Ethereum fails to clear the $3,220 resistance, it could start another decline. Initial support on the downside is near the $3,140 level or the 50% Fib retracement level of the upward move from the $3,051 swing low to the $3,224 high. The first major support sits near the $3,050 zone.
A clear move below the $3,050 support might push the price toward $3,000. Any more losses might send the price toward the $2,940 support level in the near term. The next key support sits at $2,880.
Technical Indicators
Hourly MACD – The MACD for ETH/USD is gaining momentum in the bullish zone.
Hourly RSI – The RSI for ETH/USD is now above the 50 zone.
Major Support Level – $3,140
Major Resistance Level – $3,220


Crypto scams are surging as more people flock to digital currencies, with fraudsters exploiting the industry’s rapid growth to deceive investors.
Recently, numerous crypto users reported receiving fraudulent emails claiming that the Gemini exchange had filed for bankruptcy. Meanwhile, Coinbase Exchange has admitted that an employee illegally accessed user account information.
Gemini Exchange Addresses Bankruptcy Allegations
Multiple accounts highlighted the scam on social media, indicating that an email circulating falsely claims that Gemini has filed for bankruptcy. The email instructed users to withdraw to an Exodus wallet and provided a seed phrase.
These phishing emails, shared on April 1, urged recipients to withdraw their funds into a specified crypto wallet to protect their assets. This was an attempt to deceive users into transferring their cryptocurrencies to wallets controlled by scammers.
“Do not follow these directions. Please retweet to protect those that may have been doxxed and sent this email,” wrote Jason Williams, a contributor to Fox Business.
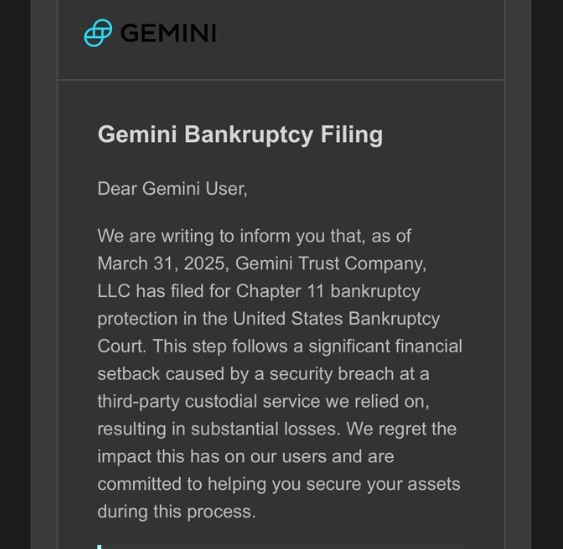
The deceptive emails alleged a substantial loss of $1.2 billion by Gemini Exchange. Understandably, some novice investors would heed this email and even move their assets to the address. After all, some victims of FTX Exchange contagion continue to pursue their funds even years after the incident.
“I got one also. It is better than your typical ‘Coin Base’ one, but still not quite there. Might fool a boomer though,” one X user remarked.
However, security experts advise users to always verify information through official channels, avoid clicking on unsolicited links, and refrain from sharing personal data. Gemini issued an official warning in response to the scam, acknowledging the threat against its users.
“We recently learned that some Gemini customers are being targeted with scam emails requesting users to transfer their crypto to outside wallets. Please be aware that Gemini will never request that you send crypto to outside wallets,” the exchange articulated.
Coinbase Admits Employee Illegally Accessed User Account Data
Coinbase exchange acknowledged a privacy violation by one of its staff in a somewhat related development. Specifically, a customer service employee accessed user account information without authorization.
This breach has raised concerns about potential scams targeting Coinbase users. Mike Dudas, a crypto investor and co-founder at The Block, shared an email from Coinbase acknowledging the incident.
“That explains the fake Coinbase phishing emails and phone calls today,” he stated.
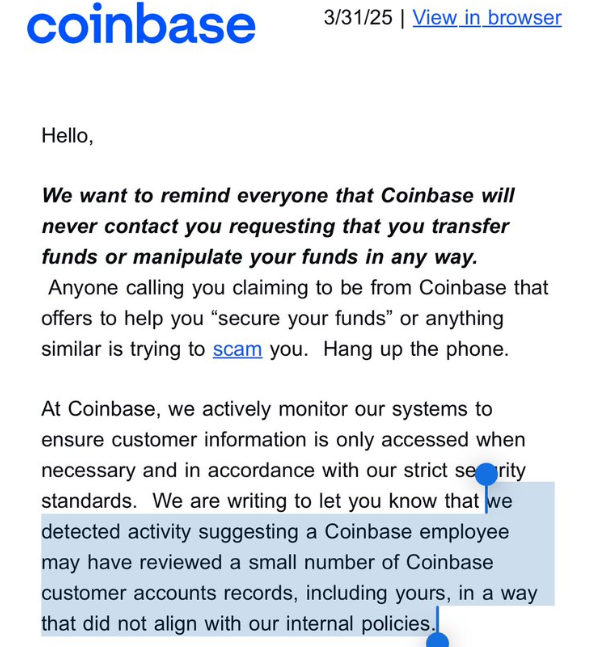
This breach coincides with reports of phishing attempts, as users have received fake emails and calls purporting to be from Coinbase. These incidents reflect a broader wave of crypto-related fraud.
Blockchain investigator ZachXBT reported that Coinbase users lost over $65 million to social engineering scams between December 2024 and January 2025.
“Coinbase did not detect it; I sent them the intel,” the blockchain investigated noted.
Additionally, crypto analyst Cobie suggested Kraken might be experiencing a similar issue. Per his post, a new attack may be budding, where attackers infiltrate customer service roles to exfiltrate data.
“Kraken also recently hit with this too. Maybe a new scheme from attackers (get a CS agent employee in, exfil data),” the analyst remarked.
Amidst these events, ZachXBT recently explained how to avoid crypto scams. He emphasizes the importance of conducting thorough research before engaging with new DeFi protocols, especially those forked from existing projects on newly launched EVM chains.
Additionally, he advises caution when dealing with projects with few credible followers, as these may indicate potential scams.
Therefore, it is imperative that users remain vigilant against sophisticated phishing scams and unauthorized data breaches.
Disclaimer
In adherence to the Trust Project guidelines, BeInCrypto is committed to unbiased, transparent reporting. This news article aims to provide accurate, timely information. However, readers are advised to verify facts independently and consult with a professional before making any decisions based on this content. Please note that our Terms and Conditions, Privacy Policy, and Disclaimers have been updated.

XRP has been on a consistent downtrend in recent days, with its price falling sharply and approaching the $2 mark. This has resulted in extended losses for the cryptocurrency, with a notable rise in selling pressure.
Despite the bearish momentum, key investors are trying to offset the negative impact.
XRP Whales Are Uncertain
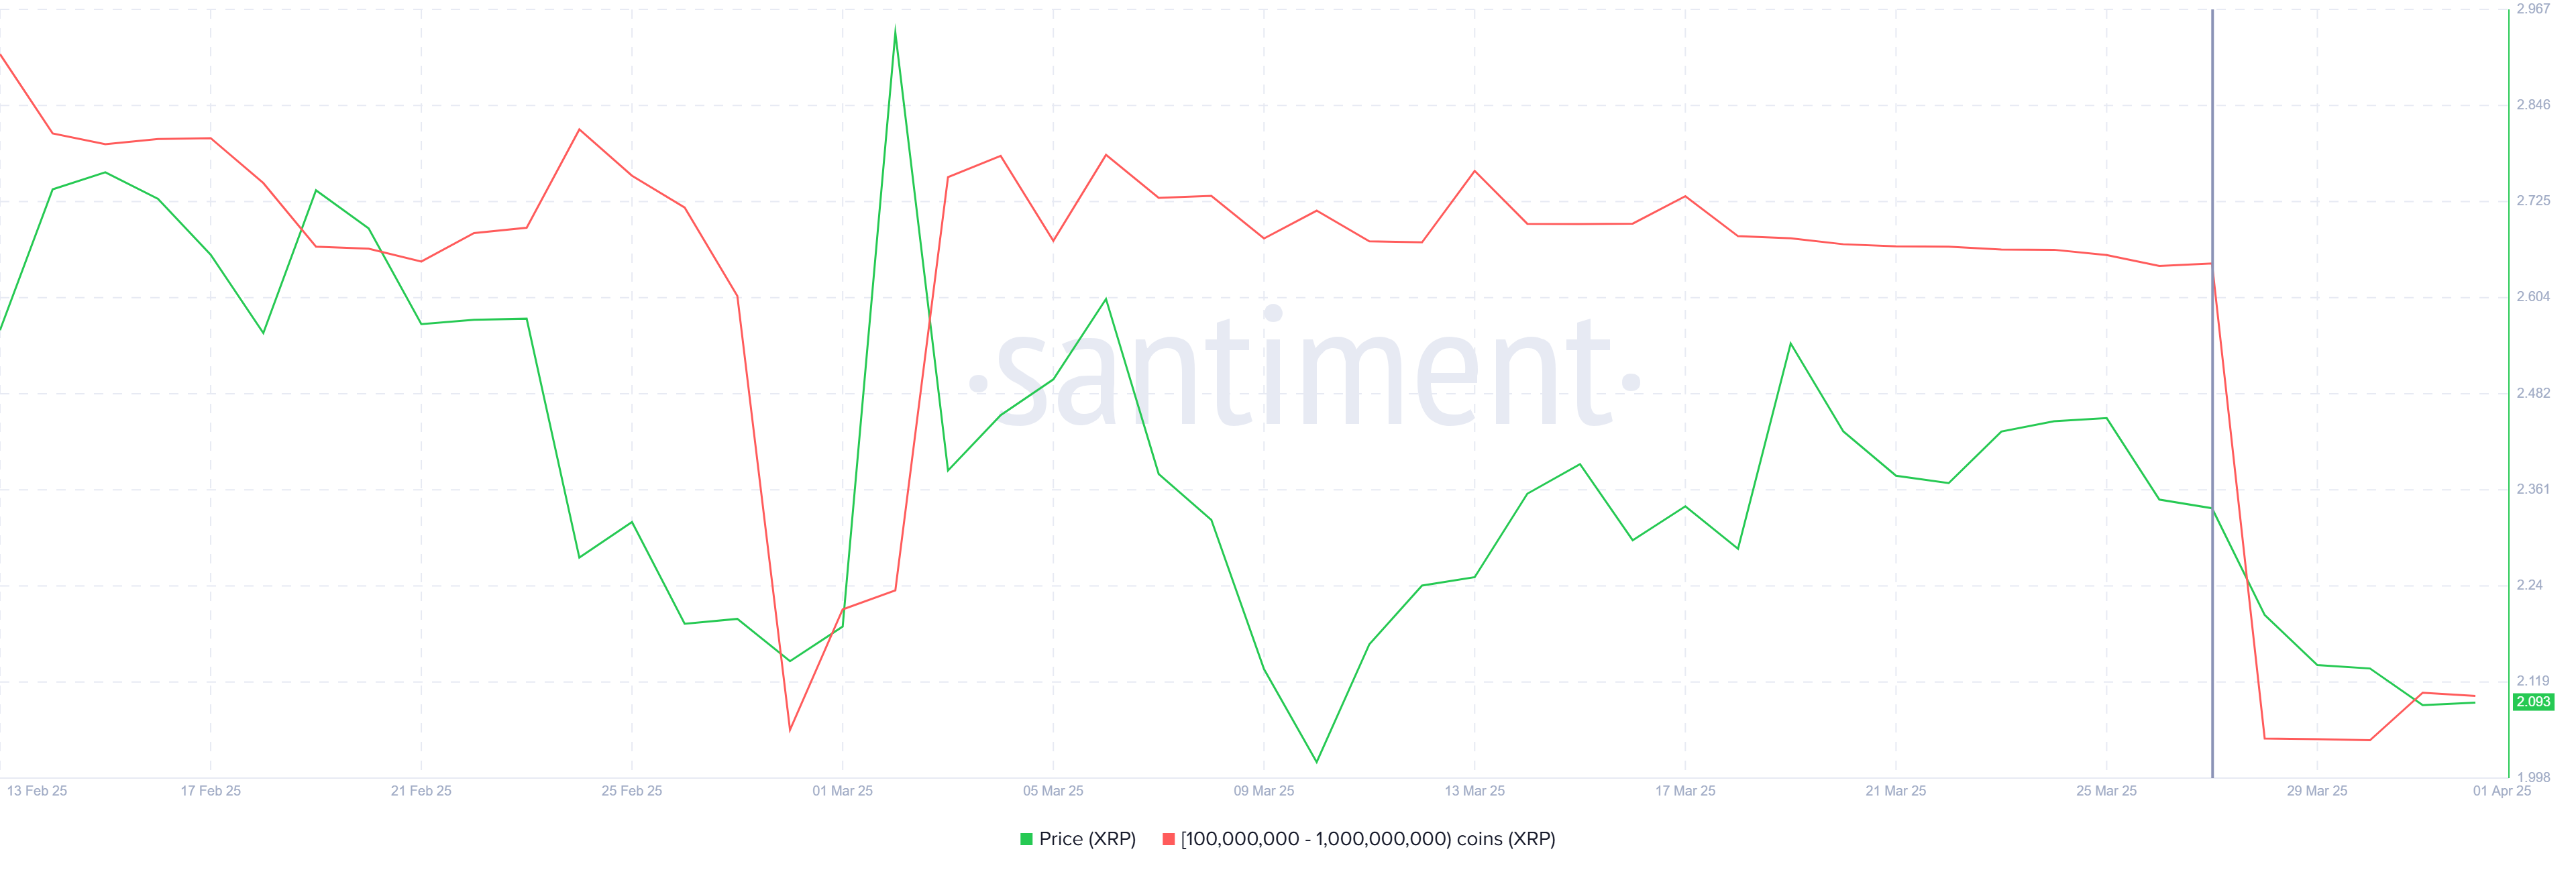
Whale activity has been a major factor contributing to the recent decline in XRP’s price. Addresses holding between 100 million and 1 billion XRP have sold over 1.12 billion XRP, worth $2.34 billion, in the past seven days. This has brought their total holdings down to 8.98 billion XRP.
The selling activity from these whale addresses reflects a cautious outlook for XRP. While whale selling often indicates uncertainty in the market, it’s important to note that their behavior can also have significant short-term price movements. The recent heavy selling could signal that market participants are unsure about the short-term price action, and further bearish trends could follow if this continues.
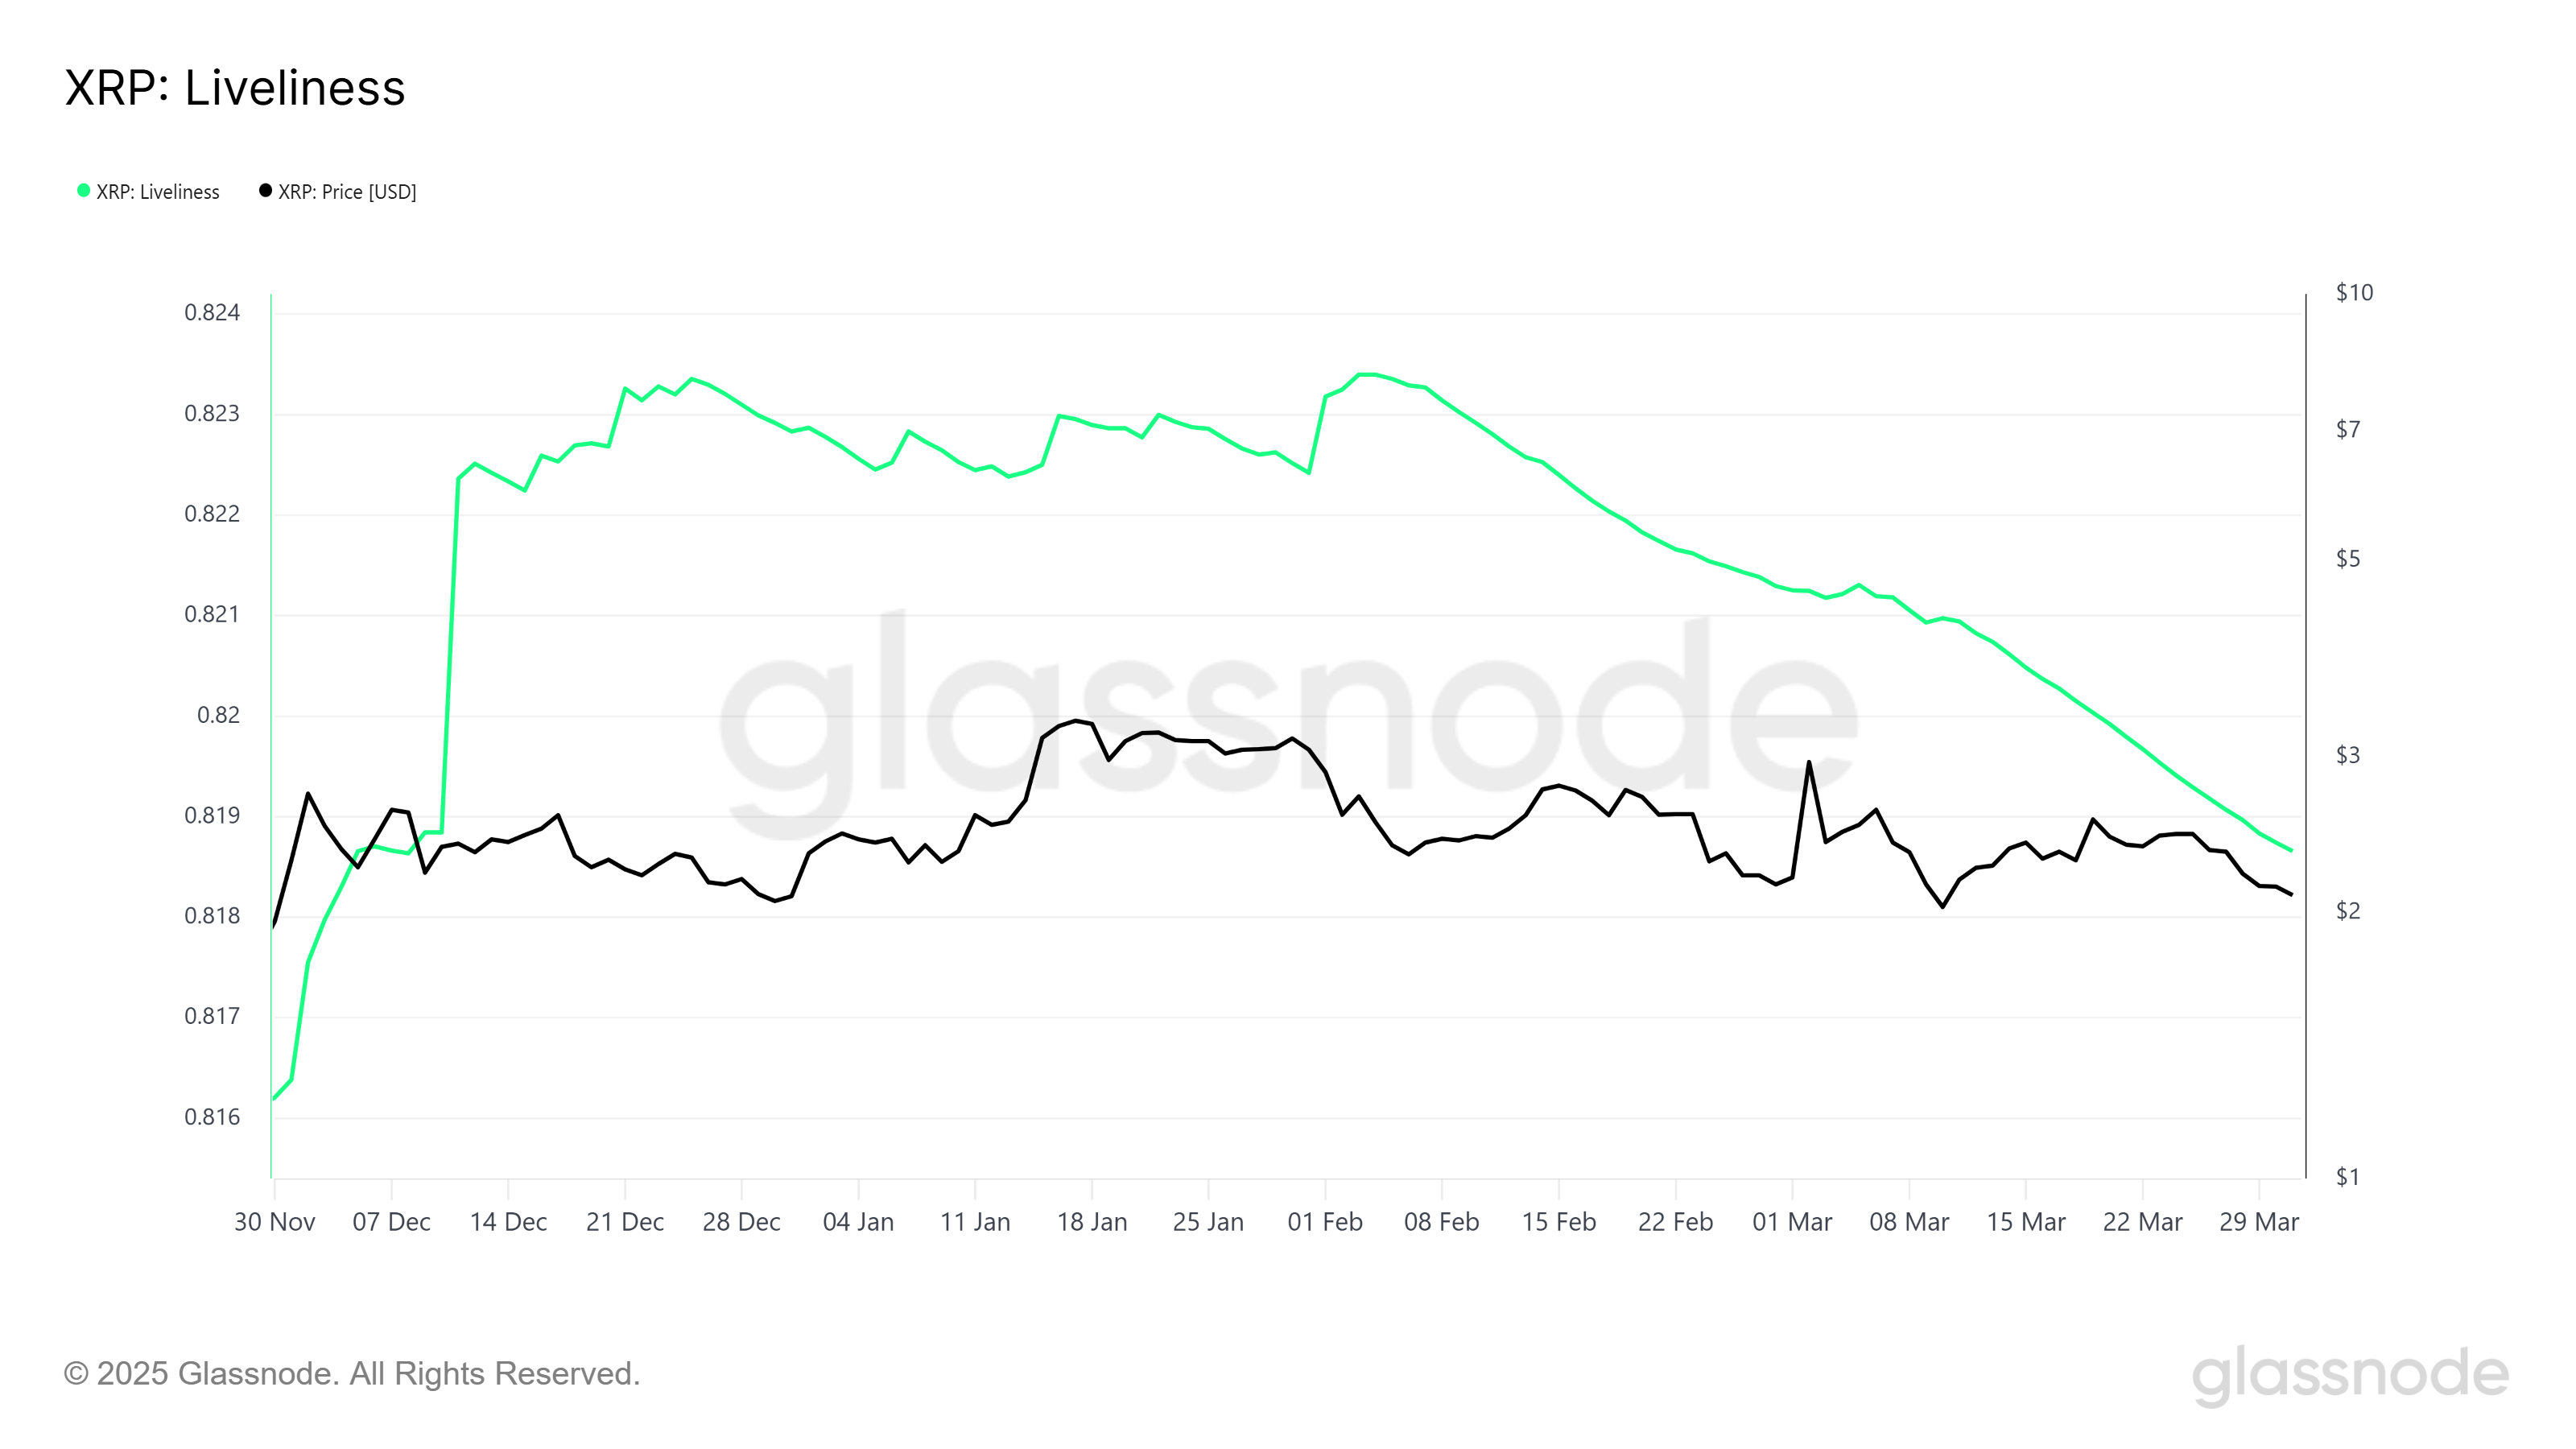
On the broader market level, XRP’s macro momentum shows signs of divergence from the whale selling. The Liveliness metric, which tracks the behavior of long-term holders (LTHs), is currently declining.
A falling Liveliness typically signals that LTHs are accumulating more of the asset at lower prices rather than selling. This drop to a three-month low suggests that long-term holders are sticking to their conviction and accumulating XRP, even as whale selling intensifies.
The steady accumulation of LTHs might help cushion the bearish effects created by the whales. This behavior can counteract the selling pressure, potentially offering stability to XRP’s price and supporting a recovery if market conditions improve.
XRP Price Needs To Find Direction
XRP’s price has fallen by 14.5% this week, bringing it to $2.09, which is dangerously close to losing the critical $2.02 support level. The ongoing bearish momentum has created mixed signals in the market, which are likely to keep the price stuck in a narrow range for the time being.
If XRP can bounce back from the $2.02 support, it could recover some of the recent losses. However, the altcoin may remain consolidated below the $2.27 resistance level unless more positive news or market conditions arise to push it higher.
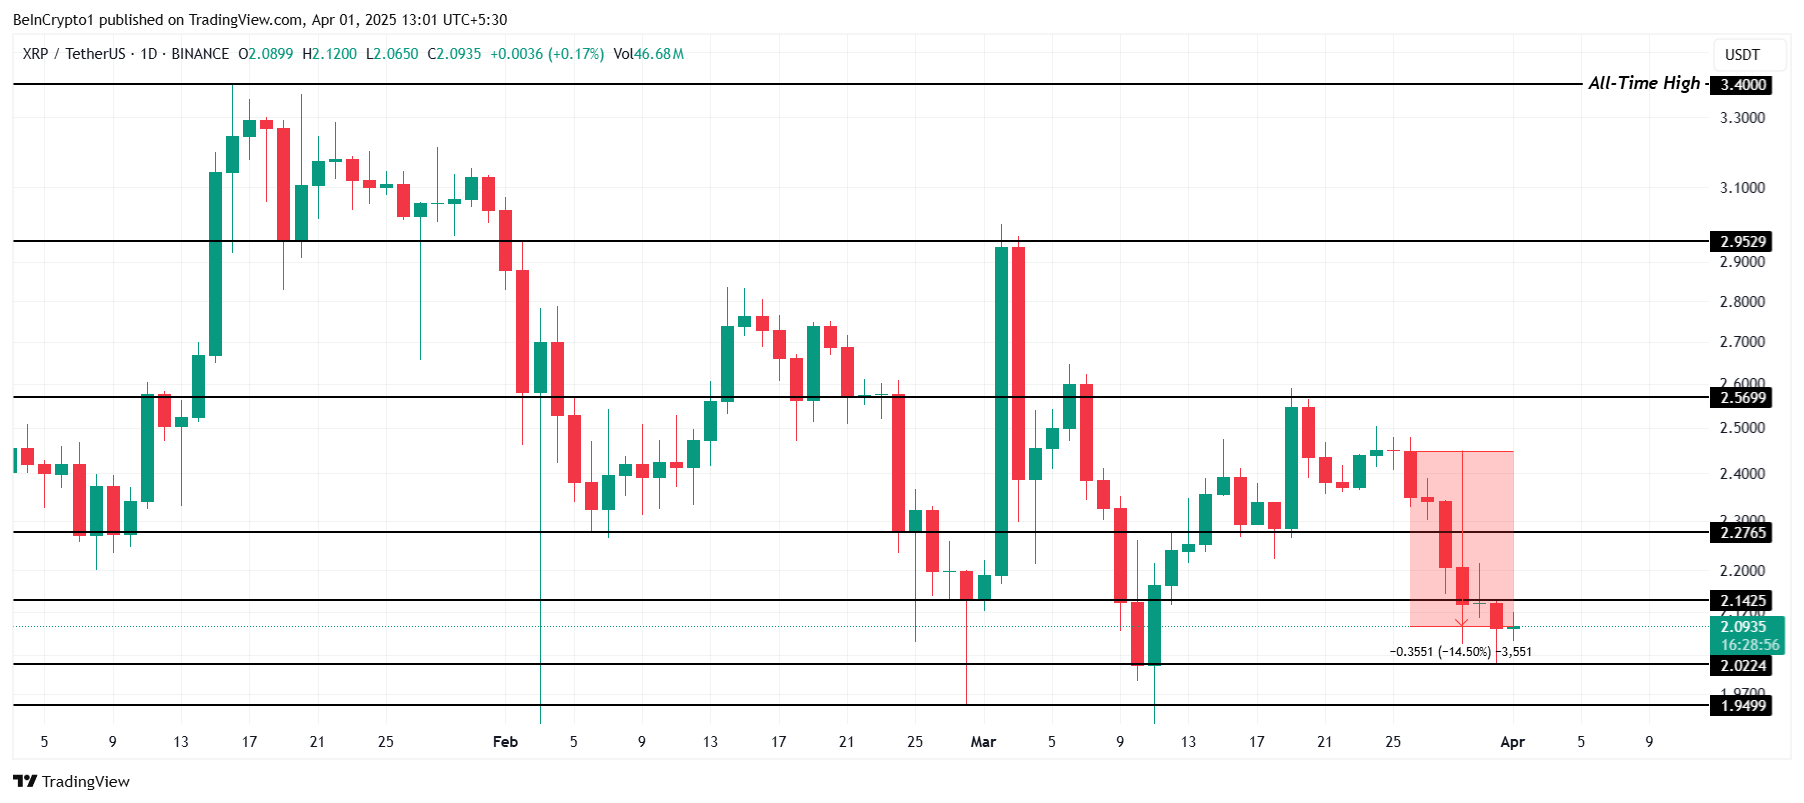
If XRP breaks through the $2.27 barrier or falls below $2.02, it could invalidate the current consolidation outlook. A successful breach of $2.27 could pave the way for a price recovery, with $2.56 being the next significant target.
Disclaimer
In line with the Trust Project guidelines, this price analysis article is for informational purposes only and should not be considered financial or investment advice. BeInCrypto is committed to accurate, unbiased reporting, but market conditions are subject to change without notice. Always conduct your own research and consult with a professional before making any financial decisions. Please note that our Terms and Conditions, Privacy Policy, and Disclaimers have been updated.

Reason to trust
![]()
Strict editorial policy that focuses on accuracy, relevance, and impartiality
Created by industry experts and meticulously reviewed
The highest standards in reporting and publishing
Strict editorial policy that focuses on accuracy, relevance, and impartiality
Morbi pretium leo et nisl aliquam mollis. Quisque arcu lorem, ultricies quis pellentesque nec, ullamcorper eu odio.
Bitcoin price started another decline below the $83,500 zone. BTC is now consolidating and might struggle to recover above the $83,850 zone.
- Bitcoin started a fresh decline below the $83,200 support zone.
- The price is trading below $83,000 and the 100 hourly Simple moving average.
- There is a connecting bullish trend line forming with support at $82,550 on the hourly chart of the BTC/USD pair (data feed from Kraken).
- The pair could start another decline if it stays below the $83,850 resistance zone.
Bitcoin Price Faces Resistance
Bitcoin price failed to start a recovery wave and remained below the $85,500 level. BTC started another decline and traded below the support area at $83,500. The bears gained strength for a move below the $82,500 support zone.
The price even declined below the $82,000 level. A low was formed at $81,320 before there was a recovery wave. There was a move above the $82,500 level, but the bears were active near $83,850. The price is now consolidating and there was a drop below the 50% Fib retracement level of the upward move from the $81,320 swing low to the $83,870 high.
Bitcoin price is now trading below $83,250 and the 100 hourly Simple moving average. There is also a connecting bullish trend line forming with support at $82,550 on the hourly chart of the BTC/USD pair. On the upside, immediate resistance is near the $83,250 level. The first key resistance is near the $83,850 level.

The next key resistance could be $84,200. A close above the $84,200 resistance might send the price further higher. In the stated case, the price could rise and test the $84,800 resistance level. Any more gains might send the price toward the $85,000 level or even $85,500.
Another Decline In BTC?
If Bitcoin fails to rise above the $83,850 resistance zone, it could start a fresh decline. Immediate support on the downside is near the $82,550 level. The first major support is near the $82,250 level and the 61.8% Fib retracement level of the upward move from the $81,320 swing low to the $83,870 high.
The next support is now near the $81,250 zone. Any more losses might send the price toward the $80,000 support in the near term. The main support sits at $78,500.
Technical indicators:
Hourly MACD – The MACD is now losing pace in the bearish zone.
Hourly RSI (Relative Strength Index) – The RSI for BTC/USD is now below the 50 level.
Major Support Levels – $82,250, followed by $81,250.
Major Resistance Levels – $83,250 and $83,850.

Fake Gemini Bankruptcy Emails Target Users

Big Bitcoin Buy Coming? Saylor Drops a Hint as Strategy Shifts

XRP Price Struggles as Whale Selling Rises To $2.3 Billion

Bitcoin Price Battles Key Hurdles—Is a Breakout Still Possible?
Is CZ’s April Fool’s Joke a Crypto Reality or Just Fun?

XRP Bulls Fight Back—Is a Major Move Coming?

2.52 Million Altcoins Are Ruining Crypto’s Future

Animoca Brands Valuation Tanks 75% In Two Years, Here’s Why

Crypto exchange BingX hacked for $43 million

Are The Big Players Losing Interest?

Hong Kong’s Securities Association Tips Authorities On Crypto Self-Regulation

Coinbase cbBTC Set to go Live on Solana
2.52 Million Altcoins Are Ruining Crypto’s Future
Animoca Brands Valuation Tanks 75% In Two Years, Here’s Why
Crypto exchange BingX hacked for $43 million
Are The Big Players Losing Interest?
Hong Kong’s Securities Association Tips Authorities On Crypto Self-Regulation
Coinbase cbBTC Set to go Live on Solana
-

 Ethereum17 hours ago
Ethereum’s Price Dips, But Investors Seize The Opportunity To Stack Up More ETH
-

 Market23 hours ago
Top Crypto Airdrops to Watch in the First Week of April
-
 Market18 hours ago
Trump Family Gets Most WLFI Revenue, Causing Corruption Fears
-

 Market22 hours ago
3 Altcoins to Watch in the First Week of April 2025
-

 Market21 hours ago
Bitcoin Mining Faces Tariff Challenges as Hashrate Hits New ATH
-
 Regulation21 hours ago
USDC Issuer Circle Set To File IPO In April, Here’s All
-

 Market20 hours ago
Pi Network Struggles, On Track for New All-Time Low
-
 Bitcoin19 hours ago
Strategy Adds 22,048 BTC for Nearly $2 Billion