Market
Bitcoin Faces Reversal Fears at $90,000 Amid Extreme Greed

Bitcoin’s price rally appears to have stalled after a week of all-time highs (ATHs), with the cryptocurrency now facing significant challenges.
The bullish momentum that propelled BTC to $93,242 has slowed, raising concerns about potential corrections as market conditions begin to shift.
Bitcoin Faces Potential Reversal
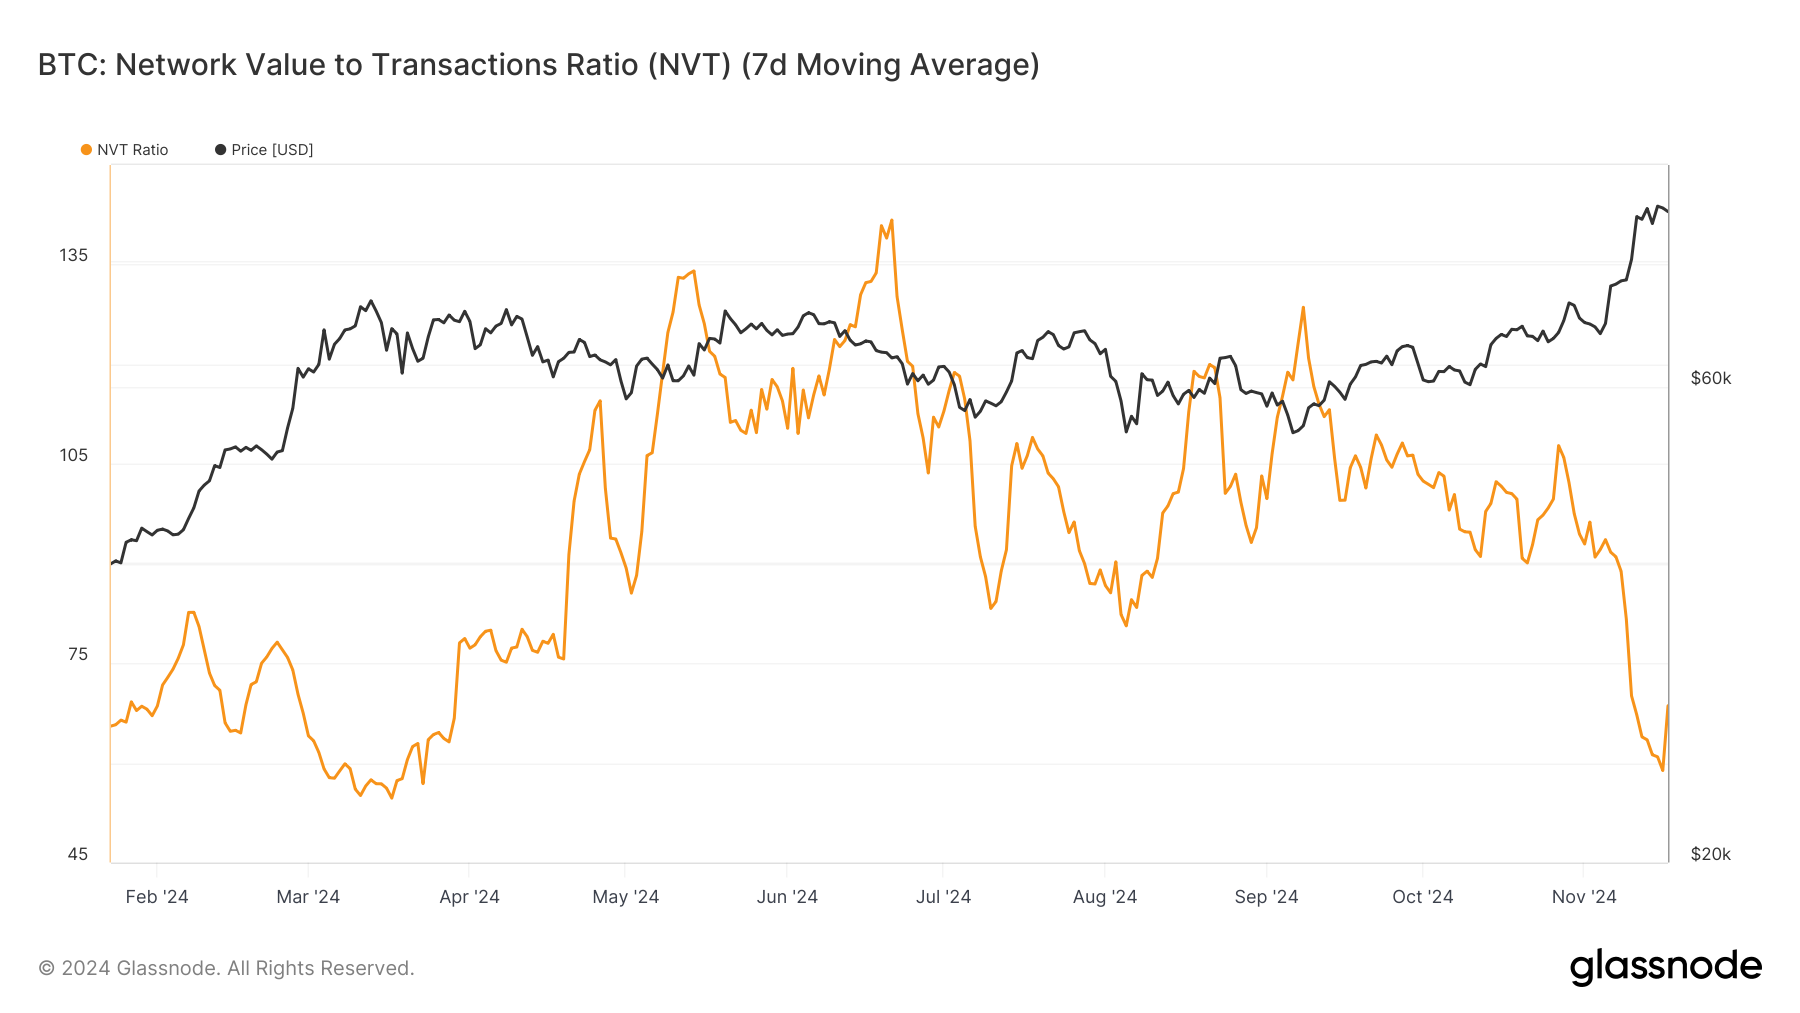
The NVT (Network Value to Transactions) Ratio, a critical metric for analyzing Bitcoin’s value, has spiked after recently hitting an eight-month low. A low NVT ratio typically indicates that the network’s transactional activity is aligned with its value, signaling a balanced and sustainable market.
However, the current uptick suggests that Bitcoin’s network value may be outpacing its transaction activity. Historically, such scenarios have preceded corrections, highlighting the importance of closely monitoring this metric. If the trend persists, it could contribute to downward pressure on BTC’s price.
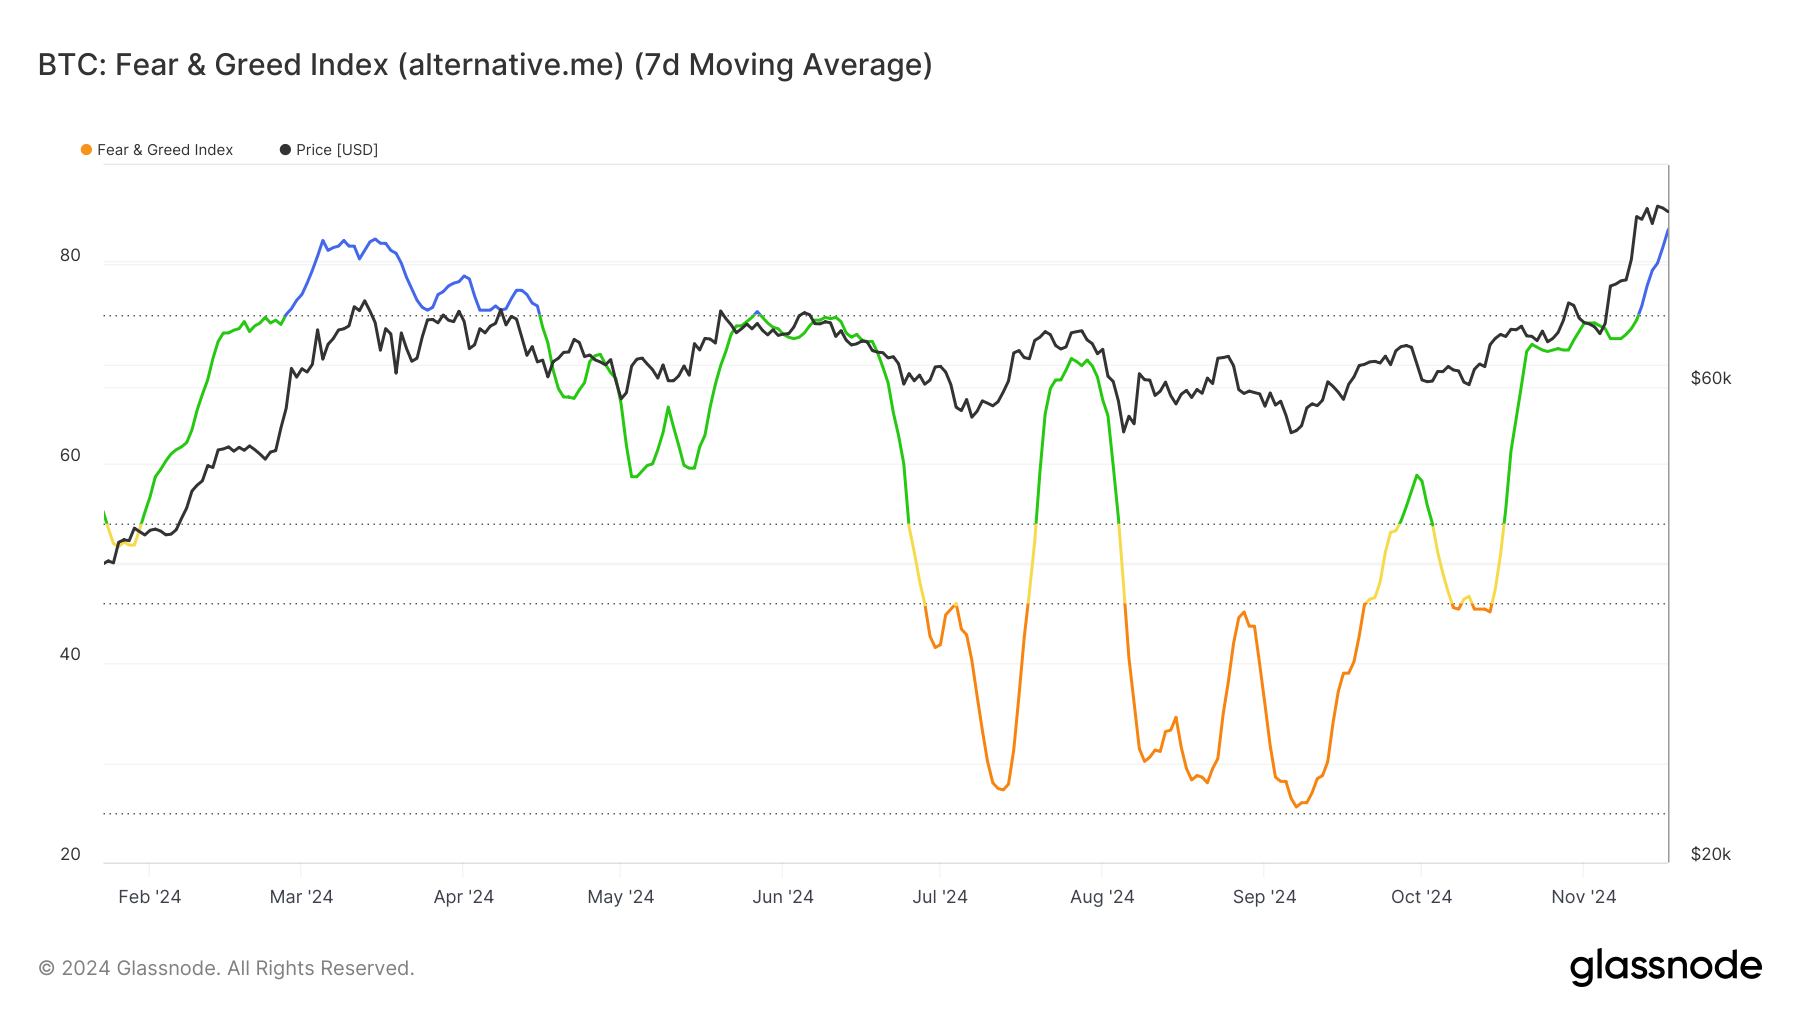
The Fear and Greed Index, a barometer for market sentiment, is now in the “extreme greed” zone, which has historically signaled potential reversals in Bitcoin’s price. Extreme greed often indicates that investors are overly optimistic, leaving the market vulnerable to sudden sell-offs.
While Bitcoin has demonstrated resilience during similar conditions in the past, this heightened sentiment could mark a tipping point. Combined with declining transaction activity, BTC’s macro momentum may face increasing challenges in sustaining its current price levels.
BTC Price Prediction: Finding Support
Bitcoin is currently trading at $90,673, holding above the critical support of $88,691 while facing resistance at $92,000. If BTC consolidates within this range over the next few days, it could fend off a broader correction and maintain stability.
However, a break below the $88,691 support could trigger a decline toward $85,000. If this level fails to hold, Bitcoin risks falling further to $80,301, exacerbating bearish sentiment.
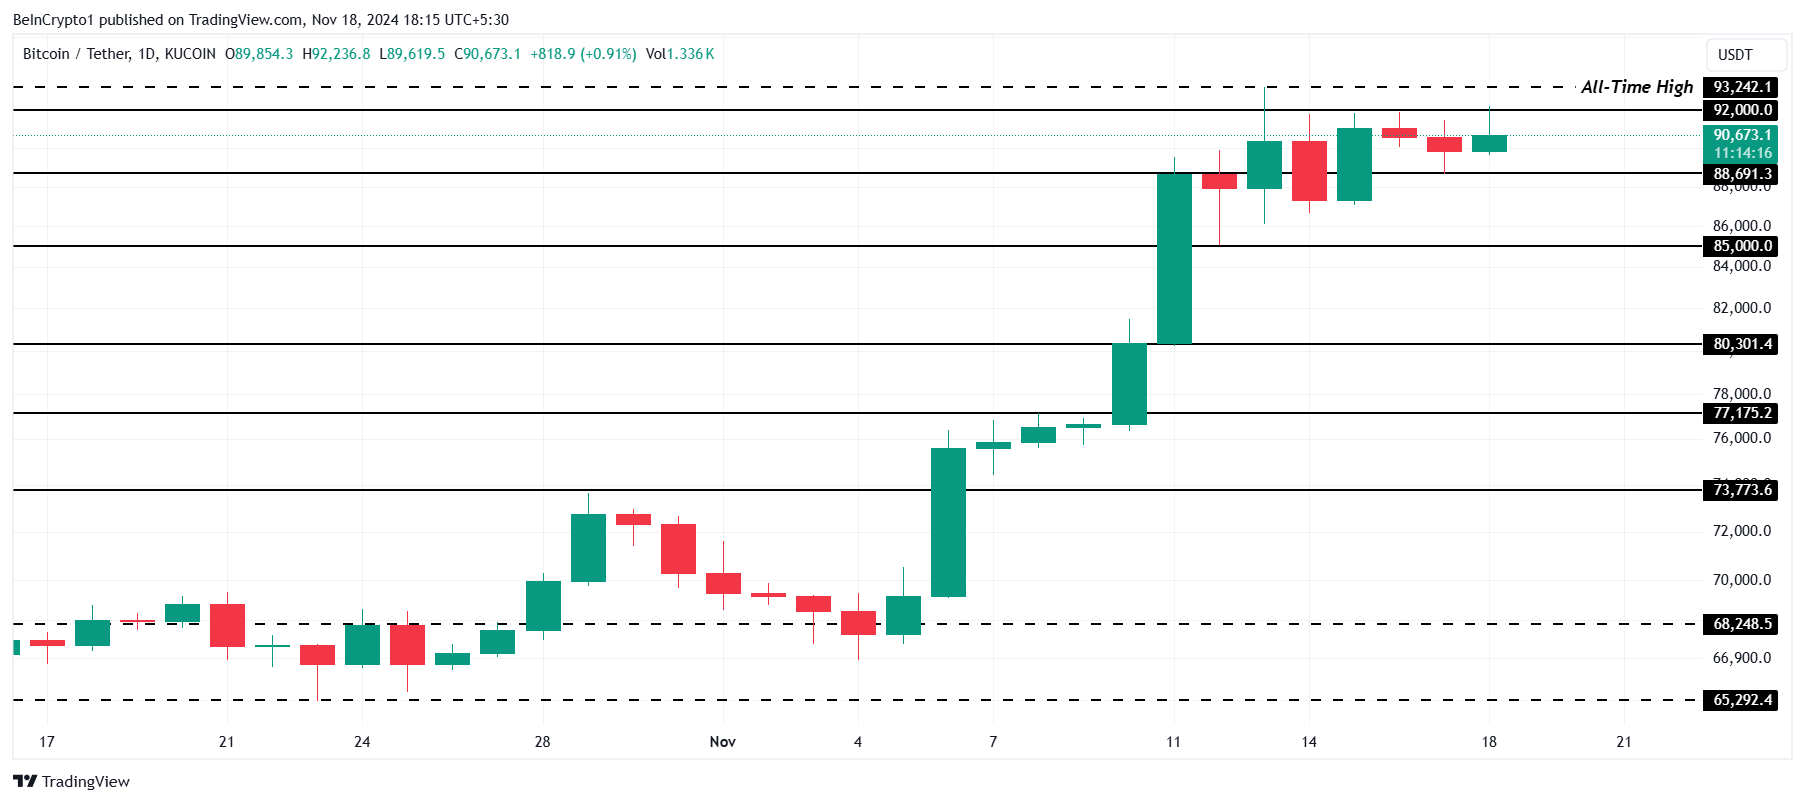
Conversely, a bounce off $88,691 and a successful breach of the $92,000 resistance could revive bullish momentum. This would allow Bitcoin to aim for a new ATH above $93,242, effectively invalidating concerns of a reversal and reinforcing its long-term upward trajectory.
Disclaimer
In line with the Trust Project guidelines, this price analysis article is for informational purposes only and should not be considered financial or investment advice. BeInCrypto is committed to accurate, unbiased reporting, but market conditions are subject to change without notice. Always conduct your own research and consult with a professional before making any financial decisions. Please note that our Terms and Conditions, Privacy Policy, and Disclaimers have been updated.
Market
Solana Altcoin Saros Rallies 1000% Since March, Hits New High

Saros, the Solana-based altcoin, has been on an impressive uptrend over the past month. The token’s price has formed new all-time highs (ATHs) nearly every day throughout March.
However, with the momentum showing signs of slowing, investors are wondering if this rally is nearing its end.
SAROS Refrains From Following Bitcoin
The correlation between Saros and Bitcoin (BTC) is currently negative, sitting at -0.43. This negative correlation has worked in Saros’ favor, as it allowed the altcoin to perform well during Bitcoin’s struggles throughout March. While Bitcoin faced significant declines, Saros was able to rally largely due to this inverse relationship.
The shifting dynamics between Bitcoin and Saros will be key to the future price movement of the altcoin. Should Bitcoin regain its upward momentum, Saros may face increased selling pressure. This is because the negative correlation that has benefited Saros may reverse, impacting the altcoin’s ability to maintain its upward trajectory.

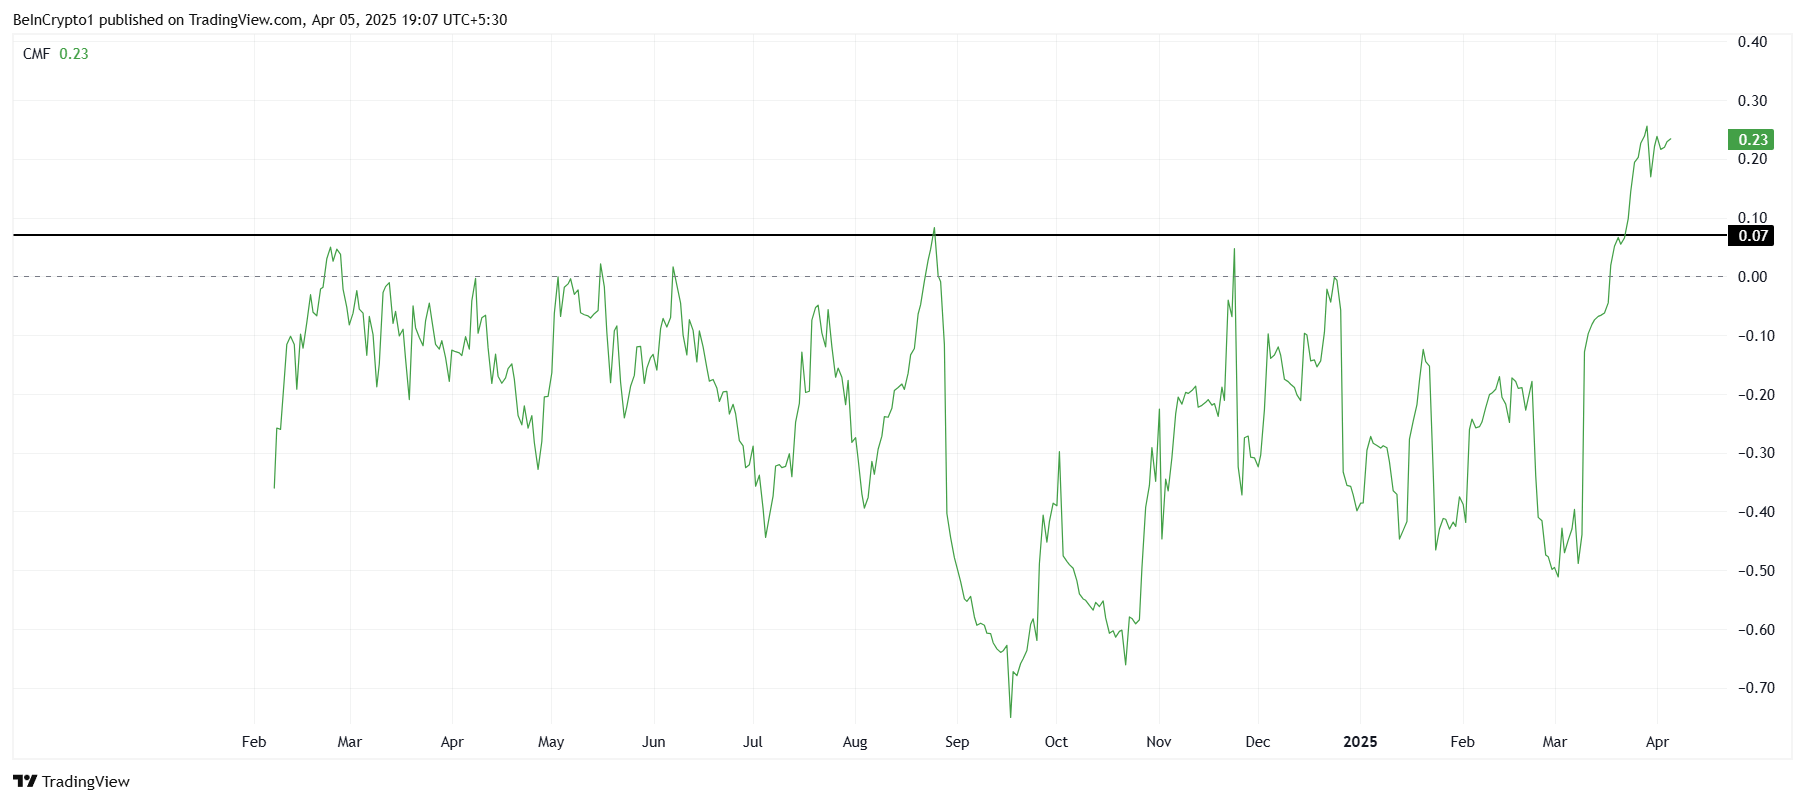
The overall macro momentum of Saros shows that investor interest has remained strong. The Chaikin Money Flow (CMF) indicator has been increasing steadily over the past month, signaling consistent inflows.
Recently, it crossed the saturation threshold of 0.7, a level that has historically led to price corrections. This suggests that while Saros has experienced significant gains, the market may be nearing an overbought condition. If profit-taking begins, a price pullback is highly probable for the altcoin.
SAROS Price Rise Continues
Saros has surged by an astounding 1,024% since the beginning of March, trading at $0.153 as of now. Throughout March, the altcoin has formed new ATHs almost daily, reflecting strong investor sentiment and demand.
The current ATH stands at $0.163, and the momentum could continue pushing the price upwards, potentially reaching $0.200 if the uptrend remains intact. However, as the price continues to rise, the risk of profit-taking increases.
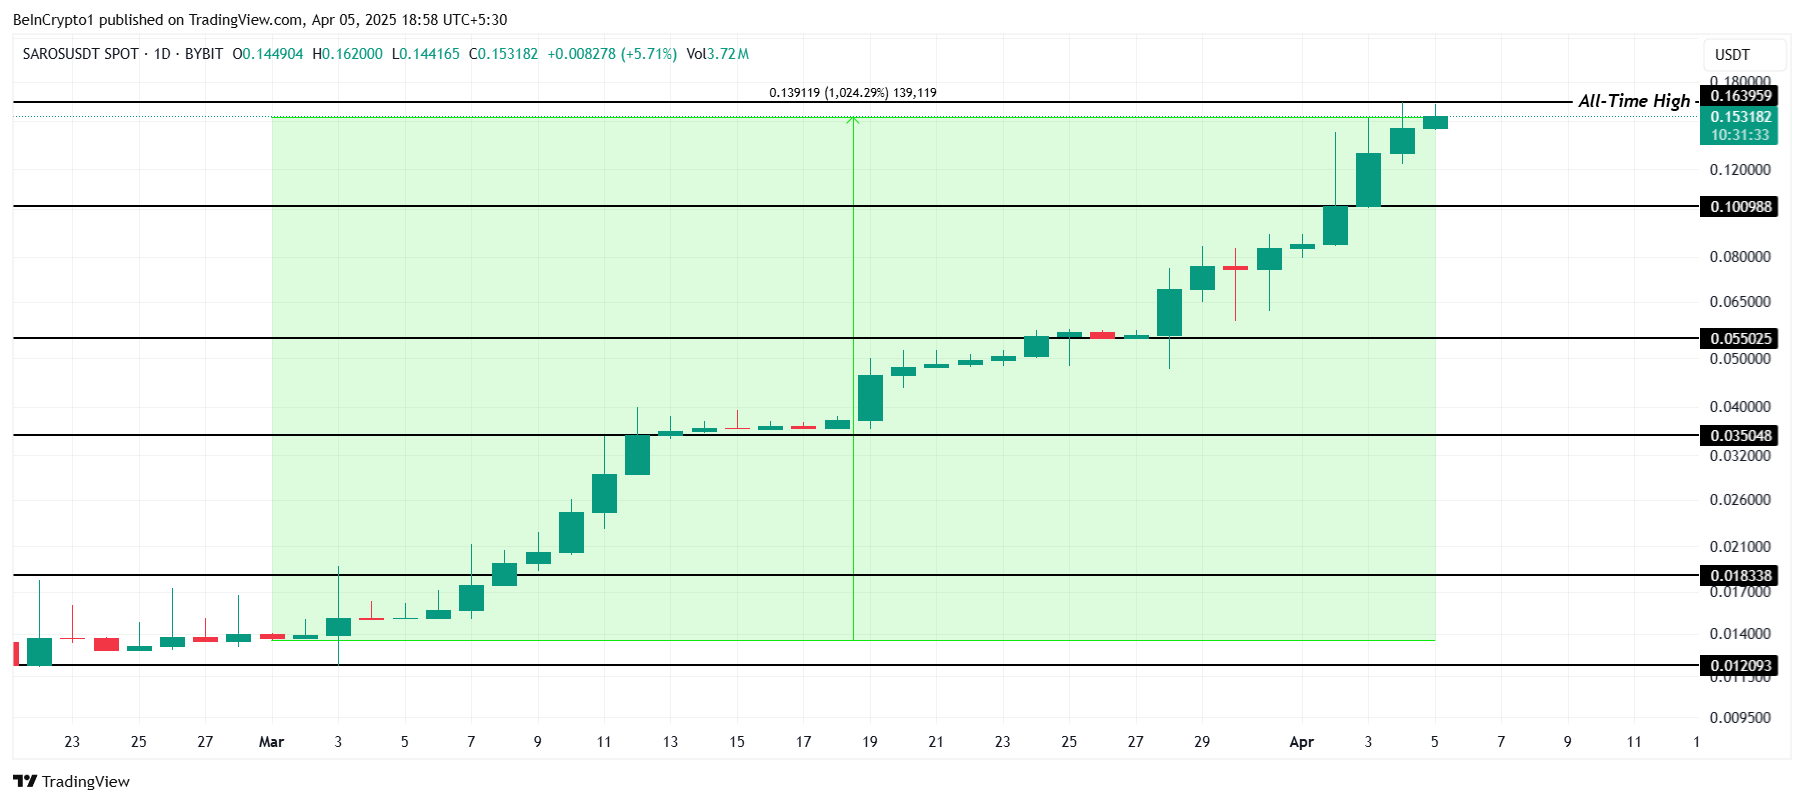
If Saros faces such a pullback, it could fall back towards the $0.100 support level. If the altcoin loses this key support, the price could drop further to $0.055, invalidating the bullish outlook. Investors should keep an eye on these levels as they will help determine whether the current rally is sustainable.
Disclaimer
In line with the Trust Project guidelines, this price analysis article is for informational purposes only and should not be considered financial or investment advice. BeInCrypto is committed to accurate, unbiased reporting, but market conditions are subject to change without notice. Always conduct your own research and consult with a professional before making any financial decisions. Please note that our Terms and Conditions, Privacy Policy, and Disclaimers have been updated.
Market
Key Levels To Watch For Potential Breakout

Semilore Faleti is a cryptocurrency writer specialized in the field of journalism and content creation. While he started out writing on several subjects, Semilore soon found a knack for cracking down on the complexities and intricacies in the intriguing world of blockchains and cryptocurrency.
Semilore is drawn to the efficiency of digital assets in terms of storing, and transferring value. He is a staunch advocate for the adoption of cryptocurrency as he believes it can improve the digitalization and transparency of the existing financial systems.
In two years of active crypto writing, Semilore has covered multiple aspects of the digital asset space including blockchains, decentralized finance (DeFi), staking, non-fungible tokens (NFT), regulations and network upgrades among others.
In his early years, Semilore honed his skills as a content writer, curating educational articles that catered to a wide audience. His pieces were particularly valuable for individuals new to the crypto space, offering insightful explanations that demystified the world of digital currencies.
Semilore also curated pieces for veteran crypto users ensuring they were up to date with the latest blockchains, decentralized applications and network updates. This foundation in educational writing has continued to inform his work, ensuring that his current work remains accessible, accurate and informative.
Currently at NewsBTC, Semilore is dedicated to reporting the latest news on cryptocurrency price action, on-chain developments and whale activity. He also covers the latest token analysis and price predictions by top market experts thus providing readers with potentially insightful and actionable information.
Through his meticulous research and engaging writing style, Semilore strives to establish himself as a trusted source in the crypto journalism field to inform and educate his audience on the latest trends and developments in the rapidly evolving world of digital assets.
Outside his work, Semilore possesses other passions like all individuals. He is a big music fan with an interest in almost every genre. He can be described as a “music nomad” always ready to listen to new artists and explore new trends.
Semilore Faleti is also a strong advocate for social justice, preaching fairness, inclusivity, and equity. He actively promotes the engagement of issues centred around systemic inequalities and all forms of discrimination.
He also promotes political participation by all persons at all levels. He believes active contribution to governmental systems and policies is the fastest and most effective way to bring about permanent positive change in any society.
In conclusion, Semilore Faleti exemplifies the convergence of expertise, passion, and advocacy in the world of crypto journalism. He is a rare individual whose work in documenting the evolution of cryptocurrency will remain relevant for years to come.
His dedication to demystifying digital assets and advocating for their adoption, combined with his commitment to social justice and political engagement, positions him as a dynamic and influential voice in the industry.
Whether through his meticulous reporting at NewsBTC or his fervent promotion of fairness and equity, Semilore continues to inform, educate, and inspire his audience, striving for a more transparent and inclusive financial future.
Market
IMX Price Nears All-Time Low After 30 Million Token Sell-Off

Immutable’s (IMX) price has been on a significant downtrend recently, falling to multi-year lows. The token has suffered a sharp decline, and its price is currently hovering around $0.433.
If the current trend continues, there is a possibility that IMX could form a new all-time low (ATL).
Immutable Investors Are Giving Up
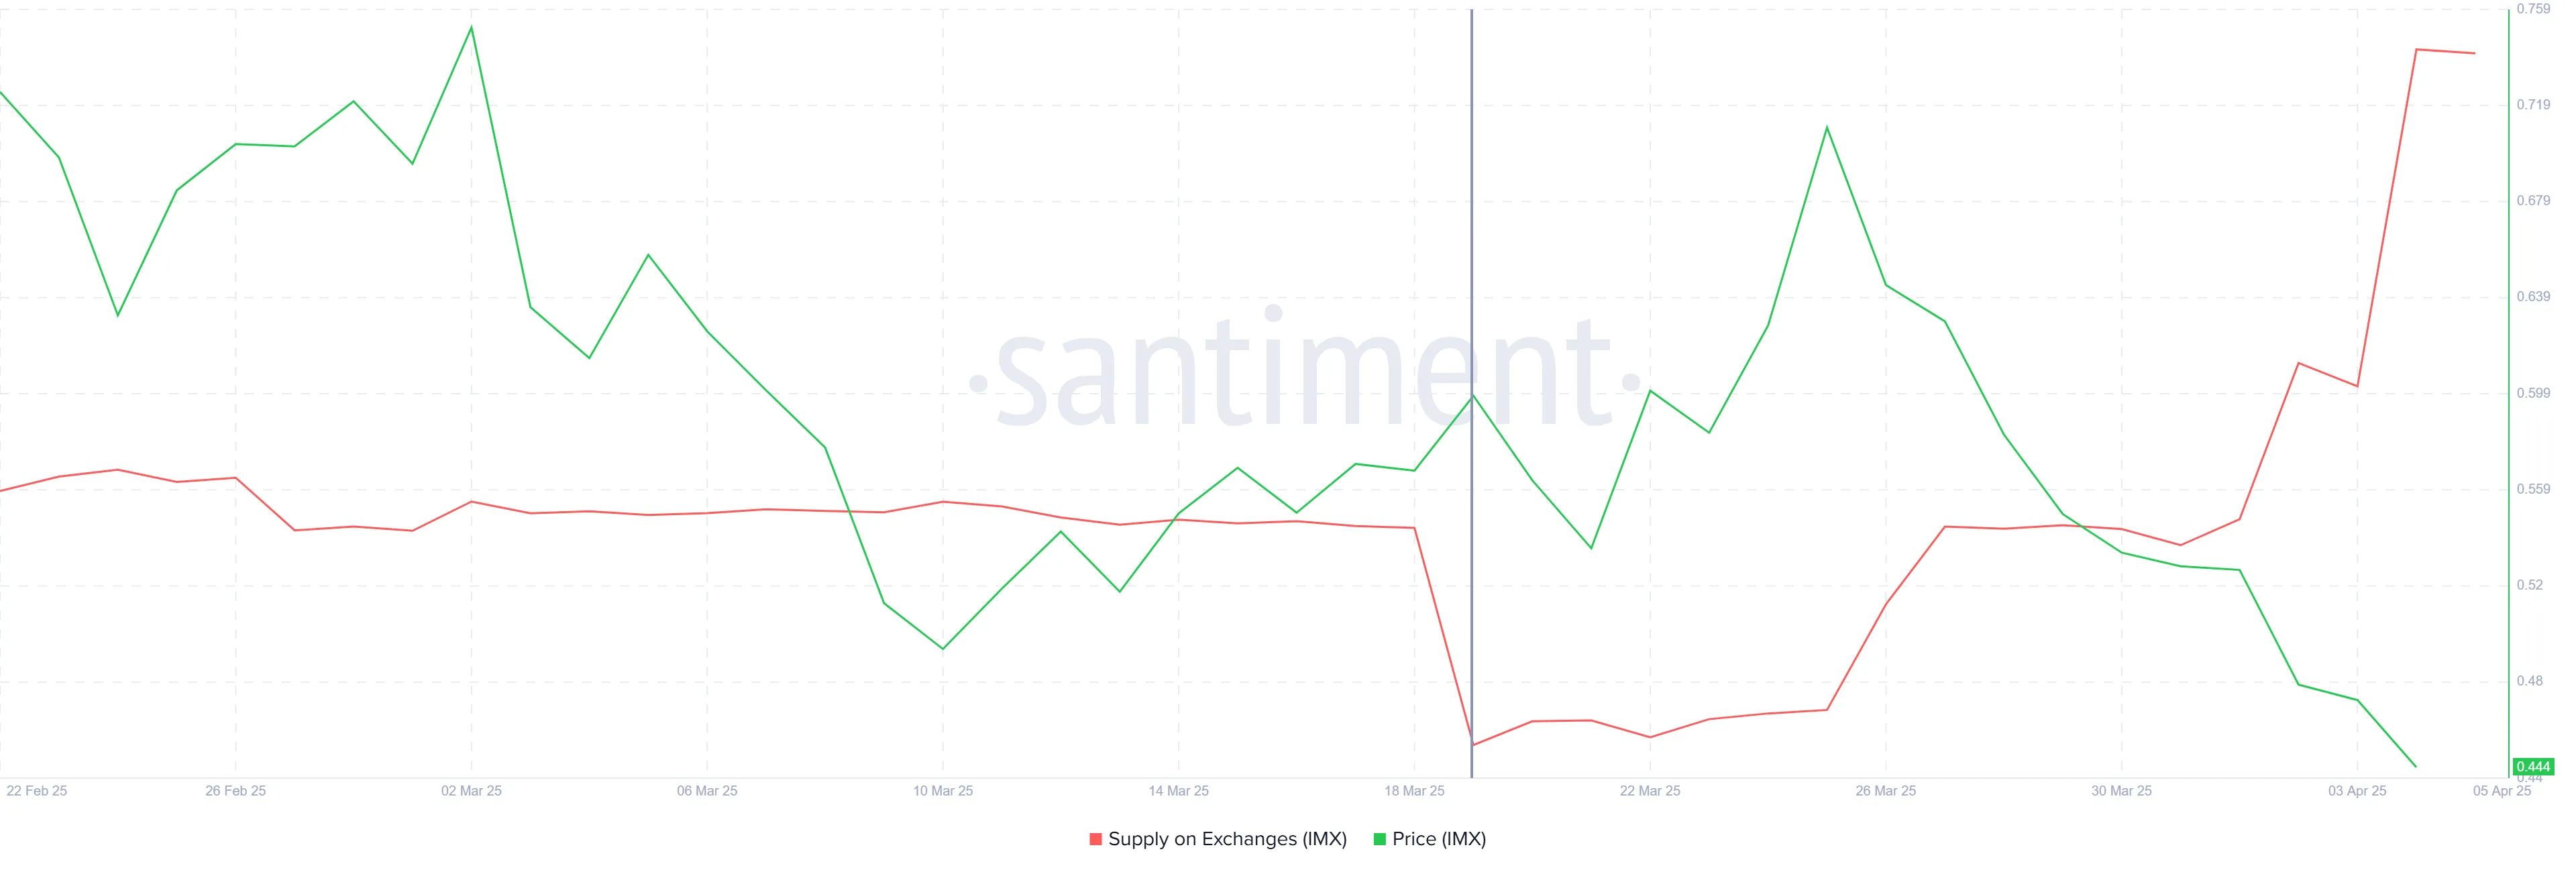
The supply of Immutable on exchanges has risen dramatically in the past two weeks. A total of 30 million IMX tokens have been added, increasing the overall supply to 165 million IMX. This surge in supply is worth approximately $13 million and indicates a shift in investor sentiment.
As investors begin to sell off their holdings, this suggests growing skepticism about the token’s future prospects. The trend has led to an increase in selling pressure, which further exacerbates the current price decline.
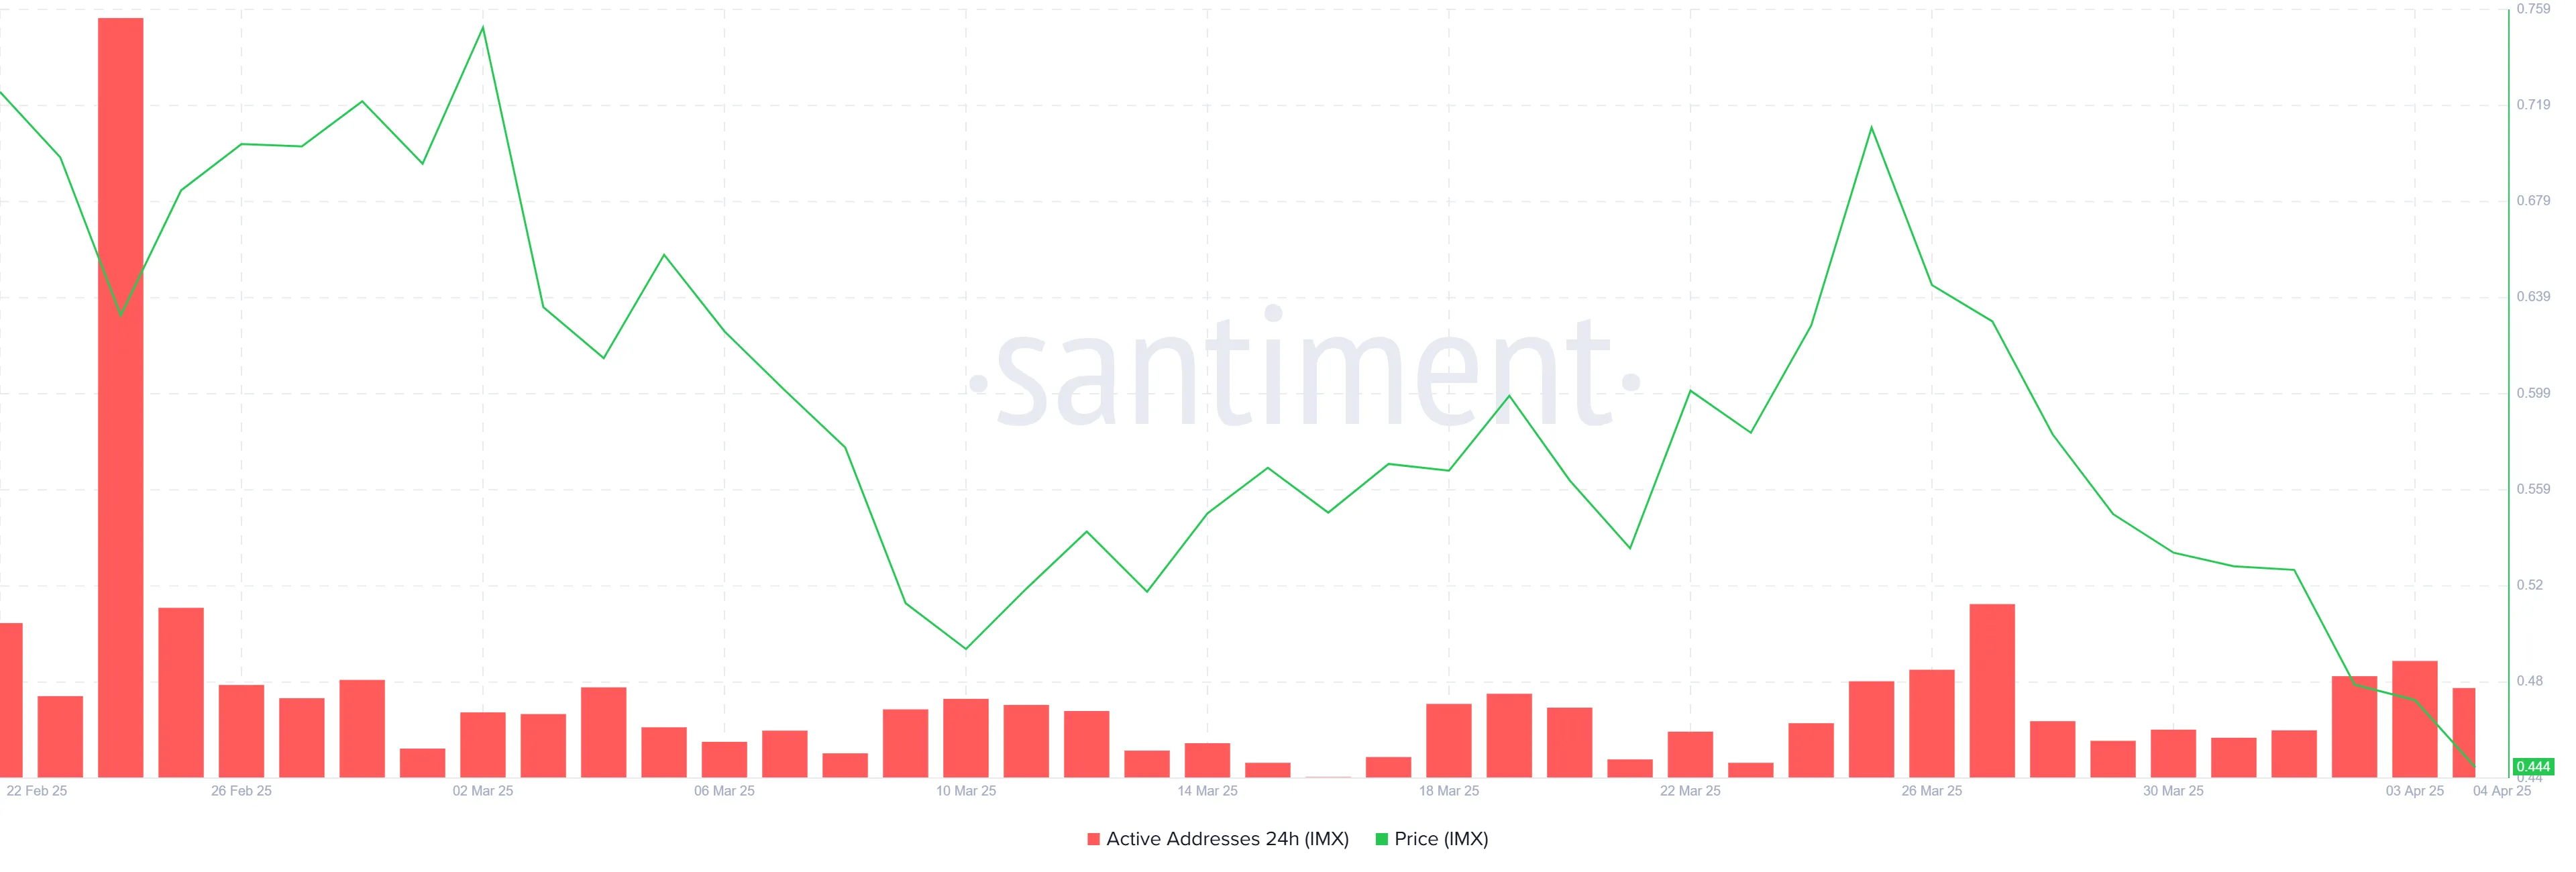
The overall macro momentum for Immutable appears to be unfavorable at this point. Active addresses, which measure the number of unique addresses engaging with the network, are at a low level. The lack of participation reflects investor hesitation and reduced confidence in the token’s potential.
When fewer addresses are interacting with the network, it generally indicates a lack of new capital entering the market. As a result, this decline in activity has contributed to the negative sentiment surrounding IMX.
IMX Price Needs A Reversal
IMX price is down nearly 40% over the past two weeks, with the 30 million token sell-off playing a significant role in the decline. At the time of writing, the price is at $0.433, holding just above the critical support level of $0.400. If this support is broken, the price could fall further, potentially reaching $0.375 or below, resulting in a new all-time low.
The continued drawdown suggests that the token may not see a recovery soon unless the market conditions improve. If IMX manages to hold above $0.400, there is a slim chance it could stabilize before testing further resistance levels. However, breaking through the $0.400 support would likely lead to more losses.

For a more optimistic scenario, IMX would need to reclaim the support level of $0.508. This could pave the way for a potential recovery, allowing the price to rise toward $0.684.
A successful breach of these levels could invalidate the bearish outlook and offer some hope for reversing recent losses.
Disclaimer
In line with the Trust Project guidelines, this price analysis article is for informational purposes only and should not be considered financial or investment advice. BeInCrypto is committed to accurate, unbiased reporting, but market conditions are subject to change without notice. Always conduct your own research and consult with a professional before making any financial decisions. Please note that our Terms and Conditions, Privacy Policy, and Disclaimers have been updated.
-

 Bitcoin24 hours ago
Bitcoin Eyes Breakout as Global M2 Hits Record $108 Trillion
-

 Market24 hours ago
NFT Market Falls 12% in March as Ethereum Sales Drop 59%
-

 Altcoin23 hours ago
PayPal Adds Chainlink And Solana To Its US Cryptocurrency Service
-

 Market23 hours ago
Crypto Whales Are Selling These Altcoins Post Trump Tariffs
-

 Market22 hours ago
Is Korea Propping Up The XRP Price? Pundit Explains What’s Happening
-

 Bitcoin20 hours ago
5 Facts About Bitcoin’s Creator
-
 Altcoin18 hours ago
Pi Network on Free Fall, 4 Reasons Pi Coin Price Going to $0.1
-

 Ethereum17 hours ago
Big-Money Traders Buying ETH Dip


