Market
Dogecoin (DOGE) Eyes $0.50 Again: Is a New Rally on the Horizon?

Dogecoin is consolidating gains above the $0.320 resistance against the US Dollar. DOGE is holding gains and eyeing more upsides above $0.400.
- DOGE price started a consolidating like Bitcoin and stayed above the $0.320 resistance level.
- The price is trading near the $0.3750 level and the 100-hourly simple moving average.
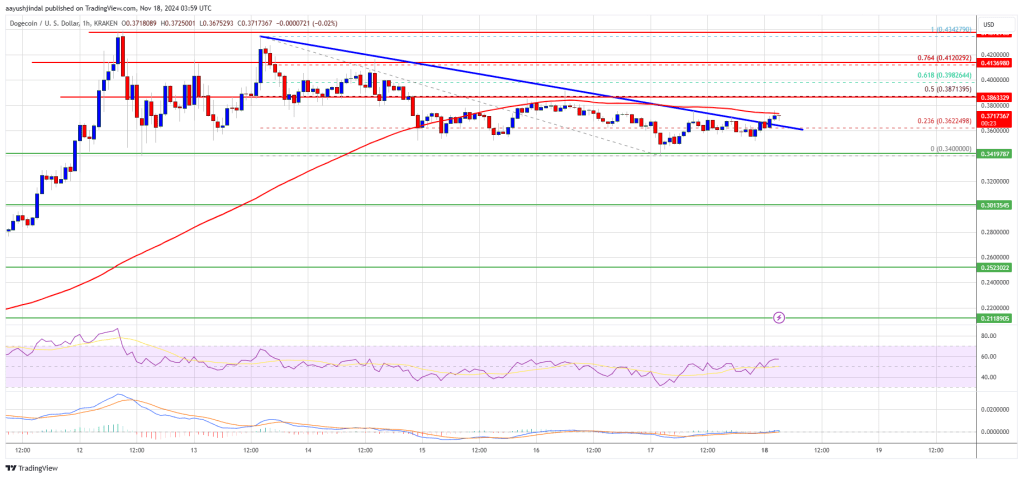
- There was a break above a key bearish trend line with resistance at $0.3670 on the hourly chart of the DOGE/USD pair (data source from Kraken).
- The price could continue to rally if it clears the $0.400 and $0.4150 resistance levels.
Dogecoin Price Eyes Fresh Surge
Dogecoin price started a consolidating phase above the $0.320 zone like Bitcoin and Ethereum. DOGE formed a base above $0.350 and is currently rising.
There was a move above the $0.3550 and $0.3620 resistance levels. The price climbed above the 23.6% Fib retracement level of the downward move from the $0.4342 swing high to the $0.3400 low. There was also a break above a key bearish trend line with resistance at $0.3670 on the hourly chart of the DOGE/USD pair.
Dogecoin price is now trading near the $0.3750 level and the 100-hourly simple moving average. Immediate resistance on the upside is near the $0.3720 level.
The next major resistance is near the $0.3880 level or the 50% Fib retracement level of the downward move from the $0.4342 swing high to the $0.3400 low. A close above the $0.3880 resistance might send the price toward the $0.400 resistance. Any more gains might send the price toward the $0.4200 level. The next major stop for the bulls might be $0.500.
Are Dips Limited In DOGE?
If DOGE’s price fails to climb above the $0.3720 level, it could start a downside correction. Initial support on the downside is near the $0.3650 level. The next major support is near the $0.3500 level.
The main support sits at $0.320. If there is a downside break below the $0.320 support, the price could decline further. In the stated case, the price might decline toward the $0.300 level or even $0.2950 in the near term.
Technical Indicators
Hourly MACD – The MACD for DOGE/USD is now gaining momentum in the bullish zone.
Hourly RSI (Relative Strength Index) – The RSI for DOGE/USD is now above the 50 level.
Major Support Levels – $0.3650 and $0.3500.
Major Resistance Levels – $0.3720 and $0.3880.
Market
Why Cardano Coin Price May Struggle To Reach $1

Cardano (ADA) has seen steady gains over the past two weeks, reaching a two-year high of $0.81 on November 16 before experiencing a slight pullback. It currently trades at $0.75, marking a 5% decline since its peak.
An analysis of its on-chain and technical indicators suggests that this downturn could continue, potentially hindering its ability to reclaim the $1 level — a milestone last reached in 2022.
Cardano Holders Sell For Gains
BeInCrypto’s assessment of Cardano’s exchange netflow has shown a spike in inflows over the past 24 hours, indicating profit-taking activity. As of 9:16 UTC on Monday, data from Coinglass shows that the altcoin has recorded net inflows totaling $7.21 million.
Higher exchange inflows suggest that coin holders are transferring their assets to exchanges to sell, leading to increased selling pressure and downward price movement.

Moreover, the decline in ADA’s trading volume over the past 24 hours confirms this bearish outlook. While the Cardano coin price surged by 7%, its trading volume dropped by 57% during that period.
When an asset’s price climbs while the trading volume decreases, it suggests that fewer buyers are participating in the market, and the upward momentum may not be as strong as it appears. This indicates market participants’ loss of interest or a lack of conviction, as many prefer to sell for profit.
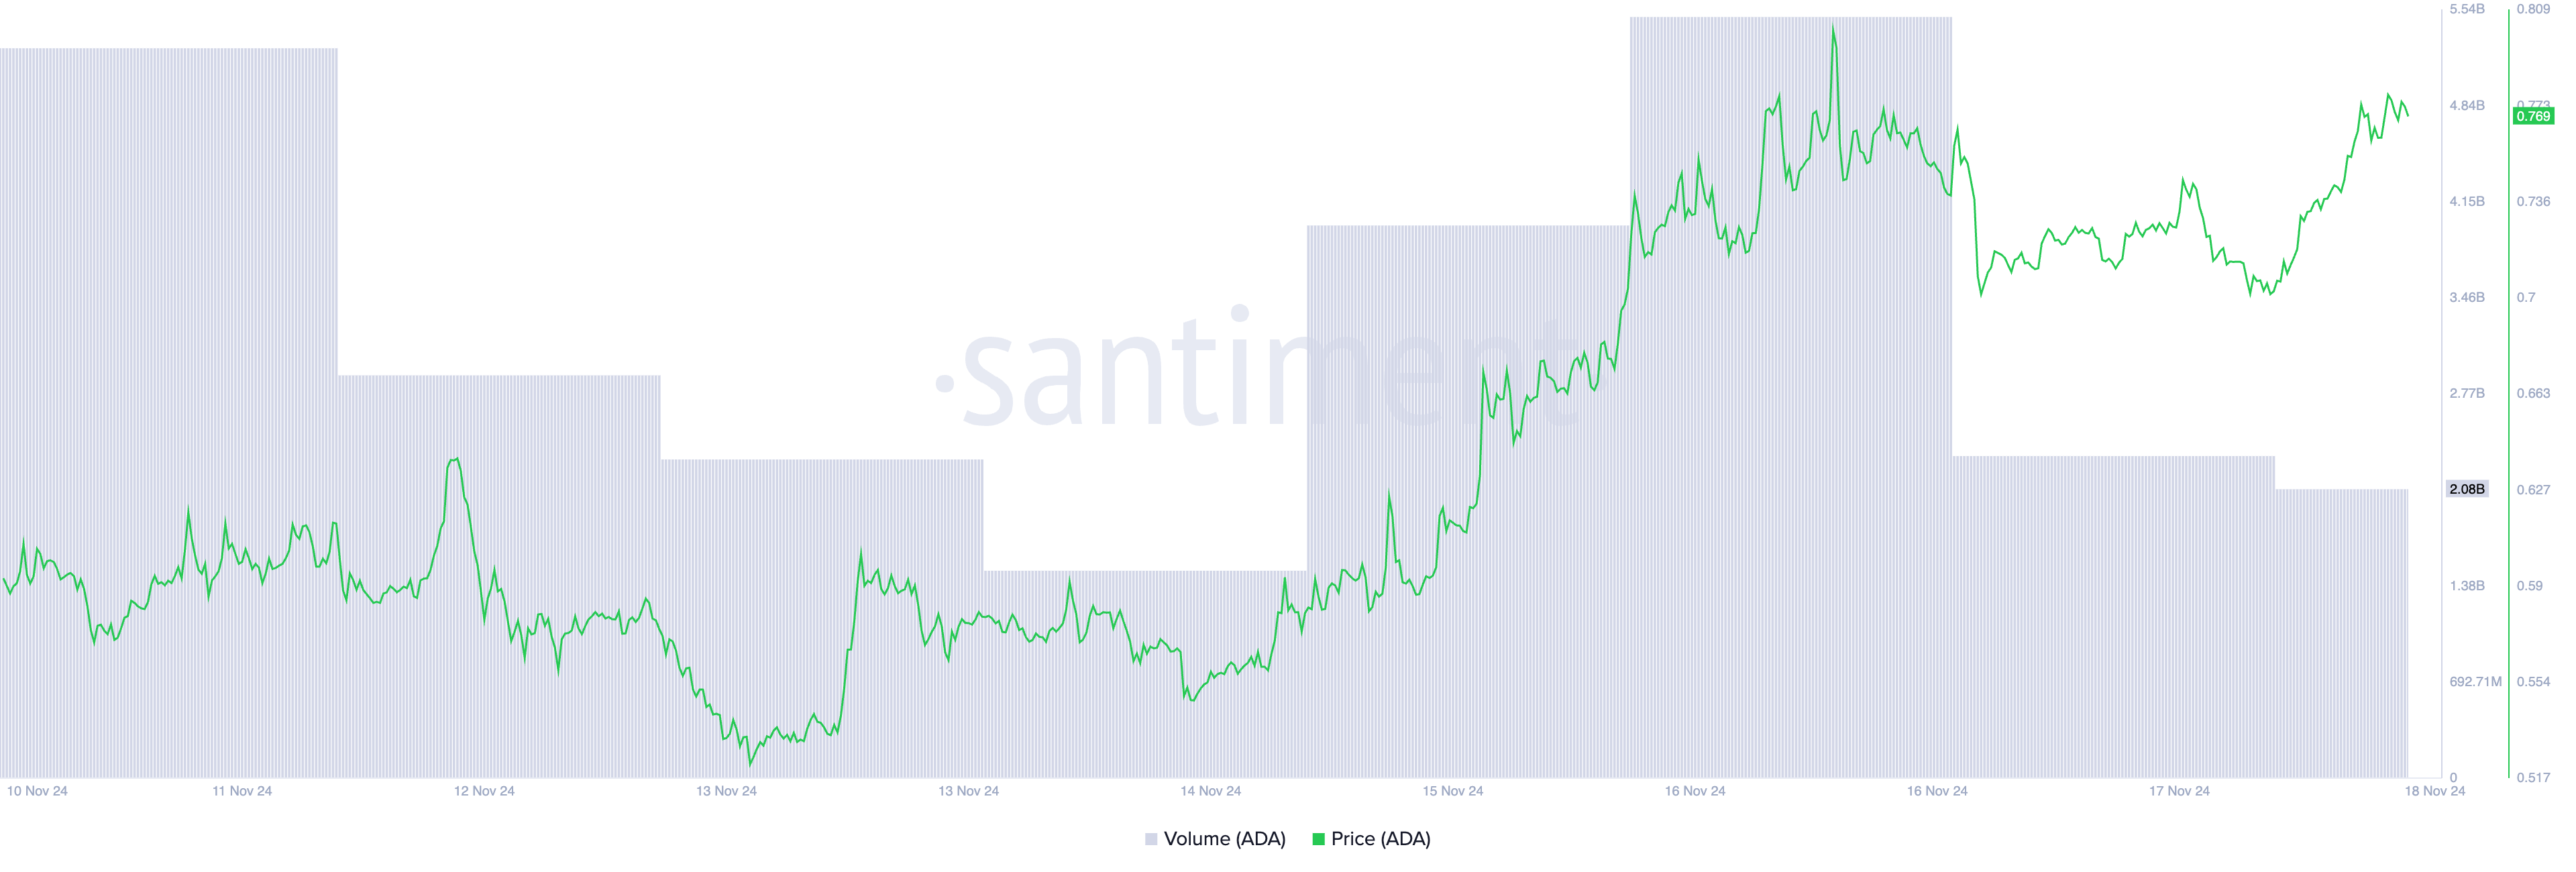
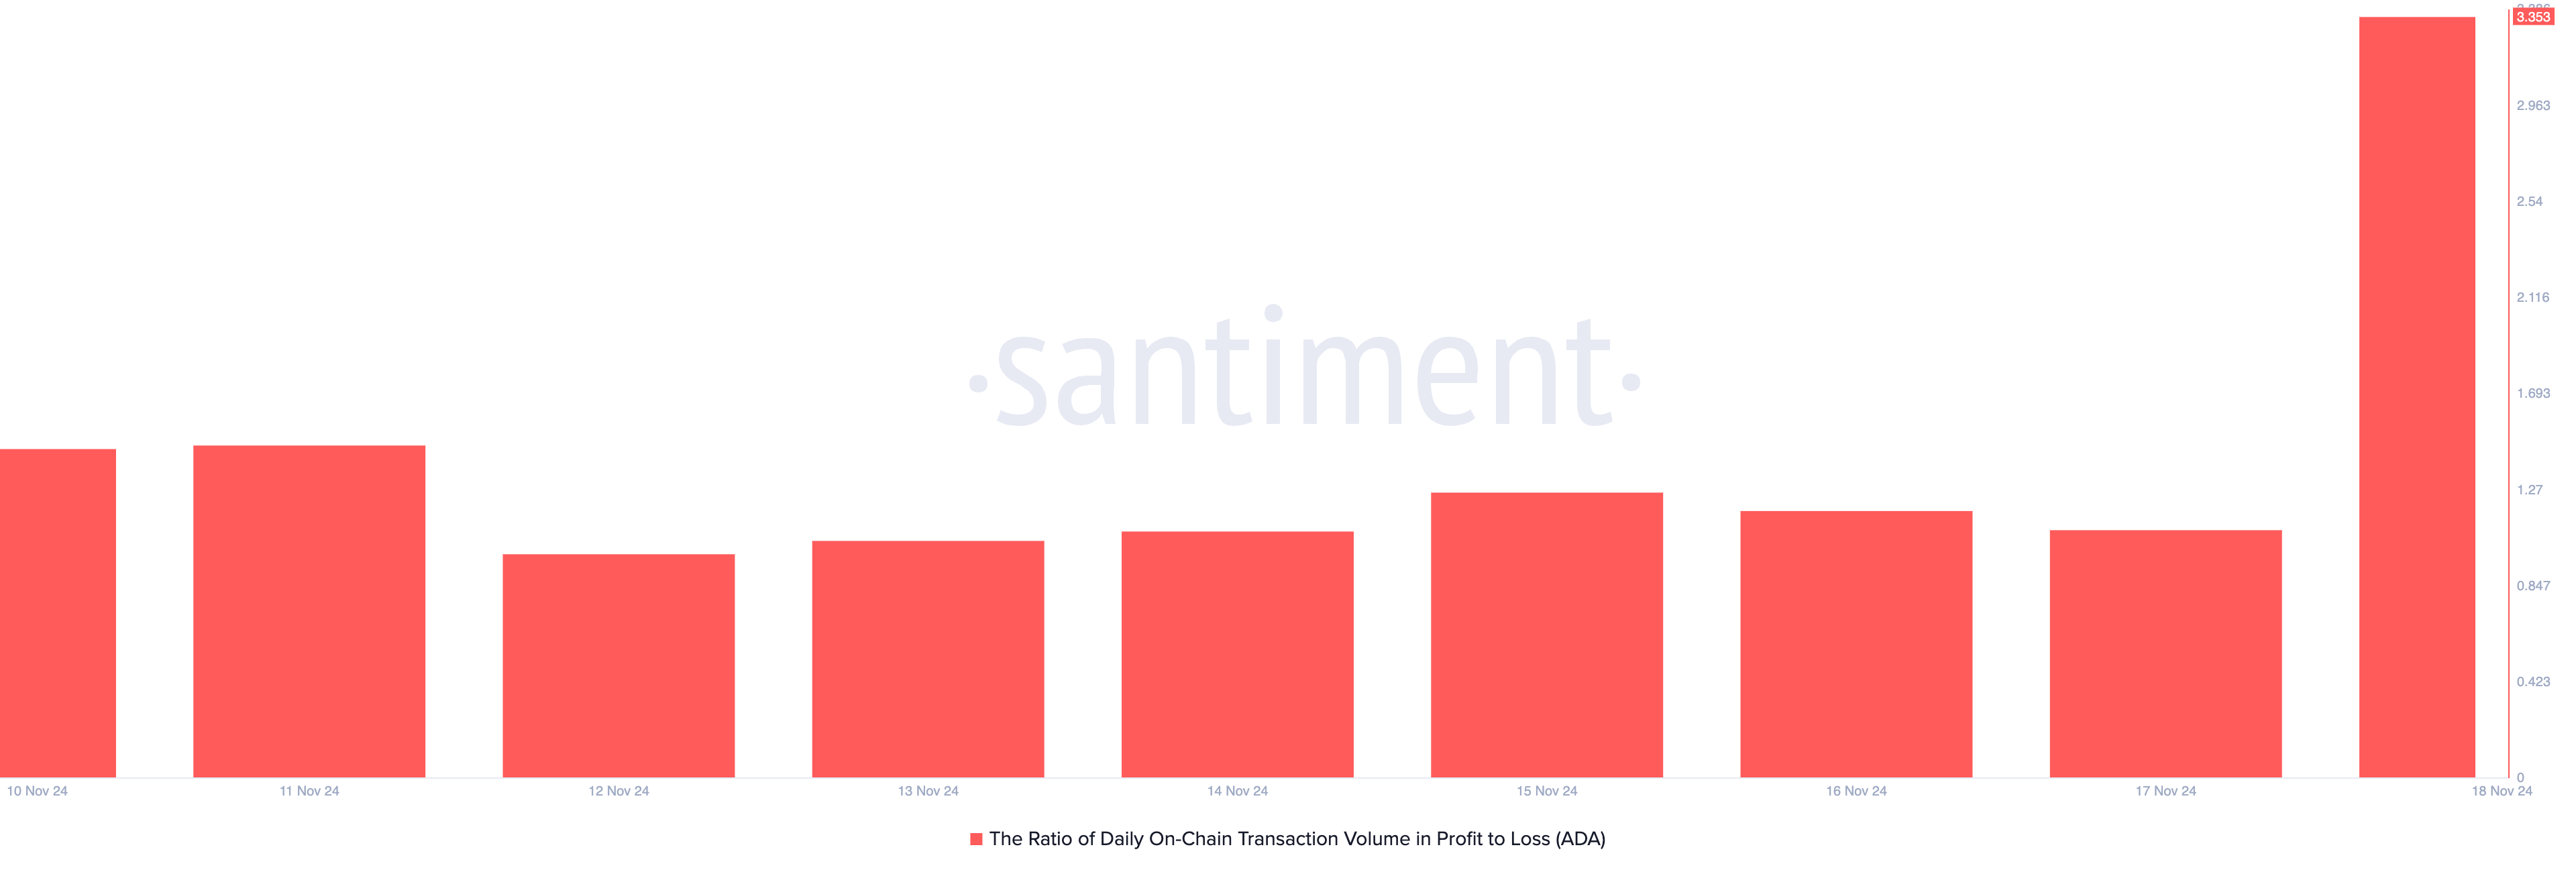
Notably, on Monday, transactions involving ADA have been significantly profitable. Per Santiment’s data, the ratio of daily on-chain transaction volume in profit to loss currently sits at 3.35, its single-day highest value since June 2020.
This means that for every ADA transaction ending in a loss, 3.35 transactions have yielded a profit. This high profit-to-loss ratio signals a potential sell opportunity for Cardano traders aiming to realize gains. It potentially increases the downward pressure on the coin’s price.
ADA Price Prediction: Further Decline on the Horizon
At press time, Cardano is trading at $0.75, shy of its two-year peak of $0.81. If buying pressure continues to wane, the coin’s price could retreat further, seeking support at $0.69. A failure by the bulls to defend this level might push the Cardano coin price even lower, potentially to $0.61.
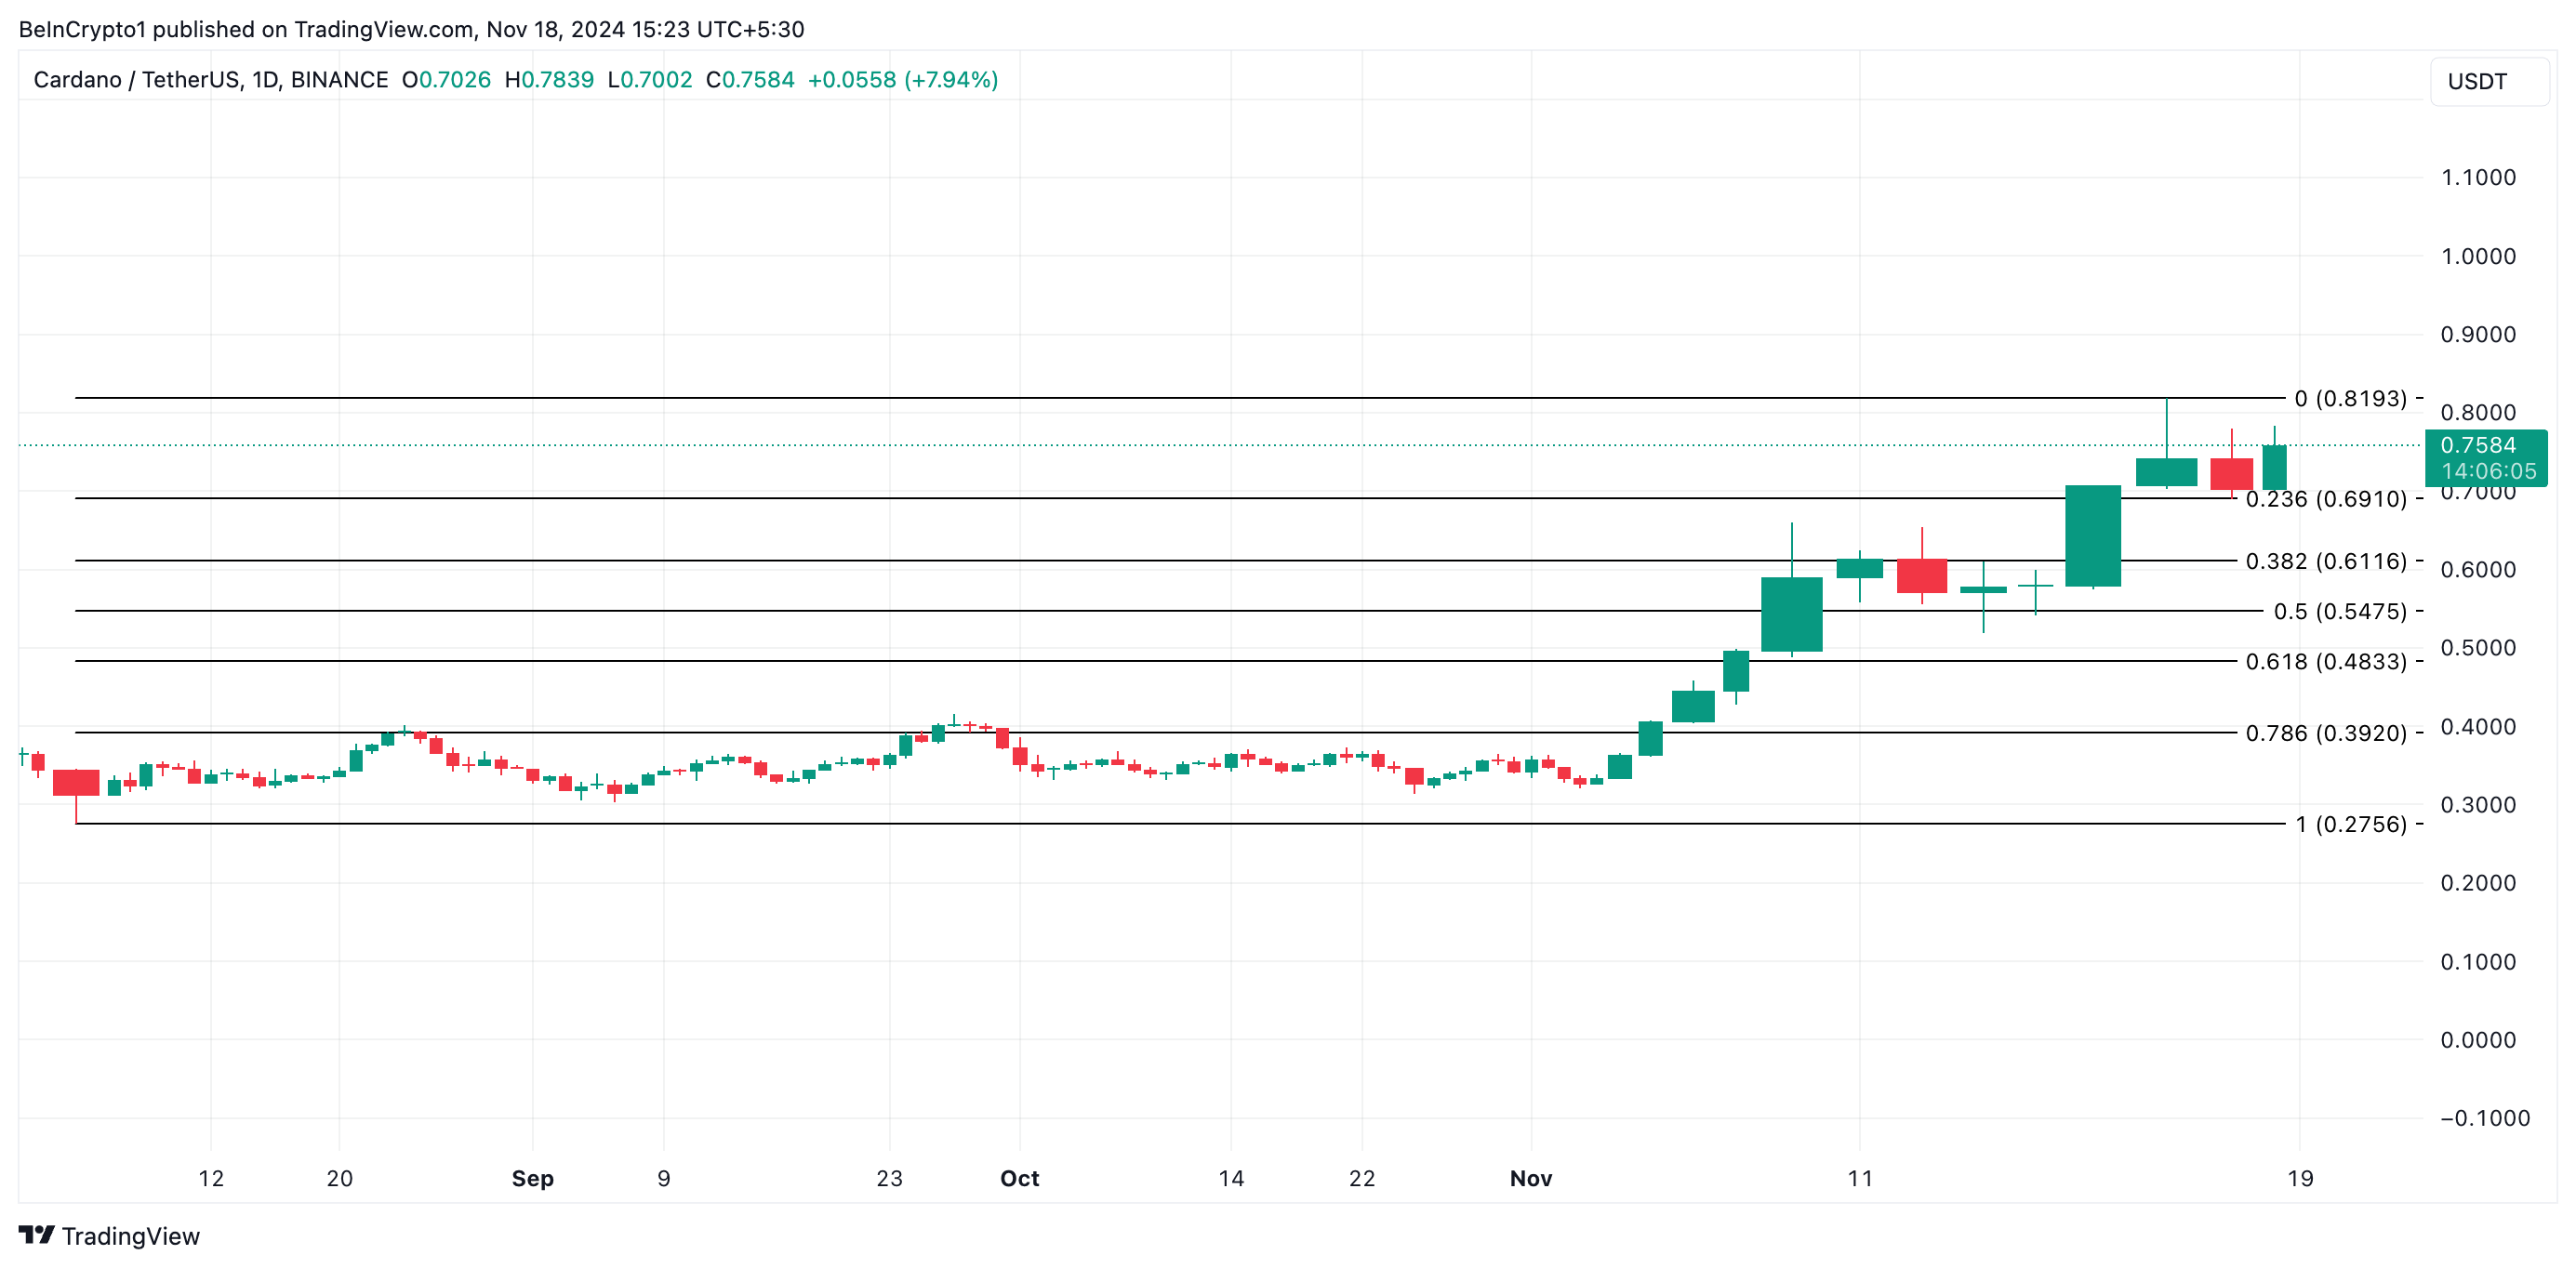
Conversely, a shift in market sentiment and renewed demand for ADA could see its price reclaim the $0.81 high and rally beyond it.
Disclaimer
In line with the Trust Project guidelines, this price analysis article is for informational purposes only and should not be considered financial or investment advice. BeInCrypto is committed to accurate, unbiased reporting, but market conditions are subject to change without notice. Always conduct your own research and consult with a professional before making any financial decisions. Please note that our Terms and Conditions, Privacy Policy, and Disclaimers have been updated.
Market
Why the XRP Token Price May Fall Below $1

Ripple’s XRP surged to a three-year high of $1.26 on Nov. 16 but has since pulled back to $1.15, reflecting a 9% decline over the past two days.
The market is currently experiencing increased selling pressure, heightening concerns that the XRP token could soon dip below the critical $1 threshold.
Ripple Sees Surge in Selling Activity
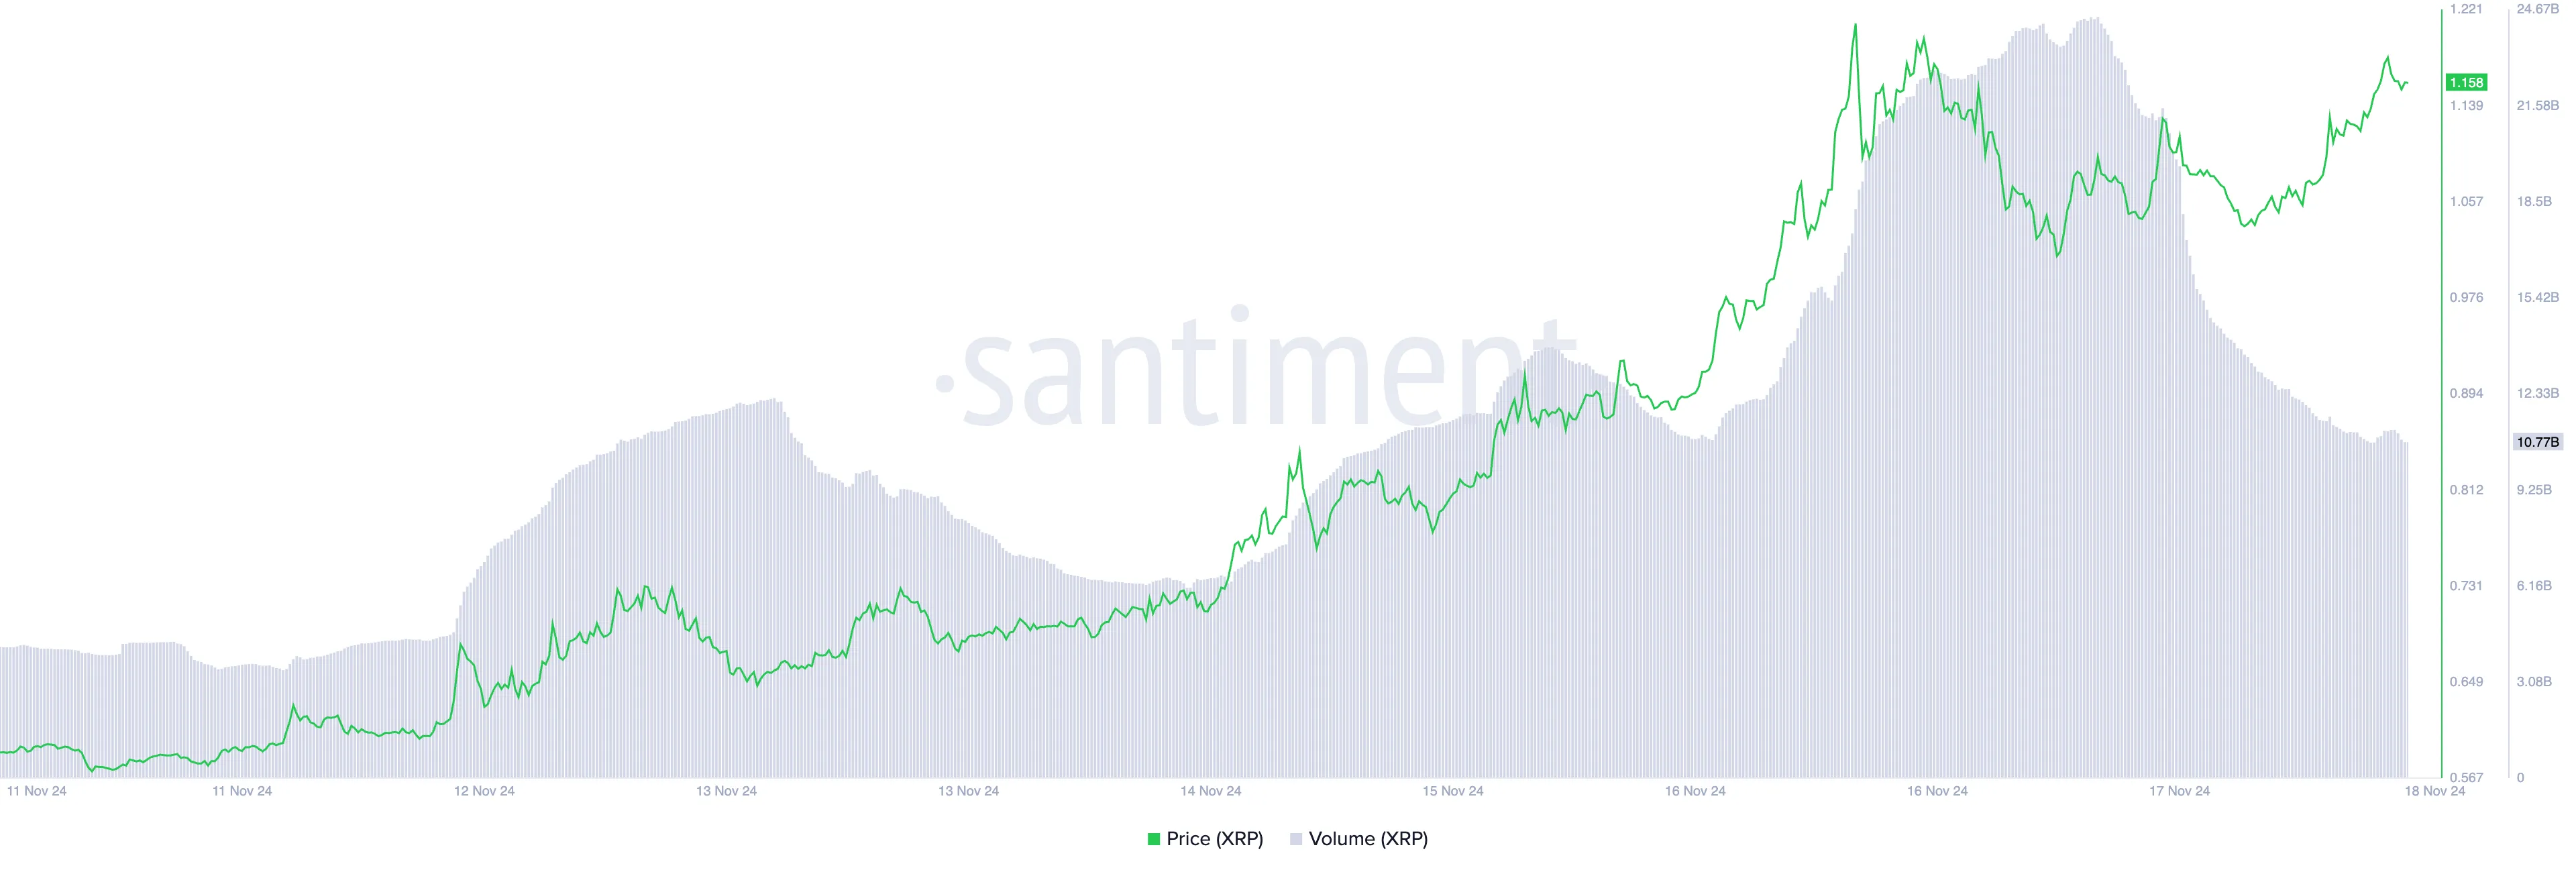
The divergence between XRP’s price and its trading volume over the past 24 hours is a notable indicator of the surge in selling pressure. The altcoin’s value has climbed 7% within this period, while its trading volume has plummeted by 55%.
When an asset’s price rises while trading volume declines, it signals waning market participation. Price increases are more sustainable when accompanied by higher trading volumes, which suggests higher market interest.
However, when the price increases with declining volume, the rally is losing momentum. It indicates that fewer participants are driving the price movement, potentially making it less reliable or more susceptible to reversals.
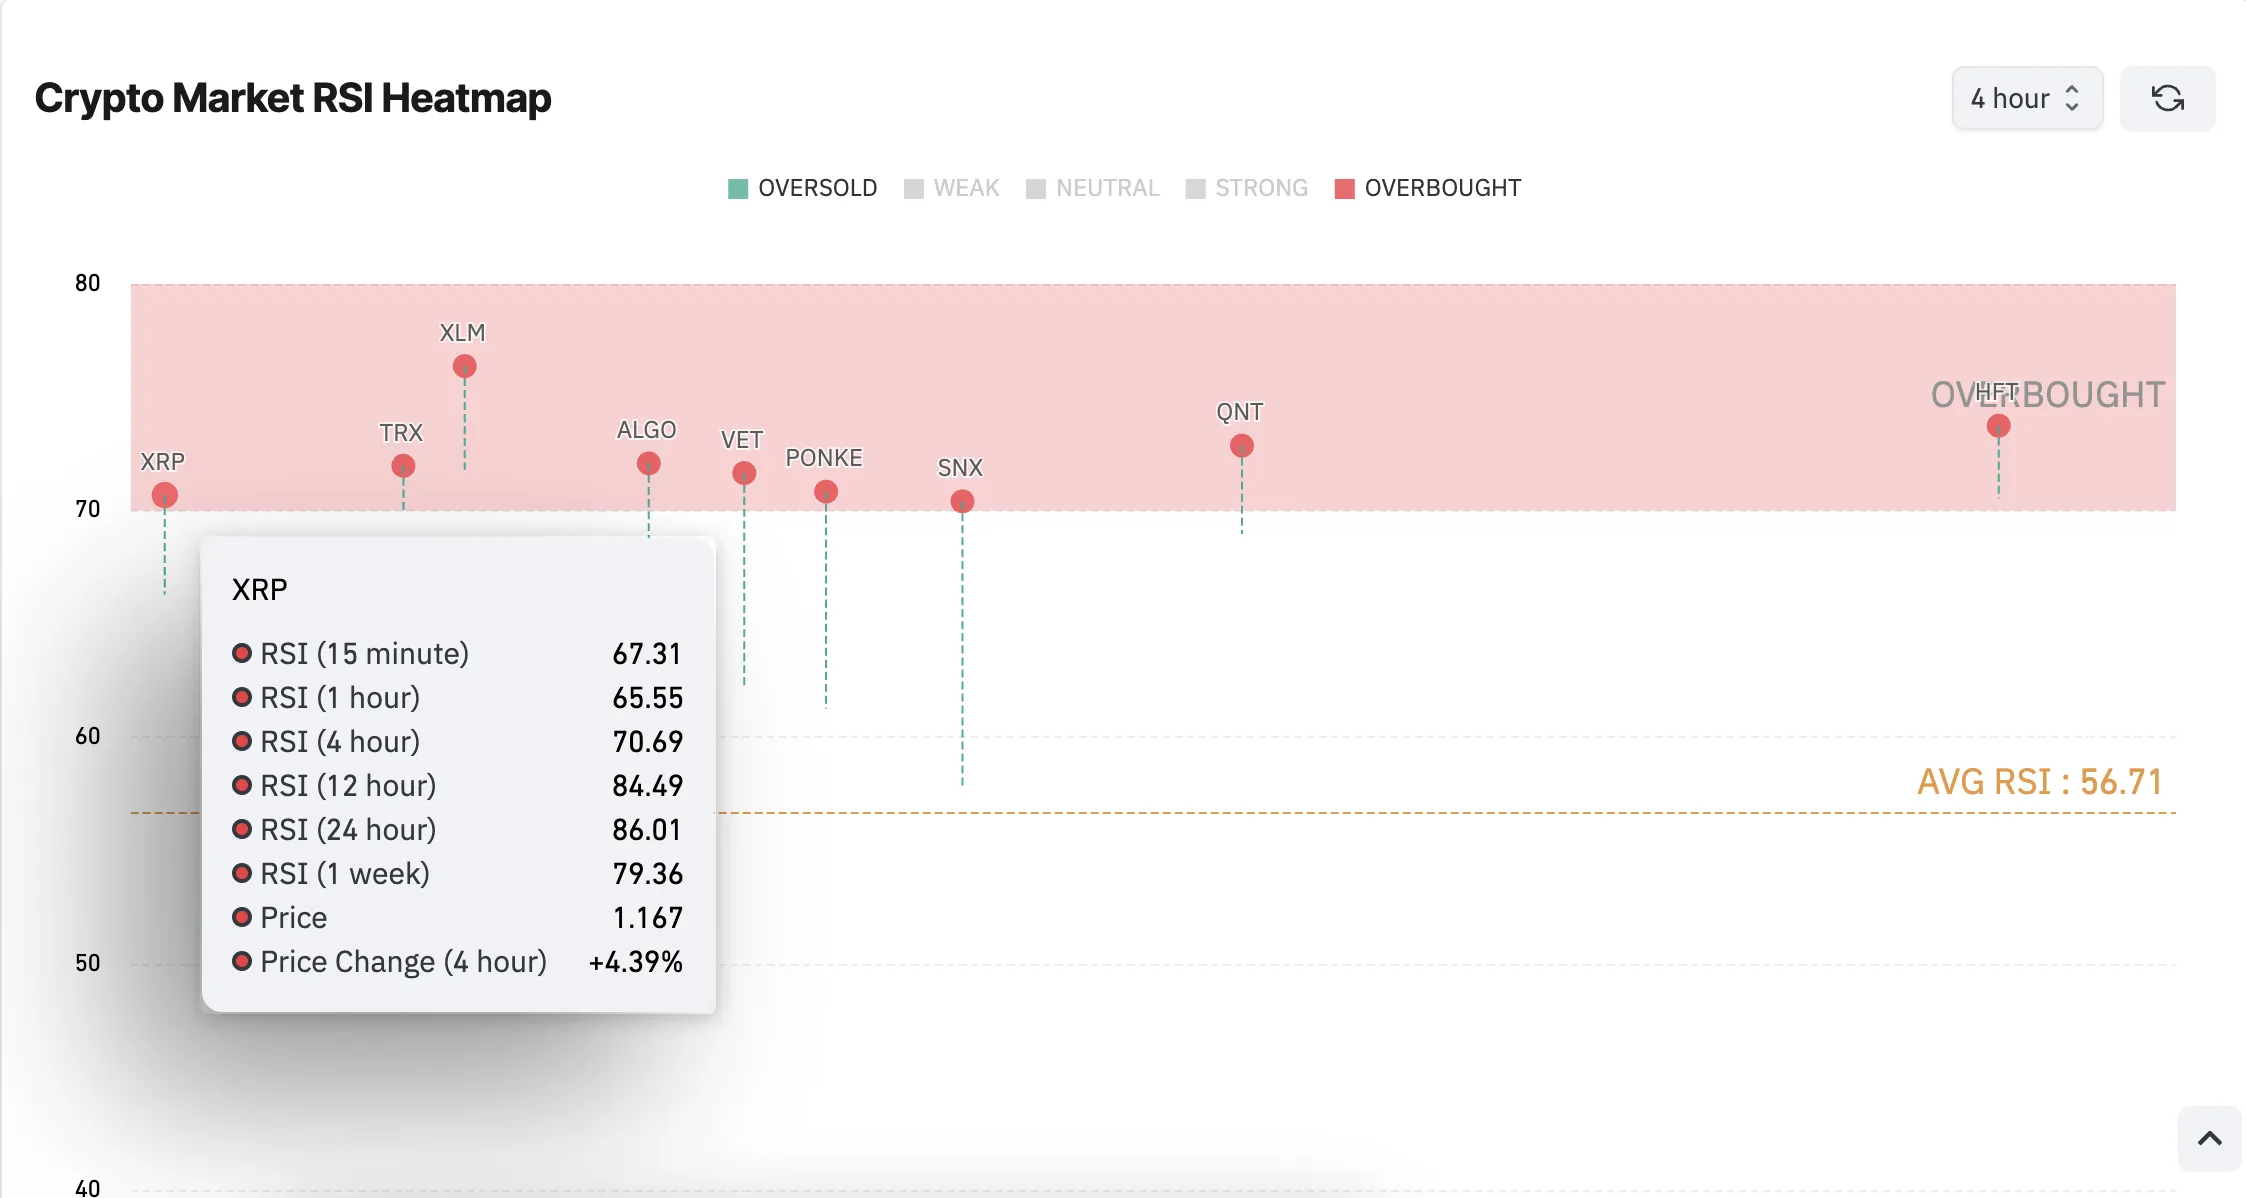
Additionally, a heatmap of XRP’s Relative Strength Index (RSI) indicates overbought conditions across four of six timeframes, hinting at continued price pullback in the meantime.
The RSI measures an asset’s overbought and oversold market conditions. It ranges between 0 and 100, with values above 70 suggesting that the asset is overbought and due for a decline. On the other hand, an RSI value below 30 indicates that the asset is overbought and may witness a rebound.
XRP’s overbought conditions across multiple timeframes point to a clear conclusion: the market is overheated. Signs of buyer exhaustion are emerging, raising the likelihood of a sustained decline in the XRP crypto price.
XRP Price Prediction: Sub $1 Price Level Imminent
Currently, XRP is trading at $1.15, maintaining support at $1.06. If selling pressure escalates, the altcoin may test this support level. A breach could see the price dip below the psychological $1 mark, potentially reaching $0.93. Continued selling could push XRP even lower, possibly targeting $0.82.
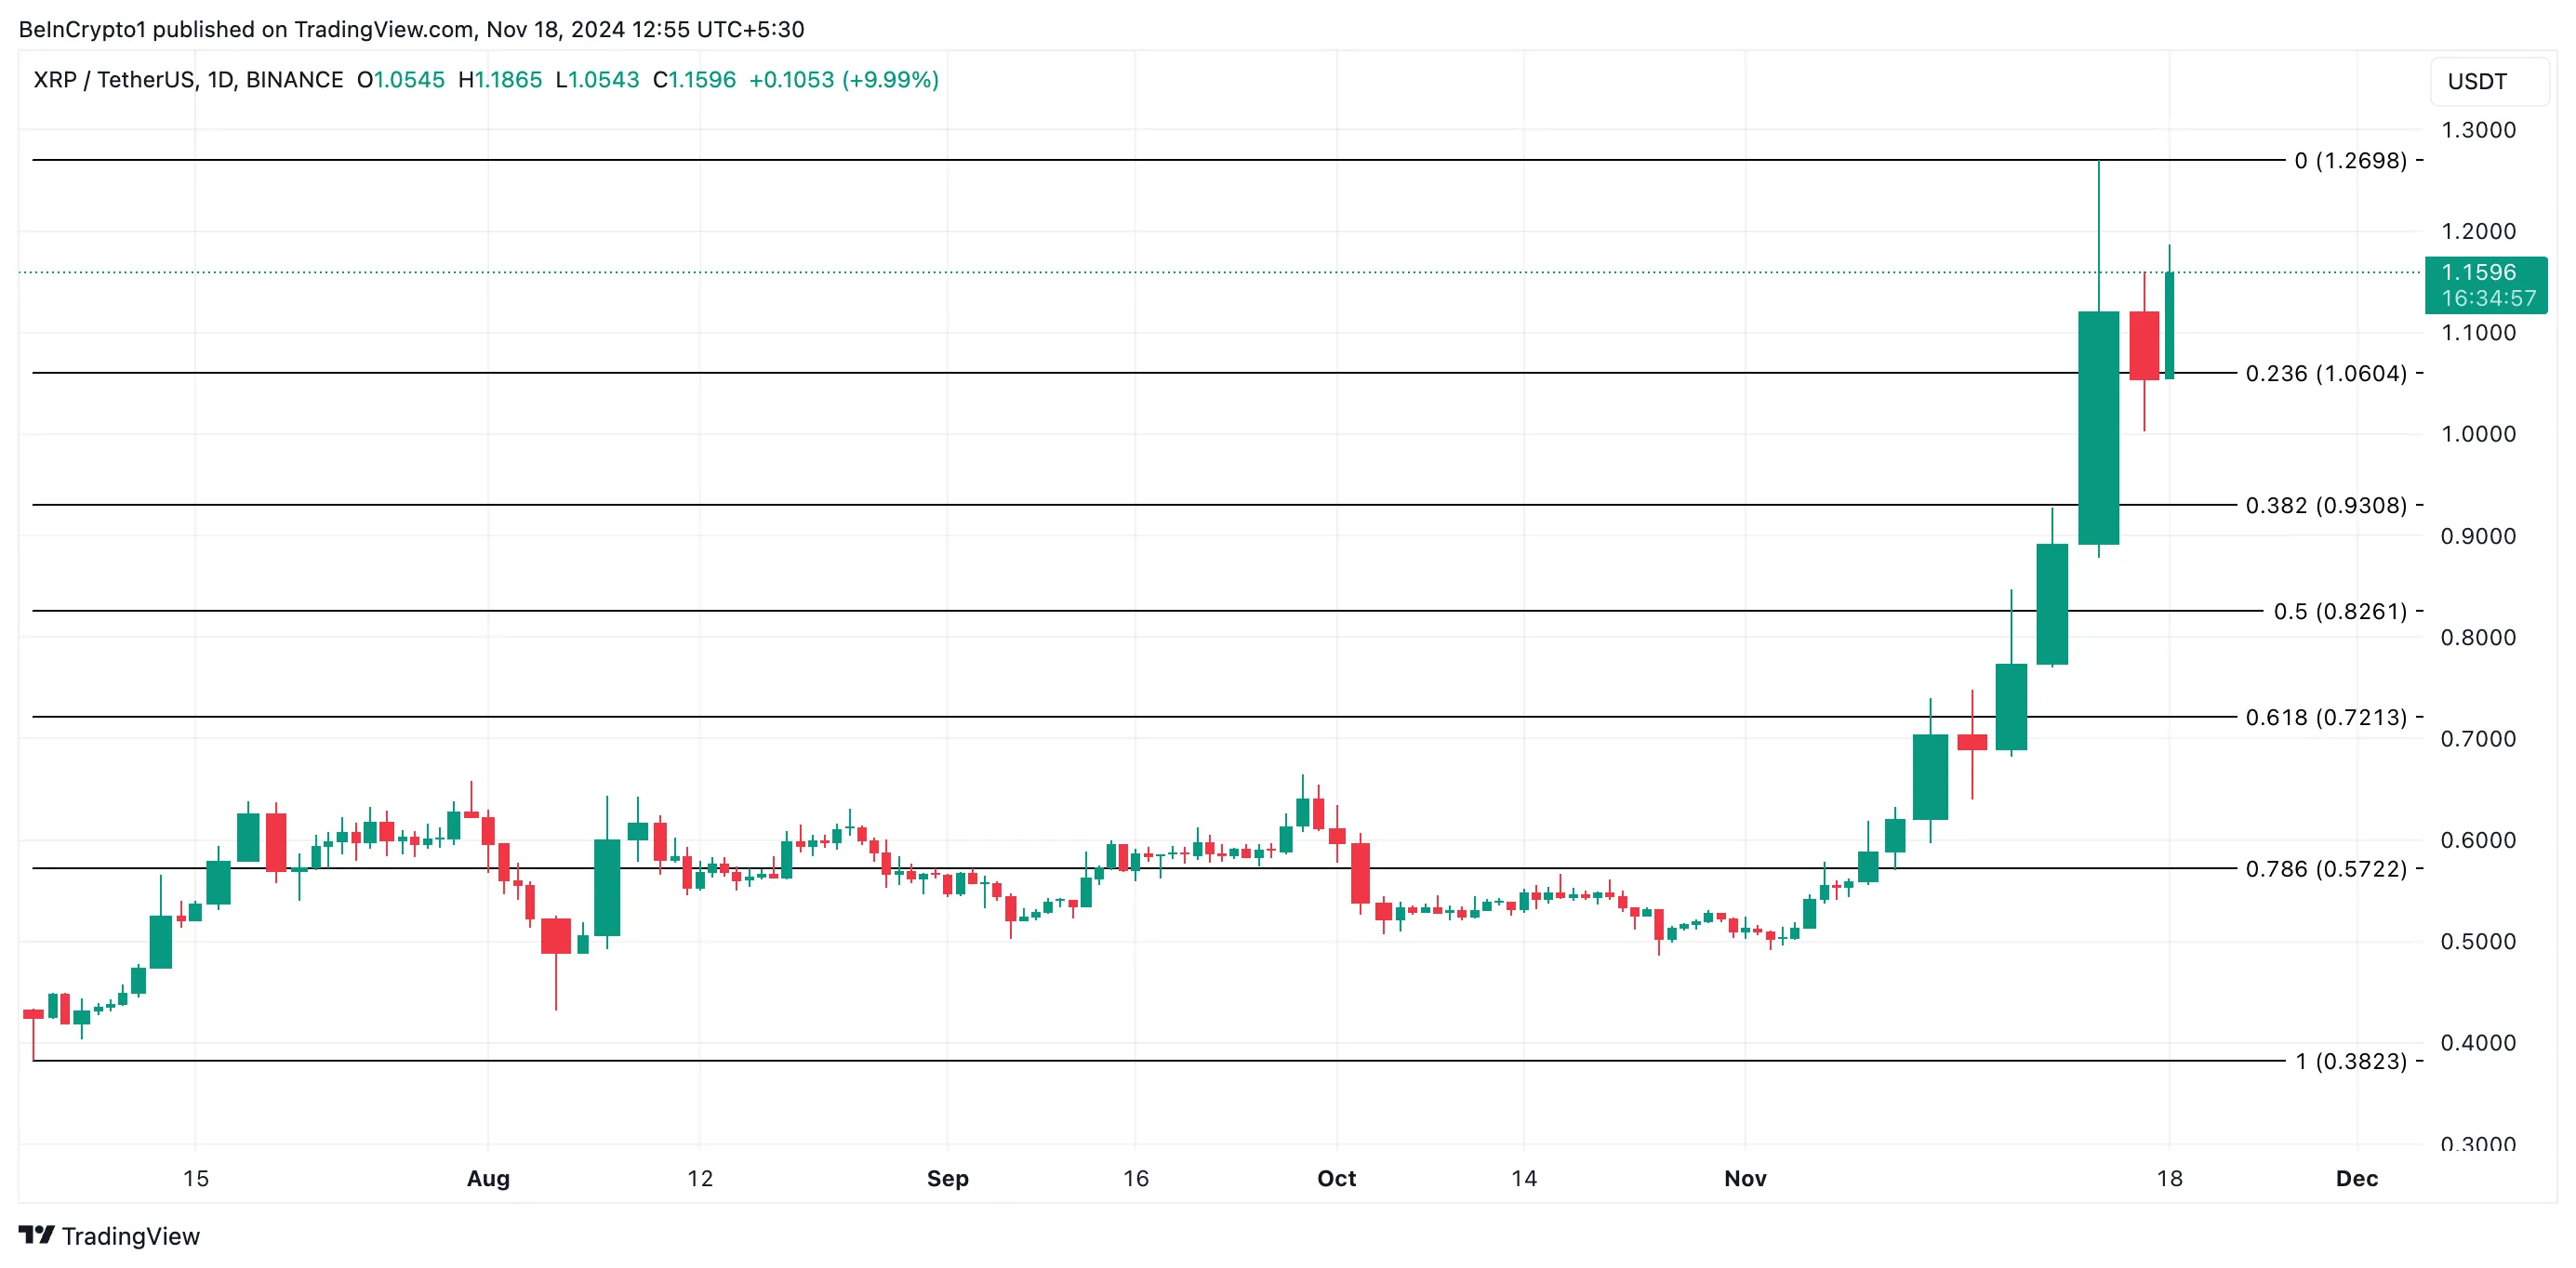
However, a resurgence in demand could propel XRP back to its three-year high of $1.26 and above, invalidating the bearish outlook outlined above.
Disclaimer
In line with the Trust Project guidelines, this price analysis article is for informational purposes only and should not be considered financial or investment advice. BeInCrypto is committed to accurate, unbiased reporting, but market conditions are subject to change without notice. Always conduct your own research and consult with a professional before making any financial decisions. Please note that our Terms and Conditions, Privacy Policy, and Disclaimers have been updated.
Market
SUI Price’s 105% Rally This Month Makes It “Best Thing to Buy”

SUI has surged significantly in price this month, climbing to new all-time highs over the weekend.
The altcoin, which has gained 105% in the past two weeks, is now considered a standout performer in the crypto market. Currently trading just below its peak, SUI shows strong potential for further gains.
SUI Is a Good Bet
Analyst Michael Van de Poppe recently labeled SUI as the “best thing to buy” during Bitcoin’s correction phase. The altcoin’s popularity among traders is evident, with SUI trending across major platforms. Open Interest (OI) in SUI futures has also reached an all-time high of $826 million, underlining heightened demand and investor confidence.
The increasing capital flow into SUI reflects broader market enthusiasm. Traders are viewing it as a reliable option amid fluctuations in larger cryptocurrencies like Bitcoin. This surge in attention has amplified SUI’s visibility, making it a focal point for both retail and institutional investors.

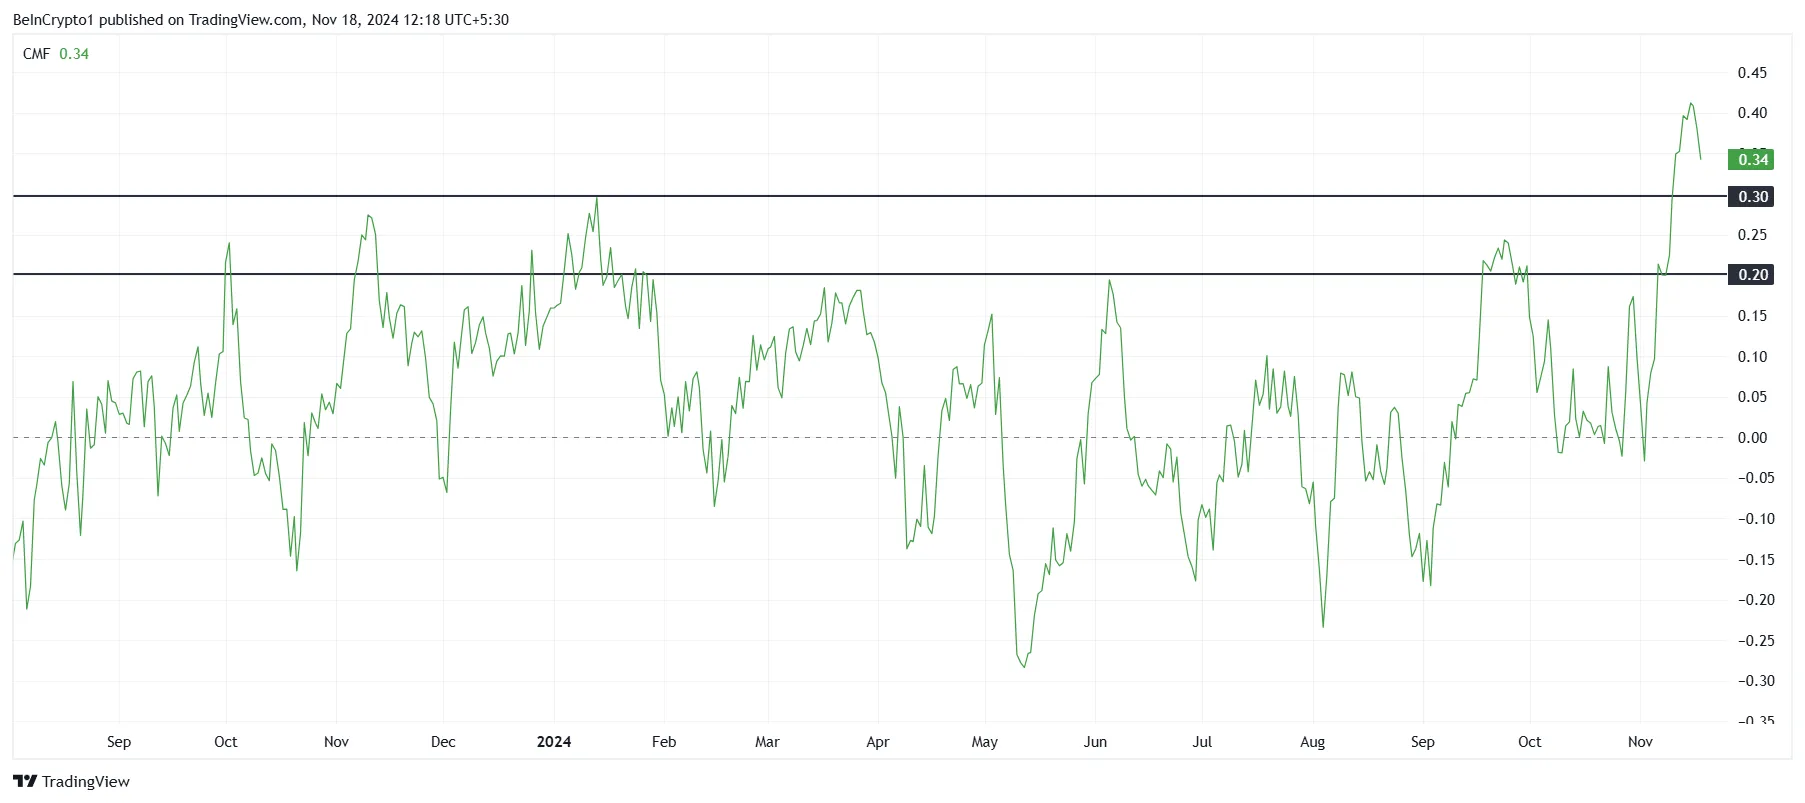
SUI’s macro momentum is bolstered by its Chaikin Money Flow (CMF) indicator, which is currently well above the typical reversal range of 0.20 to 0.30. This level indicates substantial inflows, signaling growing interest from investors. Historically, reversals occur when the CMF reaches these levels, but the current breakout suggests exponential growth potential.
Such strong inflows demonstrate the asset’s resilience and sustained investor participation. If this trend continues, SUI could attract even more capital, strengthening its position as a high-growth altcoin in the market.
SUI Price Prediction: Reaching New ATH
SUI is currently trading at $3.79, just shy of its all-time high of $3.94, achieved over the weekend. The altcoin’s impressive 105% rally has solidified its position as a top-performing cryptocurrency this month.
Considering the ongoing bullish momentum, SUI is likely to hold its gains. The aforementioned factors do point towards SUI potentially setting a new all-time high if current trends persist.
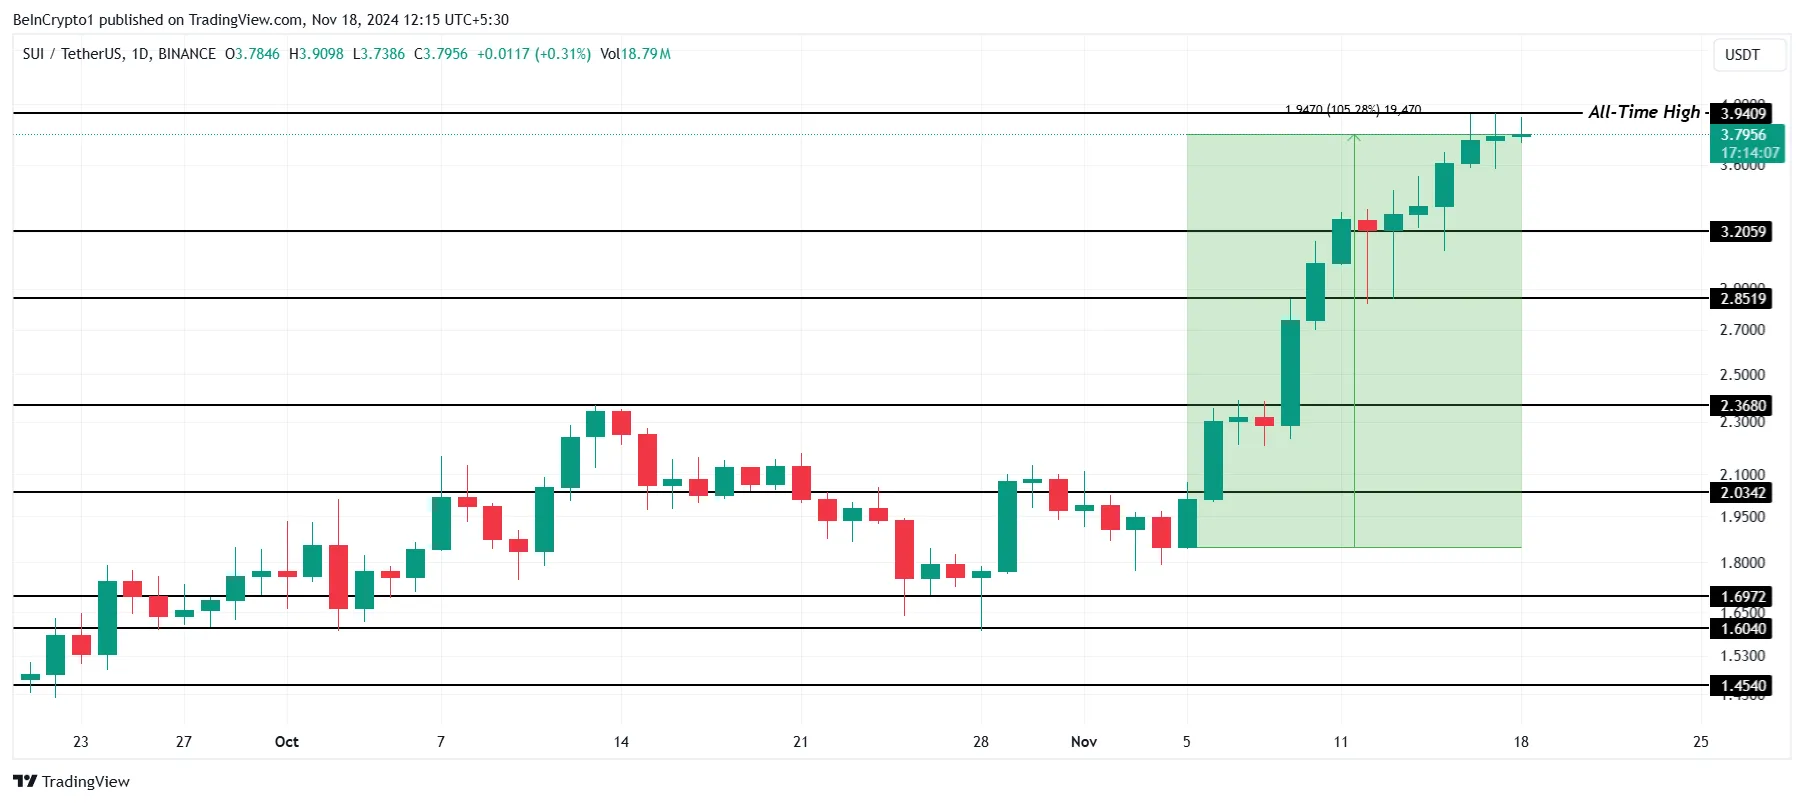
However, a shift in sentiment or profit-taking by investors could trigger a drawdown. In such a scenario, SUI may fall to the $3.20 support level, and a drop below this would invalidate the bullish outlook.
Disclaimer
In line with the Trust Project guidelines, this price analysis article is for informational purposes only and should not be considered financial or investment advice. BeInCrypto is committed to accurate, unbiased reporting, but market conditions are subject to change without notice. Always conduct your own research and consult with a professional before making any financial decisions. Please note that our Terms and Conditions, Privacy Policy, and Disclaimers have been updated.
-

 Ethereum15 hours ago
Spot Ethereum ETFs See $515 Million Record Weekly Inflows – Details
-

 Market13 hours ago
Crypto Leaders Praise Elon Musk-led D.O.G.E Initiative
-

 Market11 hours ago
Coinbase Base Achieves 1 Billion Transactions Amid Art Scandal
-

 Market23 hours ago
Why XLM Volume Hit 3-Year Peak After XRP $1 Rally
-

 Altcoin8 hours ago
Will Cardano Price Continue To Rally Amid Bullish On-Chain Metrics?
-

 Market7 hours ago
Ethereum Price Confronts Barriers to a New Surge—Can Bulls Prevail?
-

 Altcoin7 hours ago
BTC Holds $90K, OM Soars 40%, HBAR Rises 28%
-

 Bitcoin5 hours ago
Key US Economic Data That May Drive Crypto Volatility This Week

