Market
Can Support Prevent Further Losses?

Ethereum price started a downside correction below the $3,250 zone. ETH is now consolidating near $3,000 and might attempt a fresh increase.
- Ethereum started a short-term downside correction below the $3,250 zone.
- The price is trading above $3,200 and the 100-hourly Simple Moving Average.
- There is a connecting bearish trend line forming with resistance at $3,185 on the hourly chart of ETH/USD (data feed via Kraken).
- The pair could start a fresh increase if it remains stable above the $3,000 zone.
Ethereum Price Hits Support
Ethereum price failed to extend gains above the $3,450 zone and started a downside correction like Bitcoin. ETH declined below the $3,320 and $3,250 support levels.
The bears even pushed the price below the $3,120 zone. It tested the $3,000 support zone. A low was formed at $3,031 and the price is now consolidating losses. It might soon test the 23.6% Fib retracement level of the recent decline from the $3,340 swing high to the $3,031 low.
Ethereum price is now trading below $3,200 and the 100-hourly Simple Moving Average. On the upside, the price seems to be facing hurdles near the $3,120 level.
The first major resistance is near the $3,200 level. There is also a connecting bearish trend line forming with resistance at $3,185 on the hourly chart of ETH/USD. The main resistance is now forming near $3,265 or the 76.4% Fib retracement level of the recent decline from the $3,340 swing high to the $3,031 low.
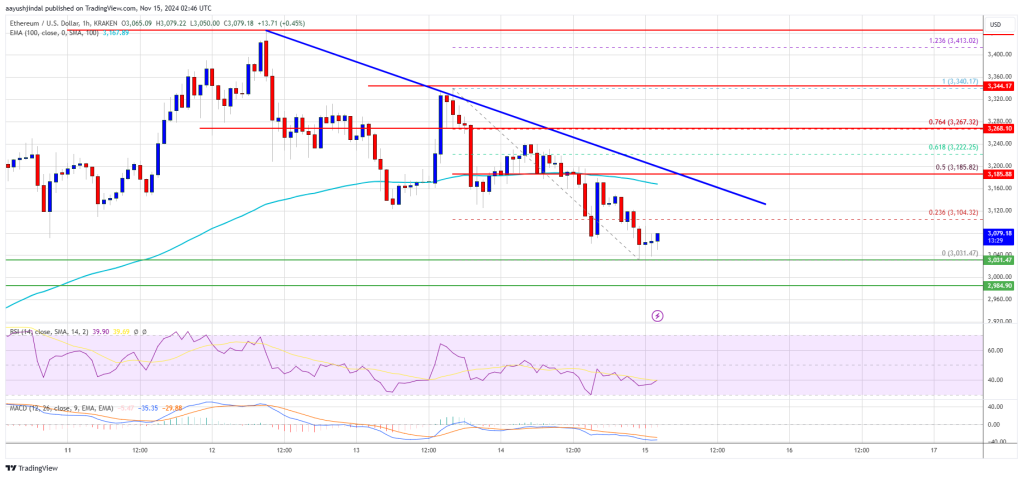
A clear move above the $3,265 resistance might send the price toward the $3,320 resistance. An upside break above the $3,320 resistance might call for more gains in the coming sessions. In the stated case, Ether could rise toward the $3,450 resistance zone.
More Losses In ETH?
If Ethereum fails to clear the $3,200 resistance, it could continue to move down. Initial support on the downside is near the $3,040 level. The first major support sits near the $3,000 zone.
A clear move below the $3,000 support might push the price toward $2,950. Any more losses might send the price toward the $2,880 support level in the near term. The next key support sits at $2,740.
Technical Indicators
Hourly MACD – The MACD for ETH/USD is losing momentum in the bearish zone.
Hourly RSI – The RSI for ETH/USD is now below the 50 zone.
Major Support Level – $3,040
Major Resistance Level – $3,200
Market
Shiba Inu’s 65% Rise Triggers Largest LTH Move in Eight Months

Shiba Inu (SHIB) price has experienced a remarkable 65% surge in the past week, attracting significant attention from both retail and institutional investors. However, following this rally, SHIB has seen a sharp pullback, bringing it to a critical support level at $0.00002411.
This price action has raised concerns, particularly regarding the behavior of long-term holders (LTHs), whose actions suggest that SHIB’s future recovery may not be as smooth as initially hoped.
Shiba Inu Investors Are Restless
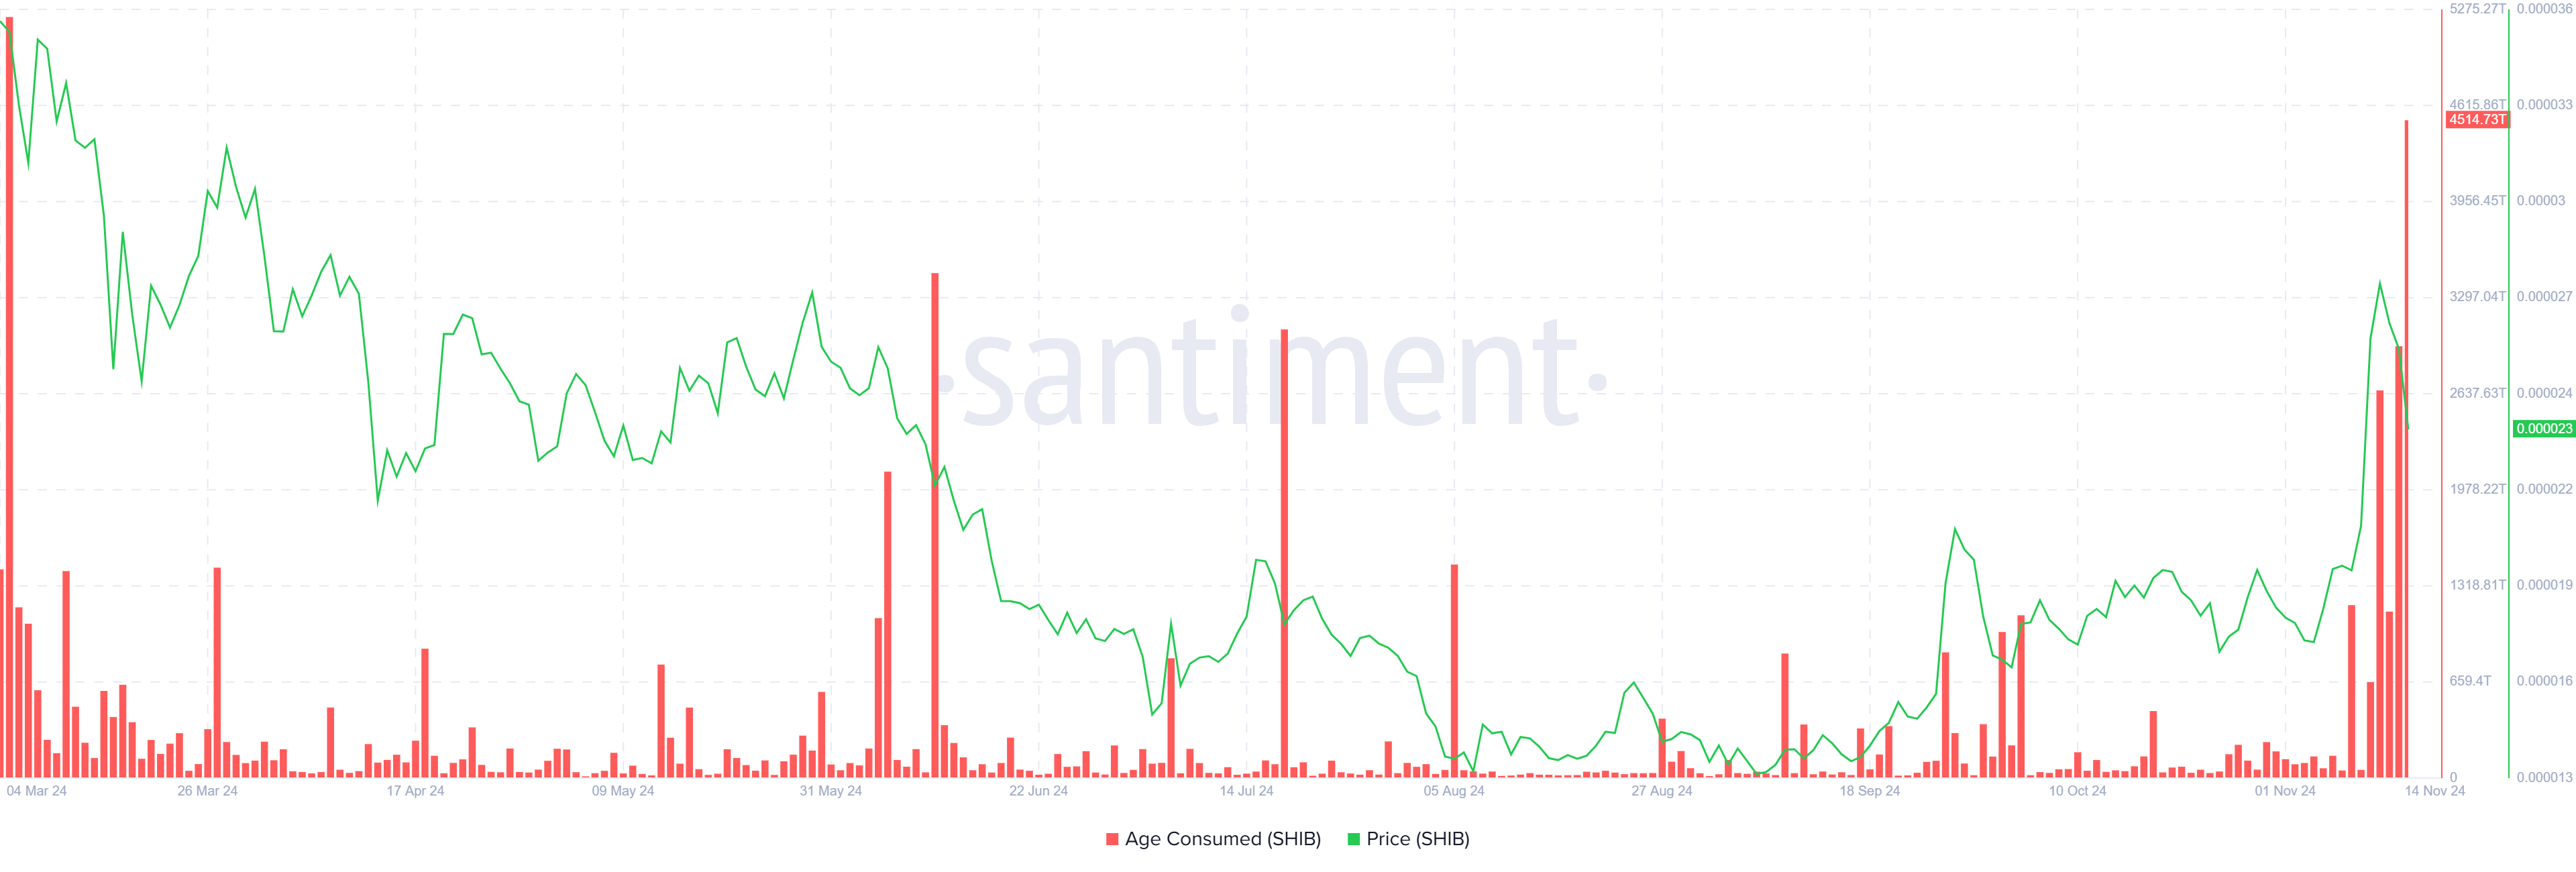
In the past 24 hours, Shiba Inu’s “age consumed” metric—a key indicator for tracking the movement of coins held for extended periods—has surged to its highest levels since March. This spike in activity points to the largest shift of LTH-held SHIB tokens in the last eight months. LTHs, who typically form the backbone of an asset’s market stability, have been moving their tokens more significantly than usual.
This increased activity among long-term holders signals uncertainty, with many investors potentially reconsidering their HODLing strategies. Such moves are typically seen as a bearish signal, suggesting that LTHs may no longer be as confident in the coin’s short-term outlook.
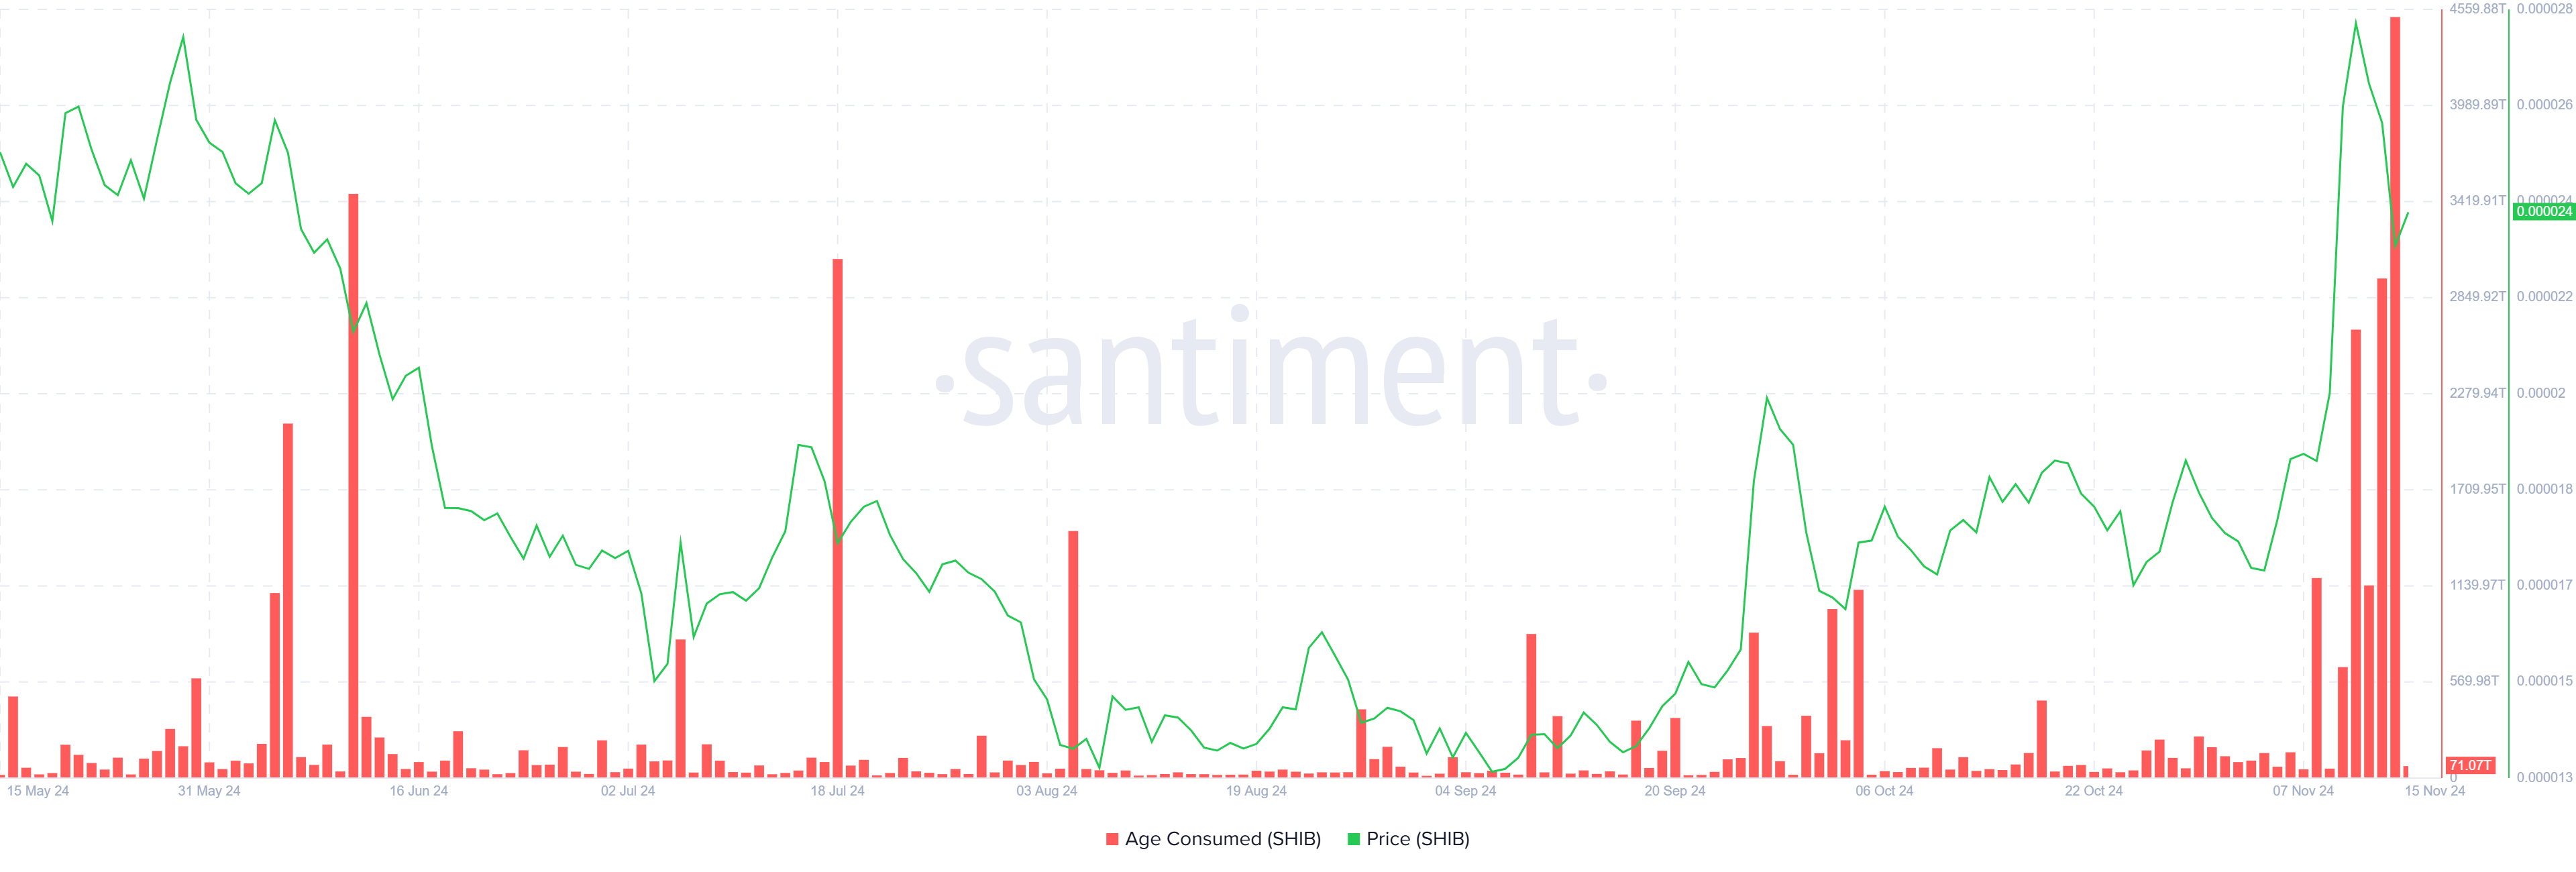
Active deposits, which track the number of unique addresses moving their SHIB holdings to exchanges, have also seen a notable decline. After a significant spike in activity earlier this week, the number of active deposits has dropped, indicating that fewer investors are looking to sell their holdings in the immediate future.
This could be a sign of investors pulling away from the market, possibly awaiting a more favorable market condition or a clearer trend. The decrease in active deposits suggests that there may be less immediate pressure to sell, which is a positive sign for SHIB in the longer term.
SHIB Price Prediction: Saving The Rise
Currently, Shiba Inu’s price stands at $0.00002411, down by 13% over the past 24 hours. This correction, while not drastic, has erased a substantial portion of the recent gains from the 65% rally, leaving investors cautious.
Despite this pullback, SHIB is showing signs of stabilizing around a key support level at $0.00002267, which has held firm for the past few days. If the support level continues to hold, SHIB could start trending upwards once again, with the next resistance target at $0.00002976.
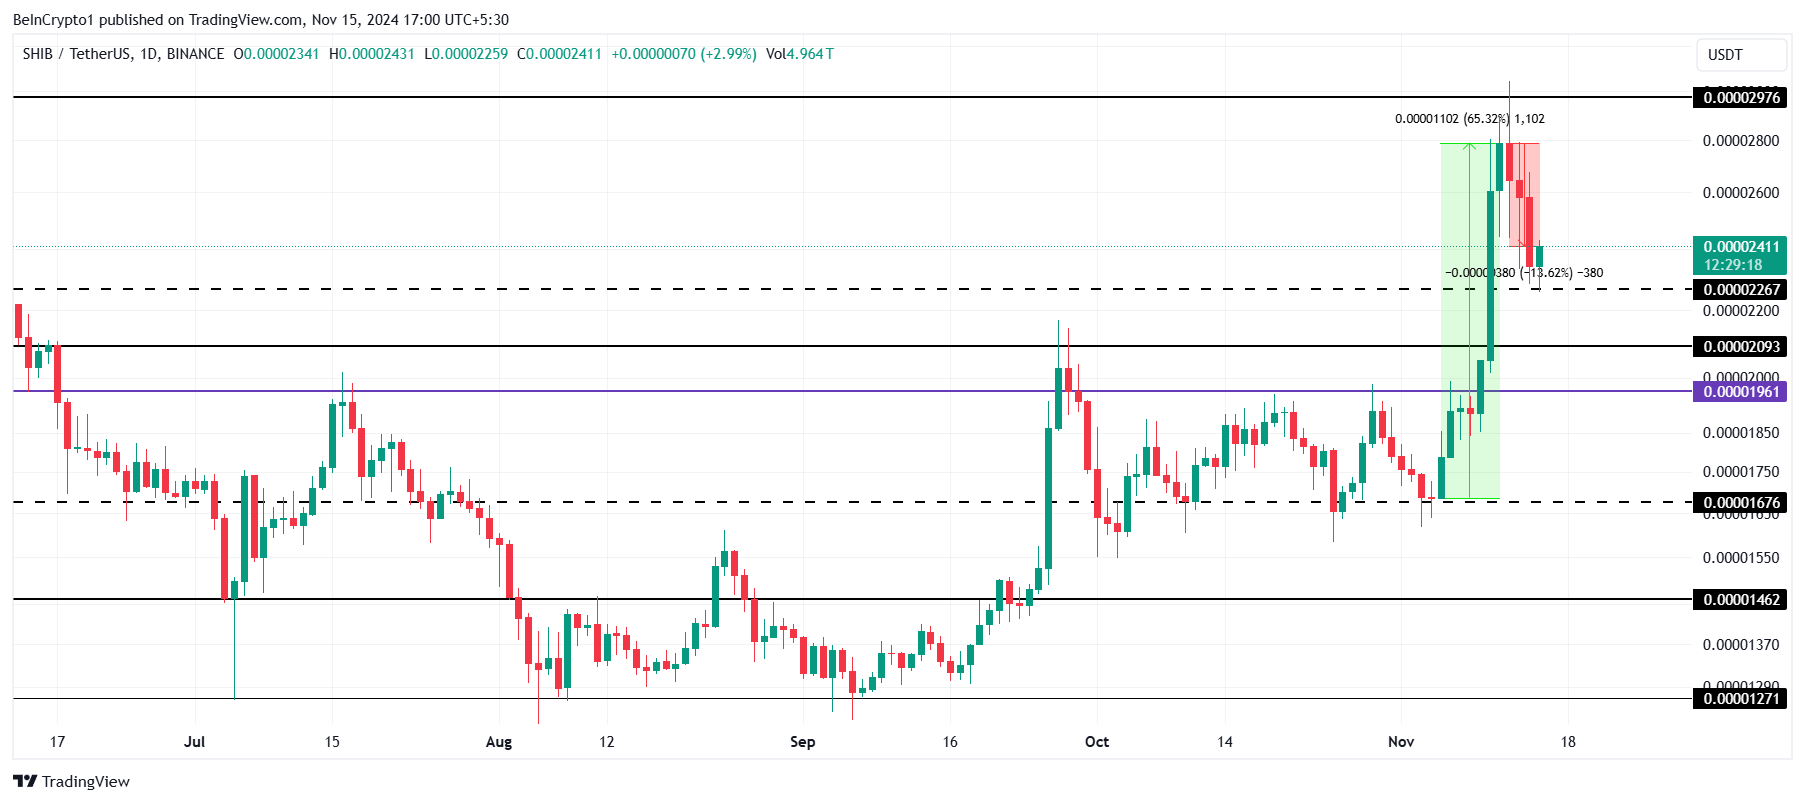
However, if SHIB fails to maintain this support level and slips below $0.00002267, the cryptocurrency could face further downward pressure. A break below this level would open the door for a potential drop to $0.00002093 or even lower, invalidating the current bullish outlook. Such a move would suggest that SHIB is in a more extended period of consolidation or bearish activity, especially if the selling pressure from LTHs continues.
Disclaimer
In line with the Trust Project guidelines, this price analysis article is for informational purposes only and should not be considered financial or investment advice. BeInCrypto is committed to accurate, unbiased reporting, but market conditions are subject to change without notice. Always conduct your own research and consult with a professional before making any financial decisions. Please note that our Terms and Conditions, Privacy Policy, and Disclaimers have been updated.
Market
Why the BRETT Token Price May Reclaim All-Time High?

Brett (BRETT) has bucked the general market trend in the past 24 hours. During that period, the meme coin’s value has risen by 10%, positioning itself as one of the top gainers among digital assets. It has outperformed leading assets like Bitcoin (BTC) and Ethereum (ETH), whose values have plunged by 4% and 5%, respectively.
With surging buying pressure, the BRETT token price may be on the path to reclaiming its all-time high of $0.19, which was last recorded in June.
Brett Leads Market Gains
BeInCrypto’s assessment of the BRETT/USD one-day chart reveals a spike in its on-balance volume (OBV). As of this writing, the meme coin’s OBV stands at 245.23 million, surging by over 130% in the past three days.
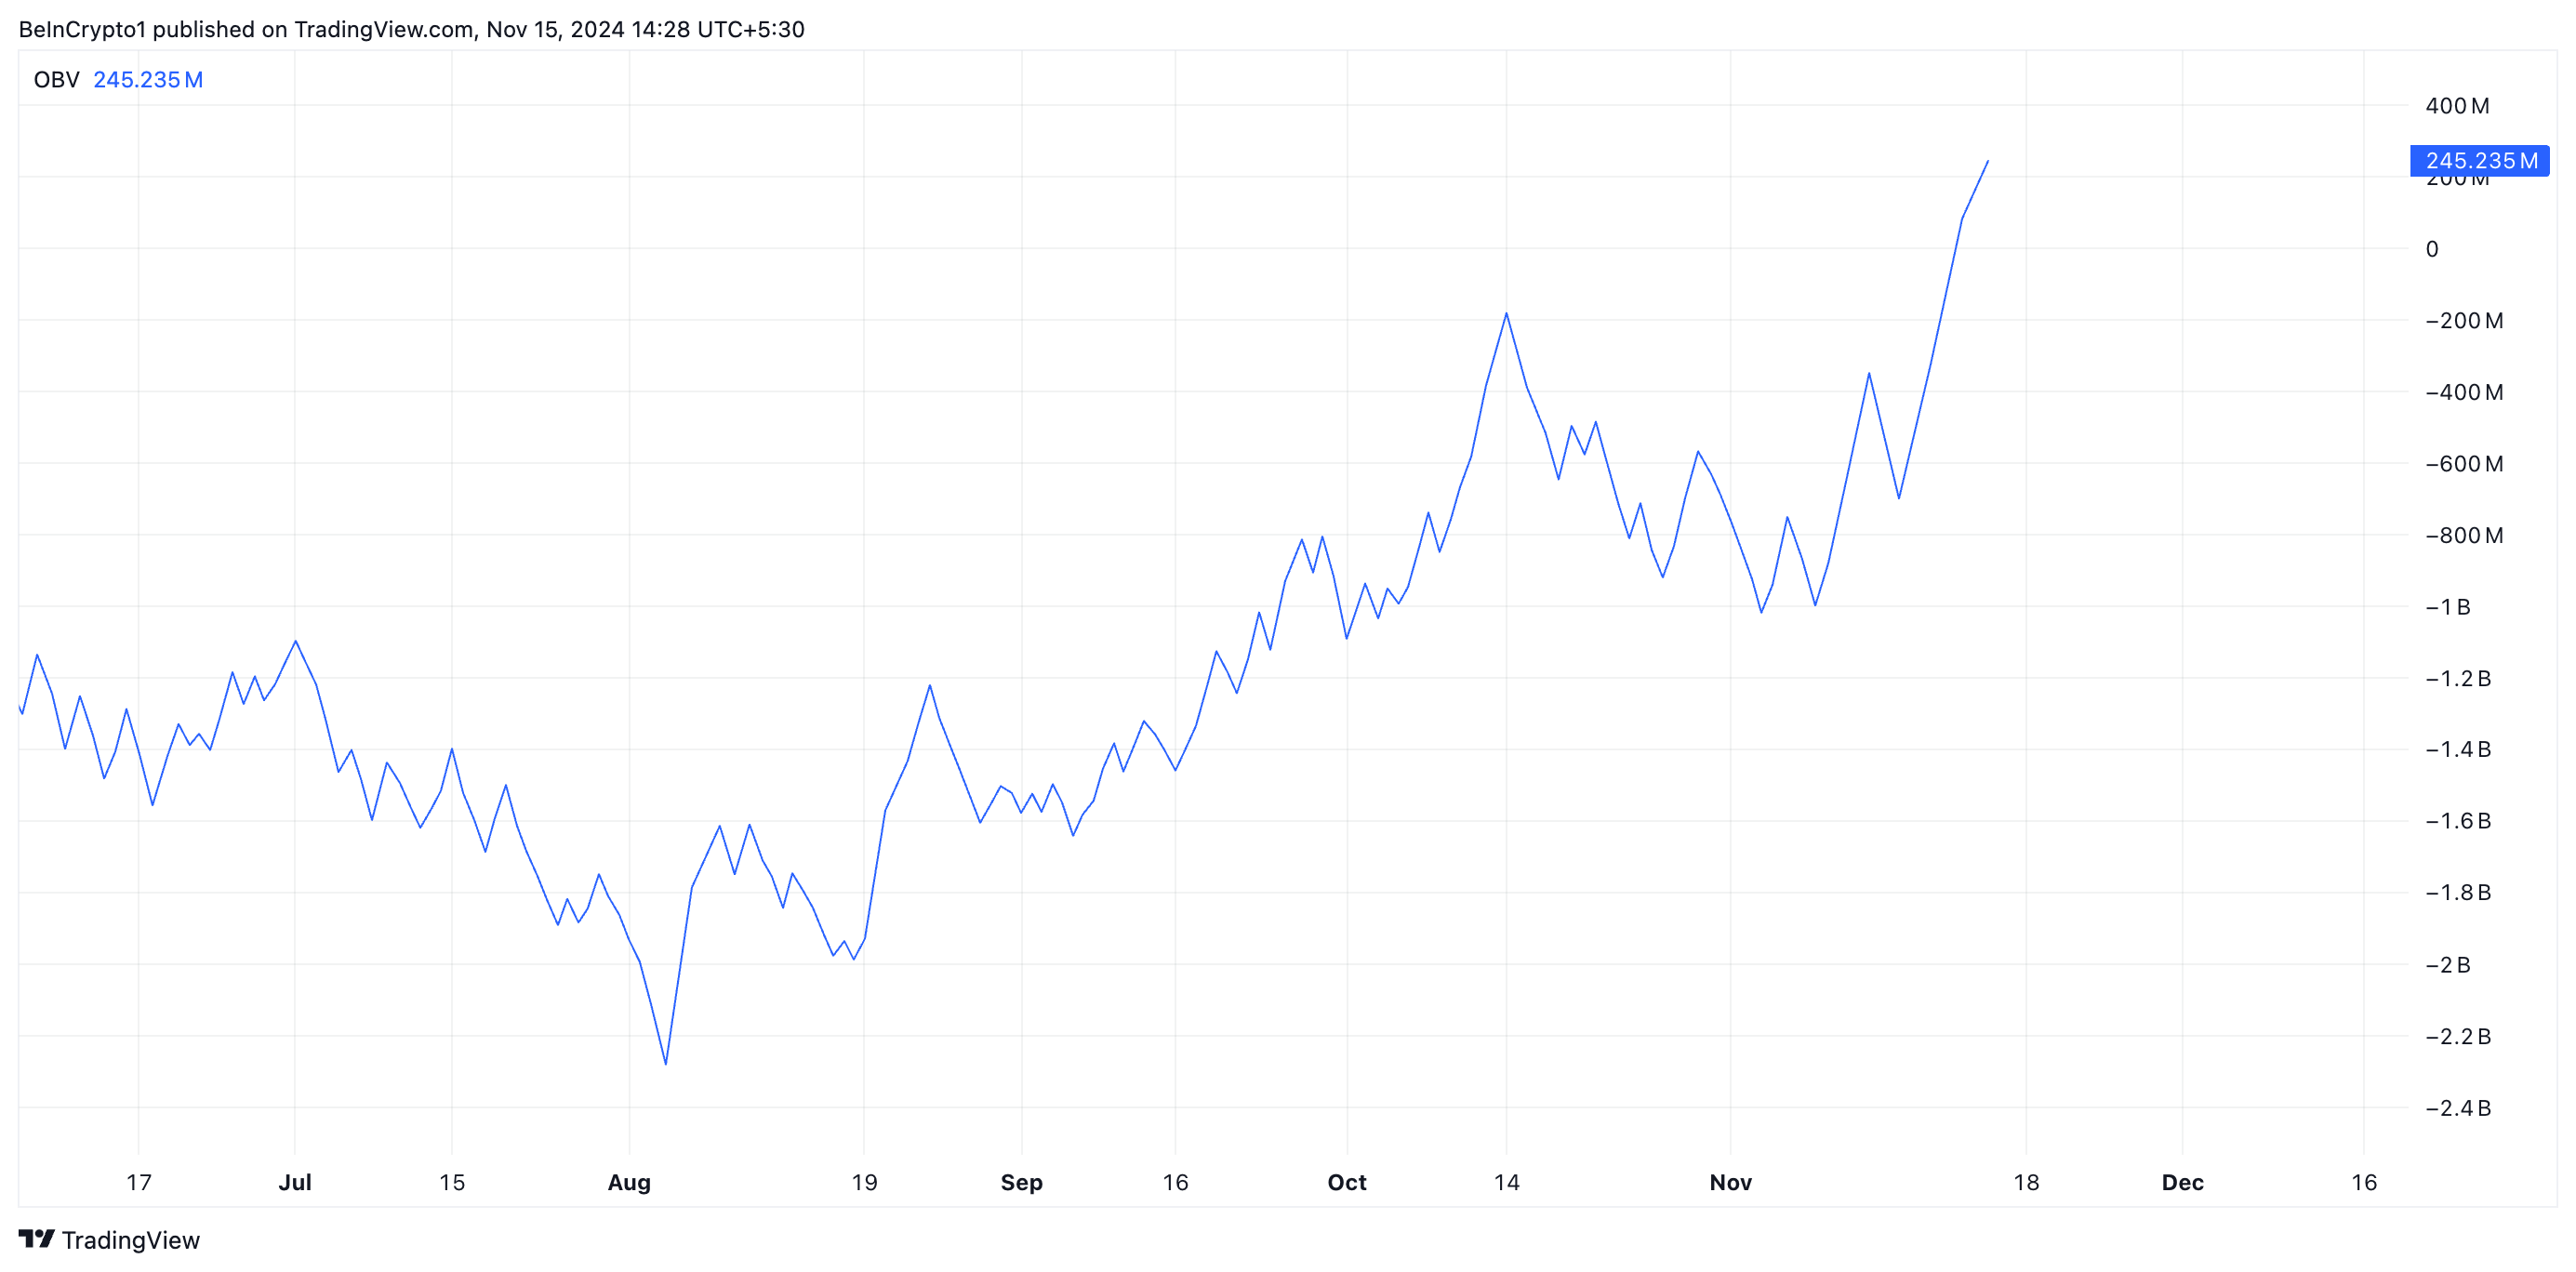
The OBV indicator measures buying and selling pressure in an asset by combining its price movements with its trading volume. When it increases during a price rally, it signals strong buying pressure. This means that the price rally is supported by high volume, making it more likely to continue.
Additionally, the setup of BRETT’s moving average convergence/divergence (MACD) indicator confirms the rising buying pressure in the market. As of this writing, the meme coin’s MACD line (blue) rests above its signal line (orange).
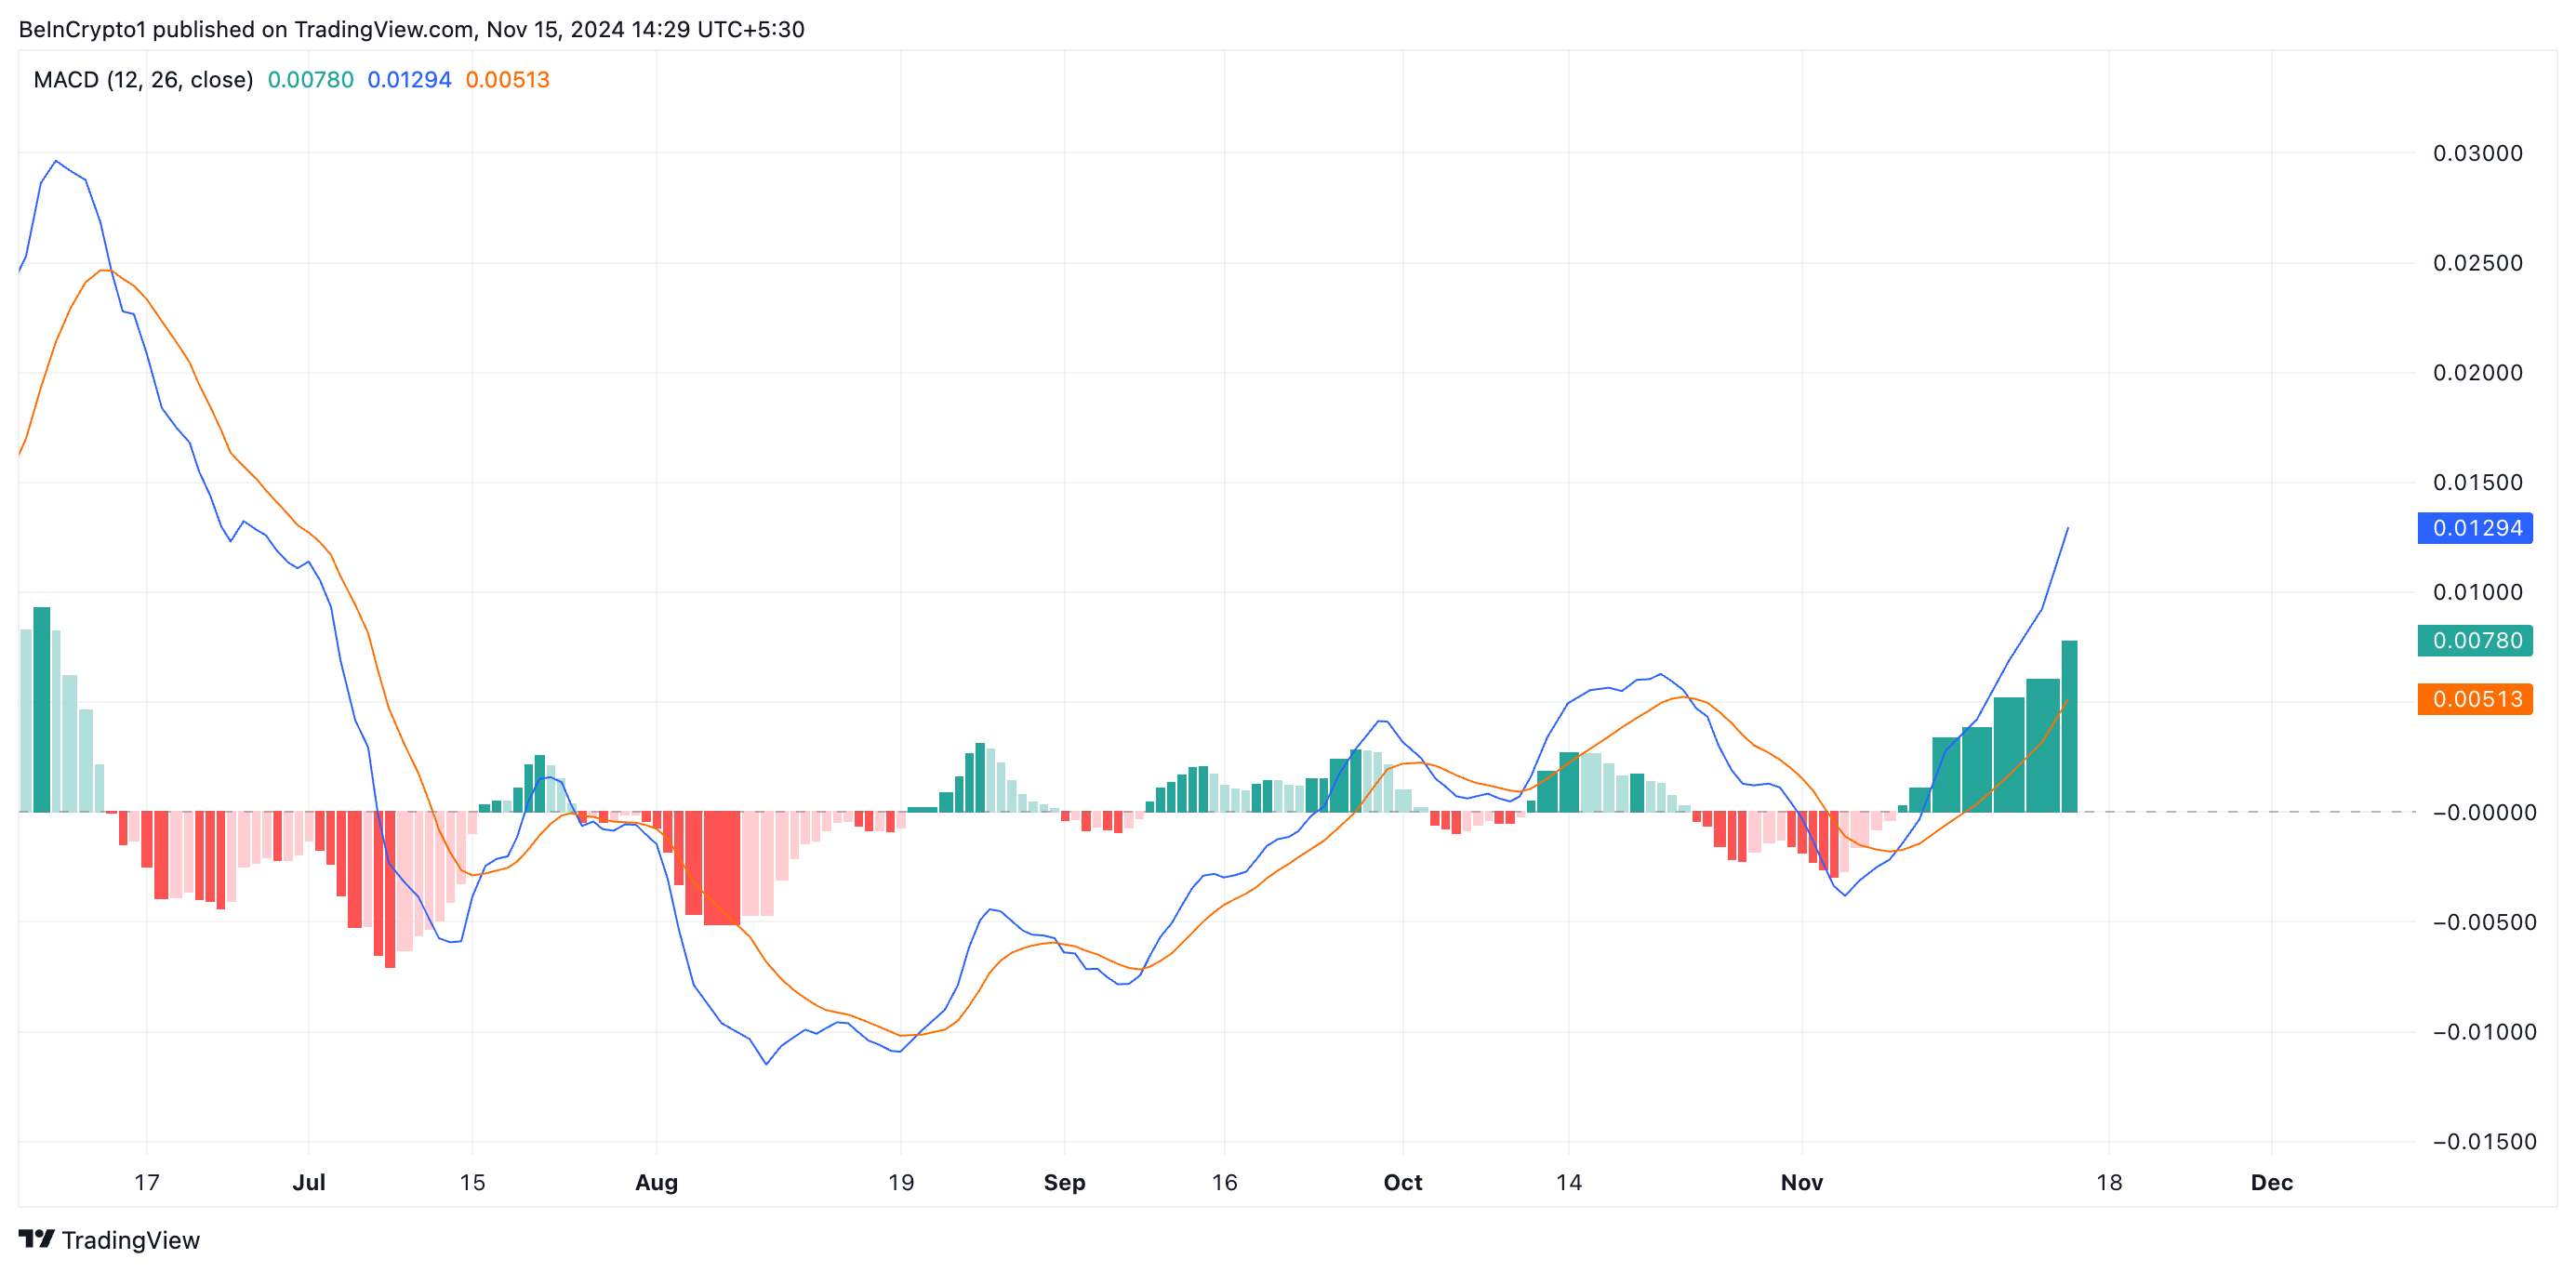
This indicator tracks an asset’s trend direction, shifts, and potential price reversal points. When the MACD line is above the signal line, it is bullish. It suggests that the asset’s short-term momentum is stronger than its long-term momentum.
Pseudonymous Crypto trader Crash also shares this bullish sentiment. In a November 14 X post, Crash noted that BRETT is poised to flip the Solana-based meme coin Dogwifhat (WIF) despite not being listed on Coinbase yet. According to the analyst, once BRETT gets listed, “it’s gonna shoot up and be trading at 2-6x Wif’s market cap.”
BRETT Price Prediction: One Of Two Things May Happen
BRETT is currently trading at $0.164, just shy of the $0.166 resistance level—its final hurdle before reclaiming the all-time high of $0.19. Sustained buying pressure could propel the meme coin beyond this critical threshold, setting the stage for a potential new peak.
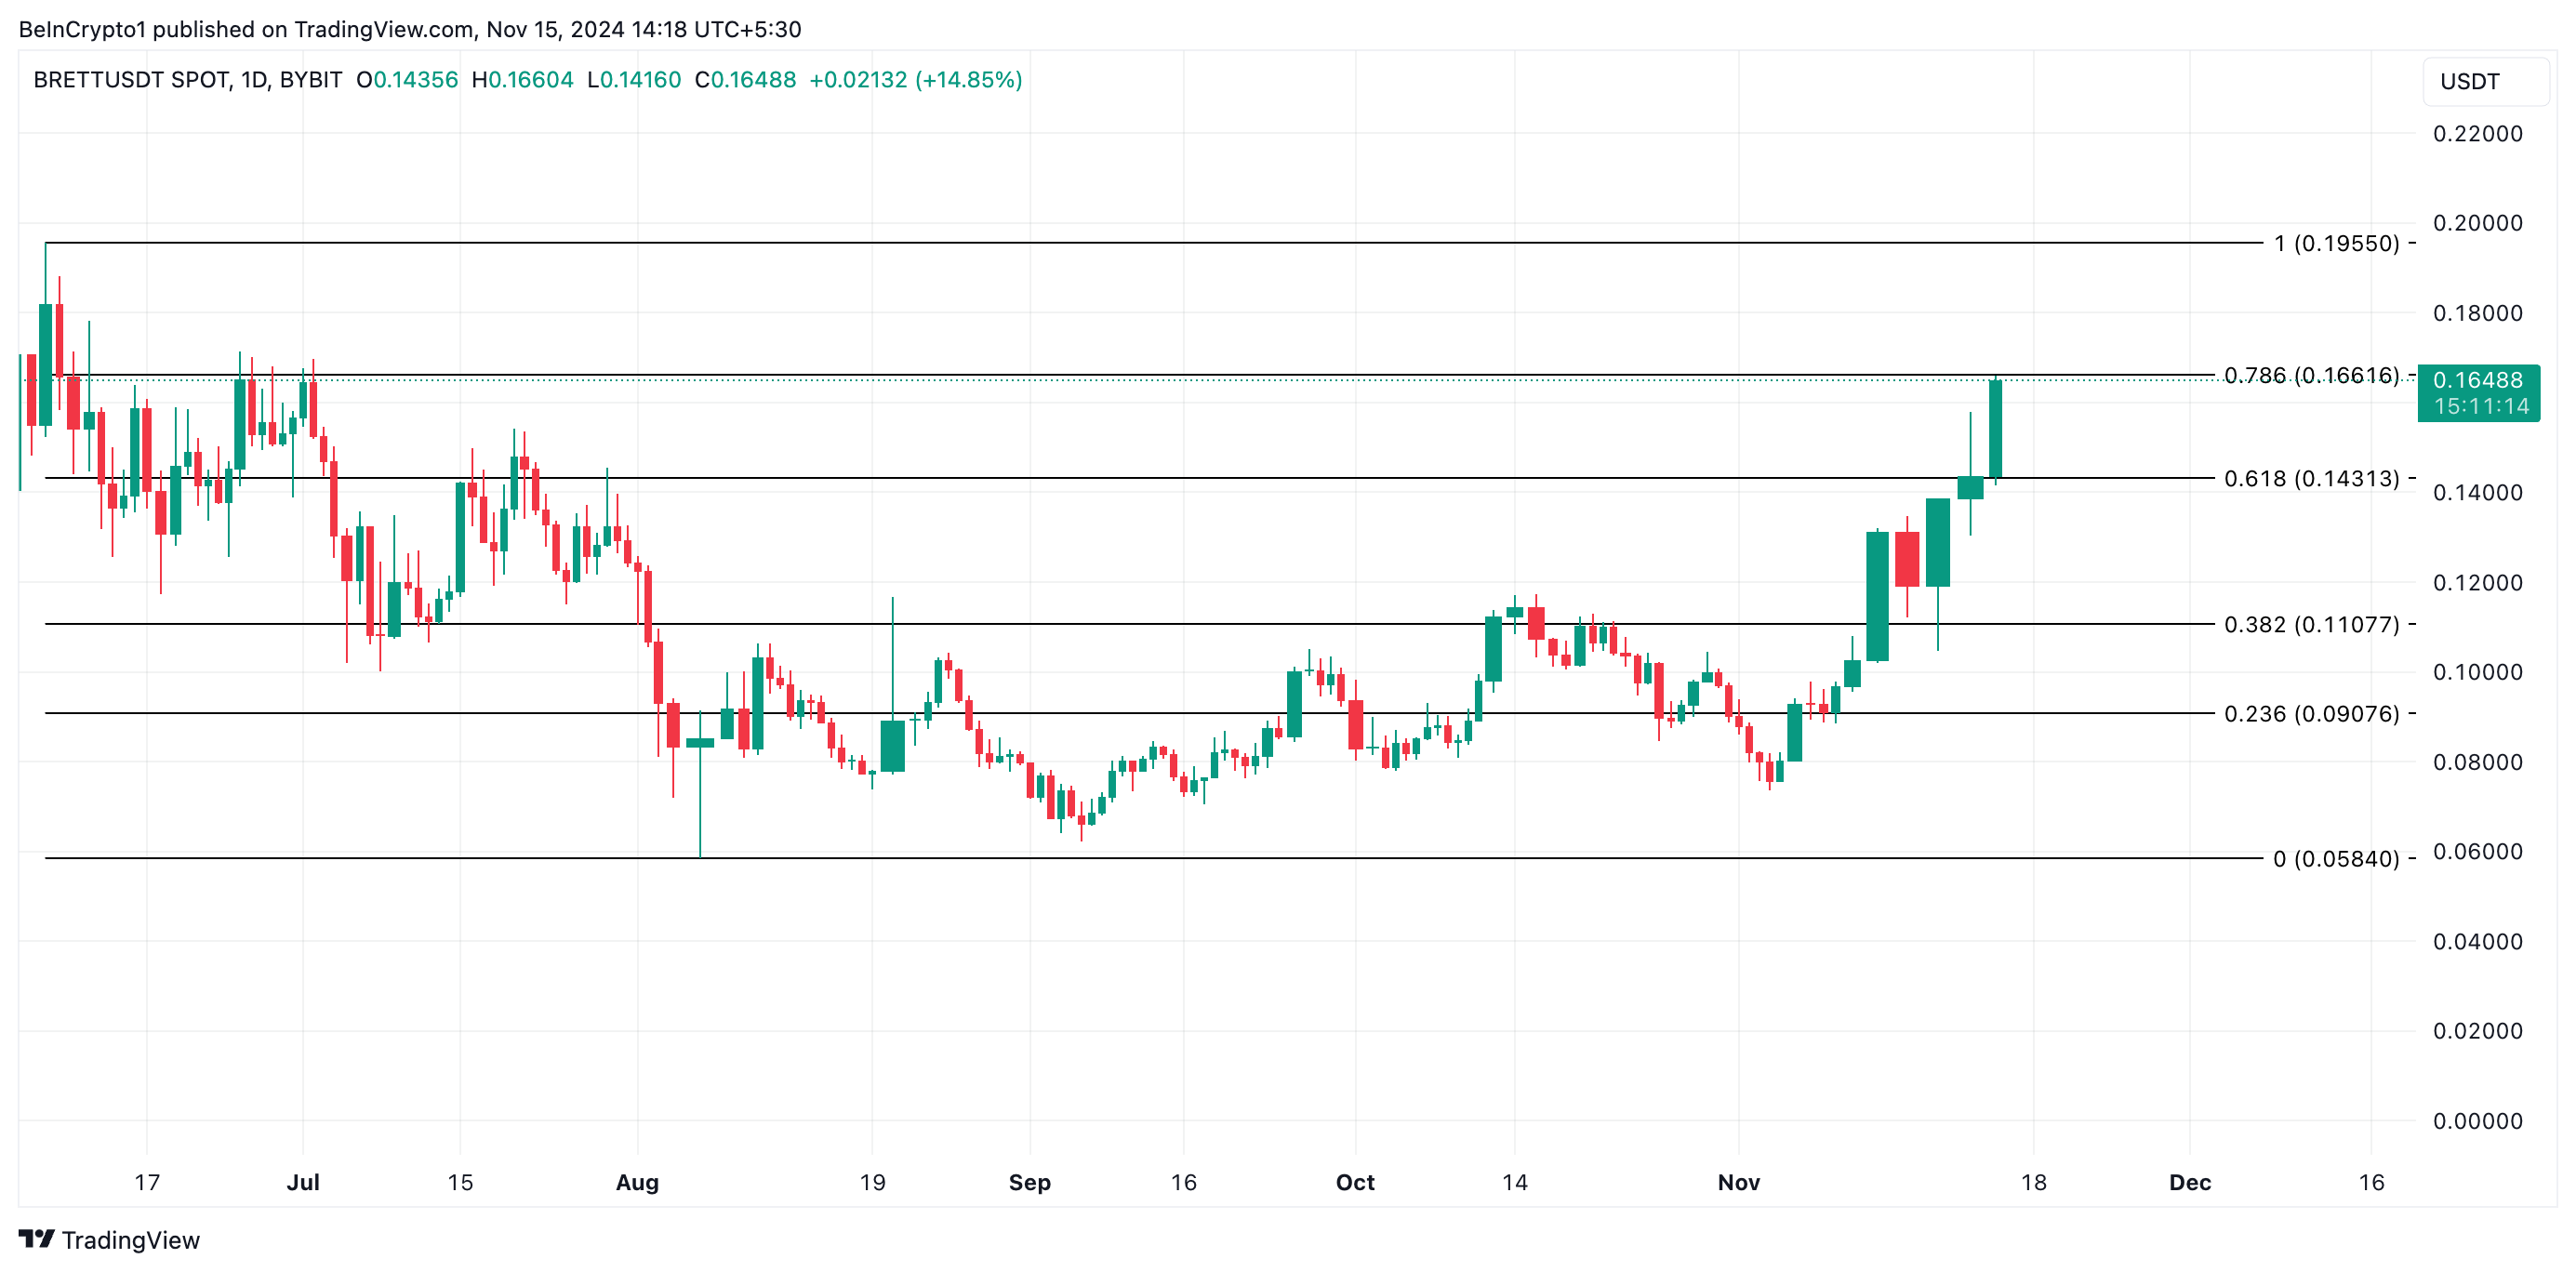
However, a shift in market sentiment or an increase in profit-taking could derail this bullish outlook. It can potentially drive the BRETT token price down toward the $0.143 support level.
Disclaimer
In line with the Trust Project guidelines, this price analysis article is for informational purposes only and should not be considered financial or investment advice. BeInCrypto is committed to accurate, unbiased reporting, but market conditions are subject to change without notice. Always conduct your own research and consult with a professional before making any financial decisions. Please note that our Terms and Conditions, Privacy Policy, and Disclaimers have been updated.
Market
ACT, PNUT And DOGE(GOV) Form New ATH

The past seven days were exhilarating for the crypto market as Bitcoin continued forming new ATH despite an exhausting bullish momentum. However, the dying momentum did not affect the meme coins which went on to post rallies as high as 3,000%.
BeInCrypto has analyzed three such meme coins that have risen significantly and, at the same time, formed new all-time highs.
Act I: The AI Prophecy (ACT)
ACT has soared as the top-performing meme coin this week, driven by its recent Binance listing. This milestone fueled a remarkable rally, with the cryptocurrency experiencing an unprecedented 3,000% surge over seven days, making it a standout in the market.
Currently trading at $0.74, ACT reached a new all-time high of $0.95 during its rally. The altcoin has established a solid support level at $0.60, signaling potential stability amidst the ongoing momentum, provided market conditions remain favorable.
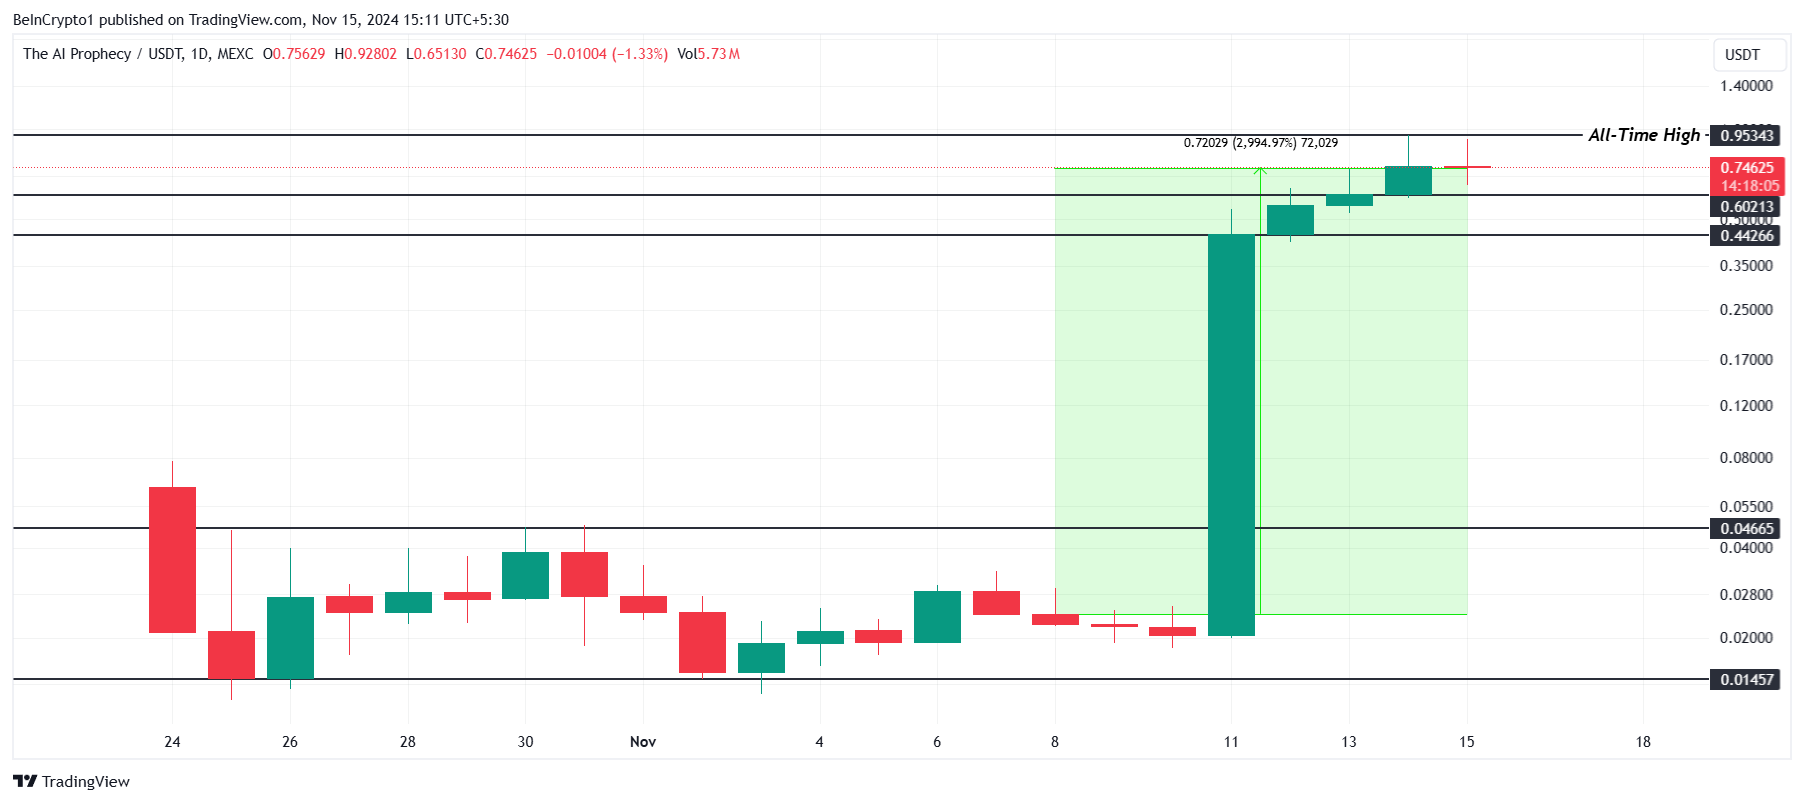
However, ACT’s hype-driven rally leaves it susceptible to corrections. Should investors opt to lock in profits, the meme coin could lose its $0.60 support and slip further to $0.44, challenging its recent gains and raising concerns about sustained growth.
Peanut the Squirrel (PNUT)
PNUT has emerged as one of the top-performing cryptocurrencies, surging by an astounding 1,579% over the past week. This incredible rally placed the meme coin among the top 100 crypto tokens, with its price currently trading at $1.91, drawing significant attention from investors and market watchers.
The impressive performance saw PNUT set multiple all-time highs this week, with the latest high recorded at $2.50. If the bullish momentum sustains, the meme coin could continue climbing, potentially setting new ATHs and further solidifying its position in the market.
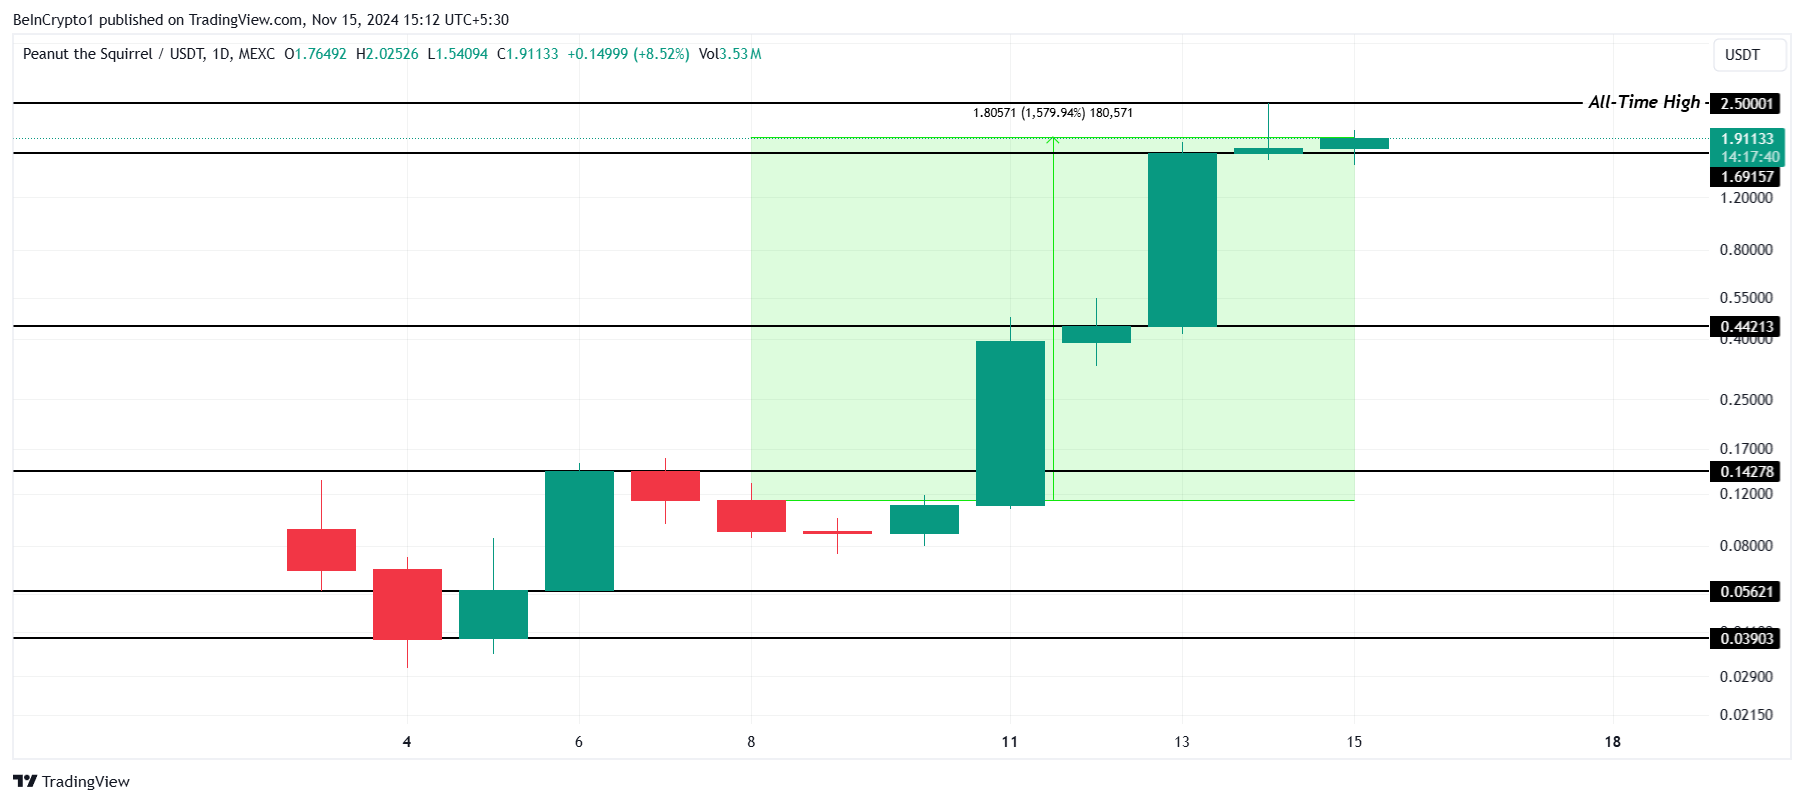
However, should PNUT lose the critical support level of $1.69, it may face a significant correction. Such a decline could pull the price down to $0.44, erasing recent gains and invalidating the current bullish outlook.
Department Of Government Efficiency [DOGE(GOV)]
DOGE(GOV) price surged by an impressive 244% over the past week, marking an all-time high of $0.545. After facing minor corrections, the meme coin is now trading at $0.353, with investor sentiment showing mixed signals about its short-term trajectory.
The altcoin maintains support at $0.161, providing a safety net amid potential profit-taking by investors. However, if selling pressure escalates, DOGE(GOV) could experience a sharp decline, potentially dropping to $0.049. Such a drop would erase much of the recent gains, increasing bearish momentum.
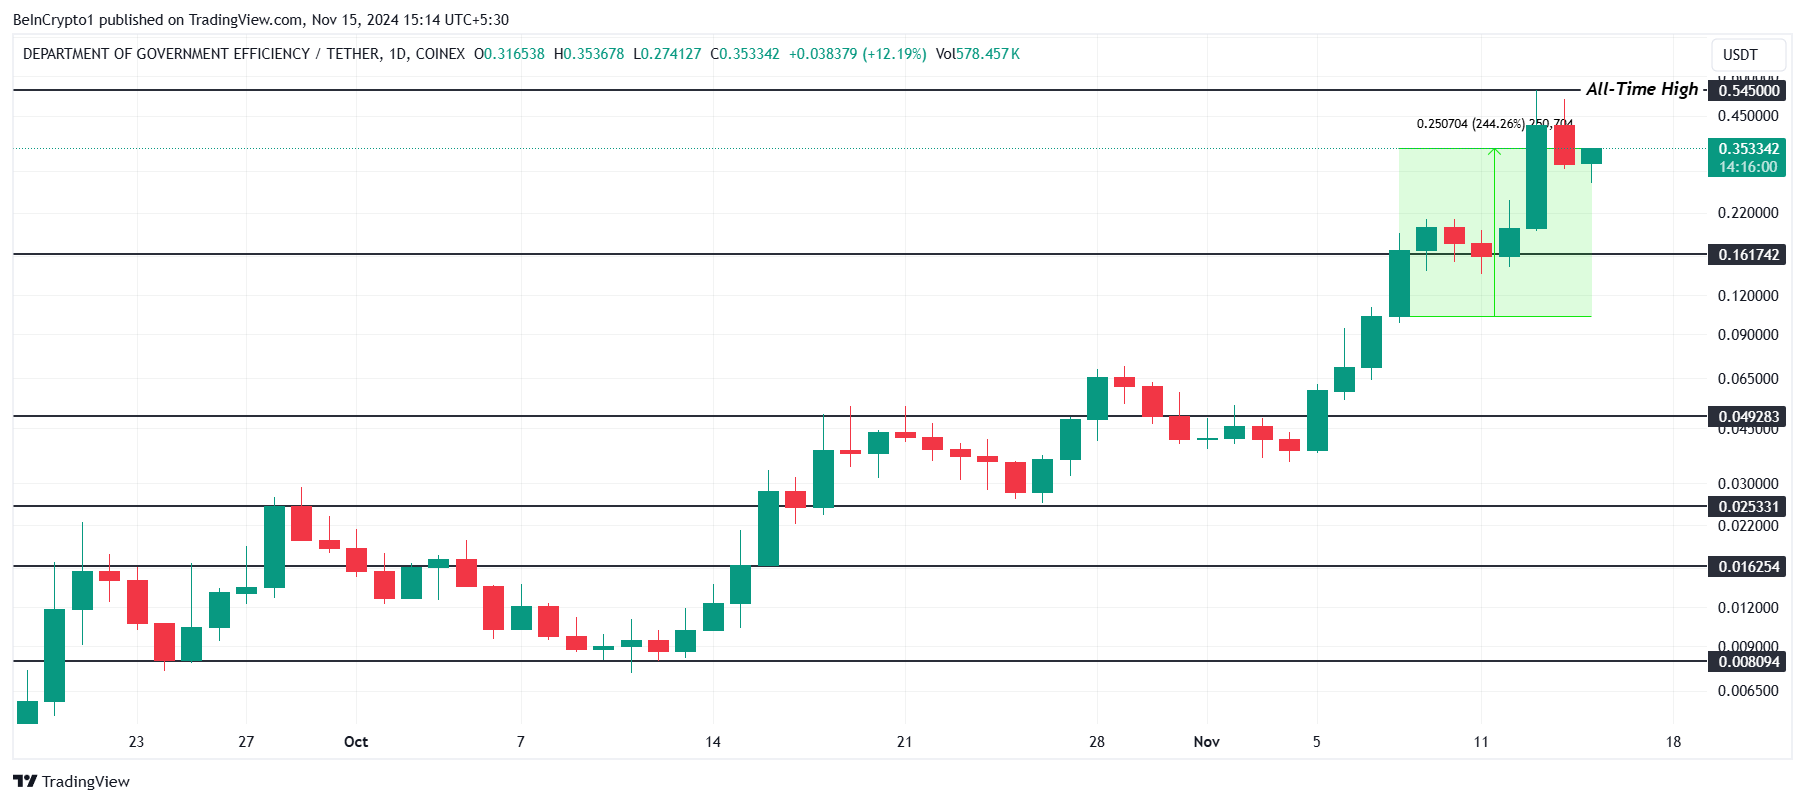
On the other hand, if DOGE(GOV) holds above the $0.161 support level, it could regain upward momentum. Successfully sustaining this level might allow the meme coin to revisit its all-time high of $0.545, invalidating the bearish outlook and paving the way for further gains.
Disclaimer
In line with the Trust Project guidelines, this price analysis article is for informational purposes only and should not be considered financial or investment advice. BeInCrypto is committed to accurate, unbiased reporting, but market conditions are subject to change without notice. Always conduct your own research and consult with a professional before making any financial decisions. Please note that our Terms and Conditions, Privacy Policy, and Disclaimers have been updated.
-

 Market14 hours ago
Uniswap (UNI) Price Vulnerable to Further Downside Pressure
-

 Market5 hours ago
Crypto fear and greed rises as investors turn to Vantard
-

 Market24 hours ago
XRP Token Price Hits $0.75 – Can the Rally Continue?
-

 Altcoin24 hours ago
Dogecoin Eyes Parabolic Rally To Price Discovery, Is The 16,000% Surge From 2020 Possible This Time?
-

 Market23 hours ago
Tether Injects $7 Billion into the Market in Six Days
-

 Altcoin23 hours ago
Donald Trump’s World Liberty Financial Taps Chainlink To Boost DeFi Offering
-

 Regulation23 hours ago
Gary Gensler Reaffirms Crypto Regulatory Stance Amid Resignation Calls
-

 Bitcoin15 hours ago
Bhutan Bitcoin Sales Hit $100 Million As BTC Drops Below $90,000


