Market
XRP Price Gains Steadily with Swings: Can It Maintain Momentum?
Aayush Jindal, a luminary in the world of financial markets, whose expertise spans over 15 illustrious years in the realms of Forex and cryptocurrency trading. Renowned for his unparalleled proficiency in providing technical analysis, Aayush is a trusted advisor and senior market expert to investors worldwide, guiding them through the intricate landscapes of modern finance with his keen insights and astute chart analysis.
From a young age, Aayush exhibited a natural aptitude for deciphering complex systems and unraveling patterns. Fueled by an insatiable curiosity for understanding market dynamics, he embarked on a journey that would lead him to become one of the foremost authorities in the fields of Forex and crypto trading. With a meticulous eye for detail and an unwavering commitment to excellence, Aayush honed his craft over the years, mastering the art of technical analysis and chart interpretation.
As a software engineer, Aayush harnesses the power of technology to optimize trading strategies and develop innovative solutions for navigating the volatile waters of financial markets. His background in software engineering has equipped him with a unique skill set, enabling him to leverage cutting-edge tools and algorithms to gain a competitive edge in an ever-evolving landscape.
In addition to his roles in finance and technology, Aayush serves as the director of a prestigious IT company, where he spearheads initiatives aimed at driving digital innovation and transformation. Under his visionary leadership, the company has flourished, cementing its position as a leader in the tech industry and paving the way for groundbreaking advancements in software development and IT solutions.
Despite his demanding professional commitments, Aayush is a firm believer in the importance of work-life balance. An avid traveler and adventurer, he finds solace in exploring new destinations, immersing himself in different cultures, and forging lasting memories along the way. Whether he’s trekking through the Himalayas, diving in the azure waters of the Maldives, or experiencing the vibrant energy of bustling metropolises, Aayush embraces every opportunity to broaden his horizons and create unforgettable experiences.
Aayush’s journey to success is marked by a relentless pursuit of excellence and a steadfast commitment to continuous learning and growth. His academic achievements are a testament to his dedication and passion for excellence, having completed his software engineering with honors and excelling in every department.
At his core, Aayush is driven by a profound passion for analyzing markets and uncovering profitable opportunities amidst volatility. Whether he’s poring over price charts, identifying key support and resistance levels, or providing insightful analysis to his clients and followers, Aayush’s unwavering dedication to his craft sets him apart as a true industry leader and a beacon of inspiration to aspiring traders around the globe.
In a world where uncertainty reigns supreme, Aayush Jindal stands as a guiding light, illuminating the path to financial success with his unparalleled expertise, unwavering integrity, and boundless enthusiasm for the markets.
Market
FET Price Underperforms in Competitive AI Crypto Space

FET price has been underperforming compared to its closest competitors over the past week, down more than 8%. Despite being the second-largest AI cryptocurrency by market cap, it has struggled to keep pace with other major players in the sector.
While its competitors have seen impressive gains, FET has lagged behind, raising concerns about its ability to maintain its position. This recent underperformance puts its standing in the market at risk, especially as other AI coins continue to show strong momentum.
Is FET Lagging Behind Other AI Coins?
FET is currently the second-largest Artificial Intelligence coin by market cap, trailing behind TAO. It also ranks second in weekly trading volume, just behind WLD. However, in terms of performance, FET has fallen behind its competitors over the past week, with its price down by 8.16%.
This is significantly lower compared to the impressive gains seen by its peers, such as RNDR, with a 39.14% increase, and WLD, with 17.5%.
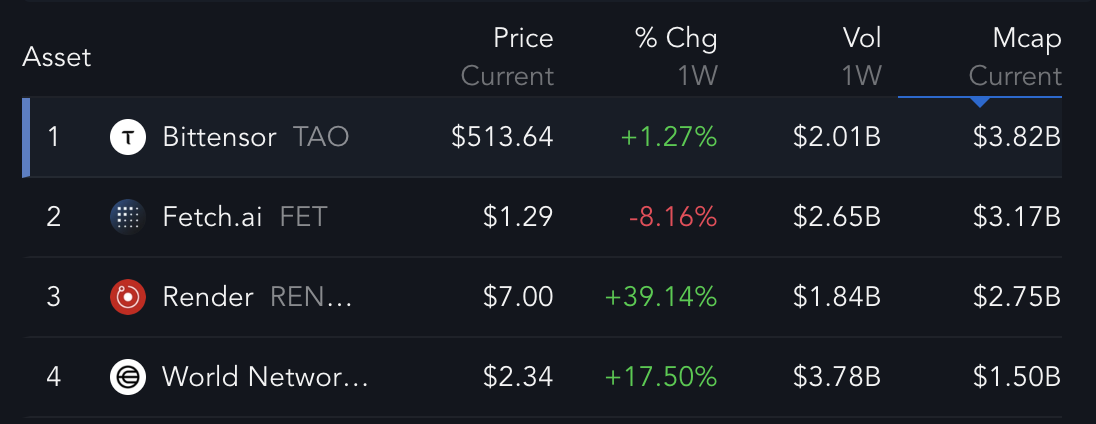
These recent figures suggest that FET could be losing momentum in the AI cryptocurrency race, putting its status as the second-largest AI coin at risk.
If RNDR continues to rise by just 15% more and FET remains stable, their market caps would be equal, potentially leading to a shift in the rankings.
FET Whales Decreased In The Past Week
The number of addresses holding between 1,000,000 and 10,000,000 FET currently stands at 149, down from 153 on November 3. From that day until November 9, this figure declined consistently, bottoming out at 147.
Tracking the activity of these whale addresses is crucial, as they often significantly influence price movements.
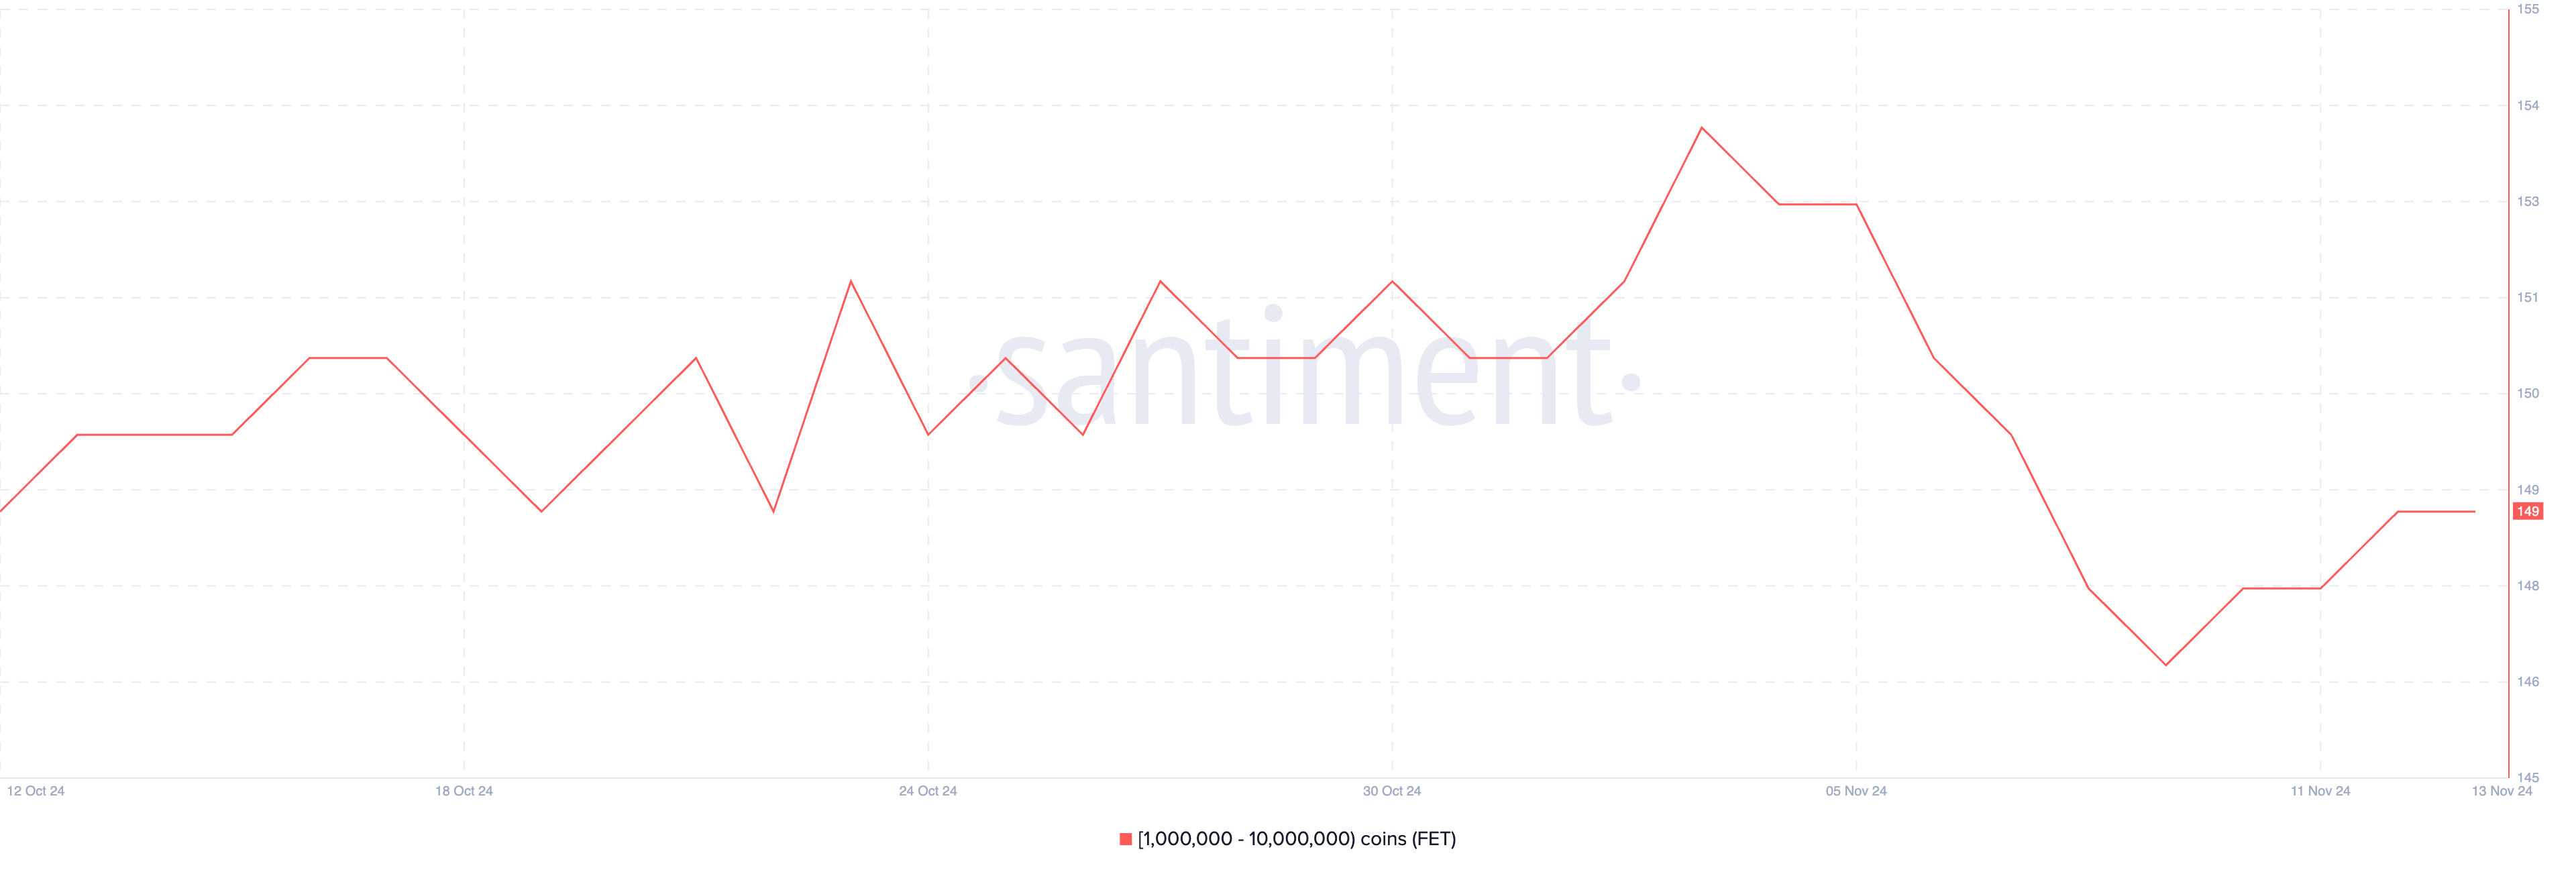
While the number of FET whales has recovered slightly from 147 to 149 over the last five days, it remains below the level seen in early November. This indicates that large holders might still be cautious, and the full confidence seen previously hasn’t yet returned.
Although there has been a modest recovery, the reduced whale activity may suggest lingering uncertainty or hesitation, which could affect FET’s price stability and future performance in the short term.
FET Price Prediction: A Possible 16% Correction
The chart for FET price is showing signs of caution, with its EMA lines suggesting potential bearish pressure. The short-term EMA has dropped significantly over the past few days and is close to crossing below the long-term EMA.
If this happens, it will form a “death cross,” a bearish signal indicating a possible shift toward a downtrend.
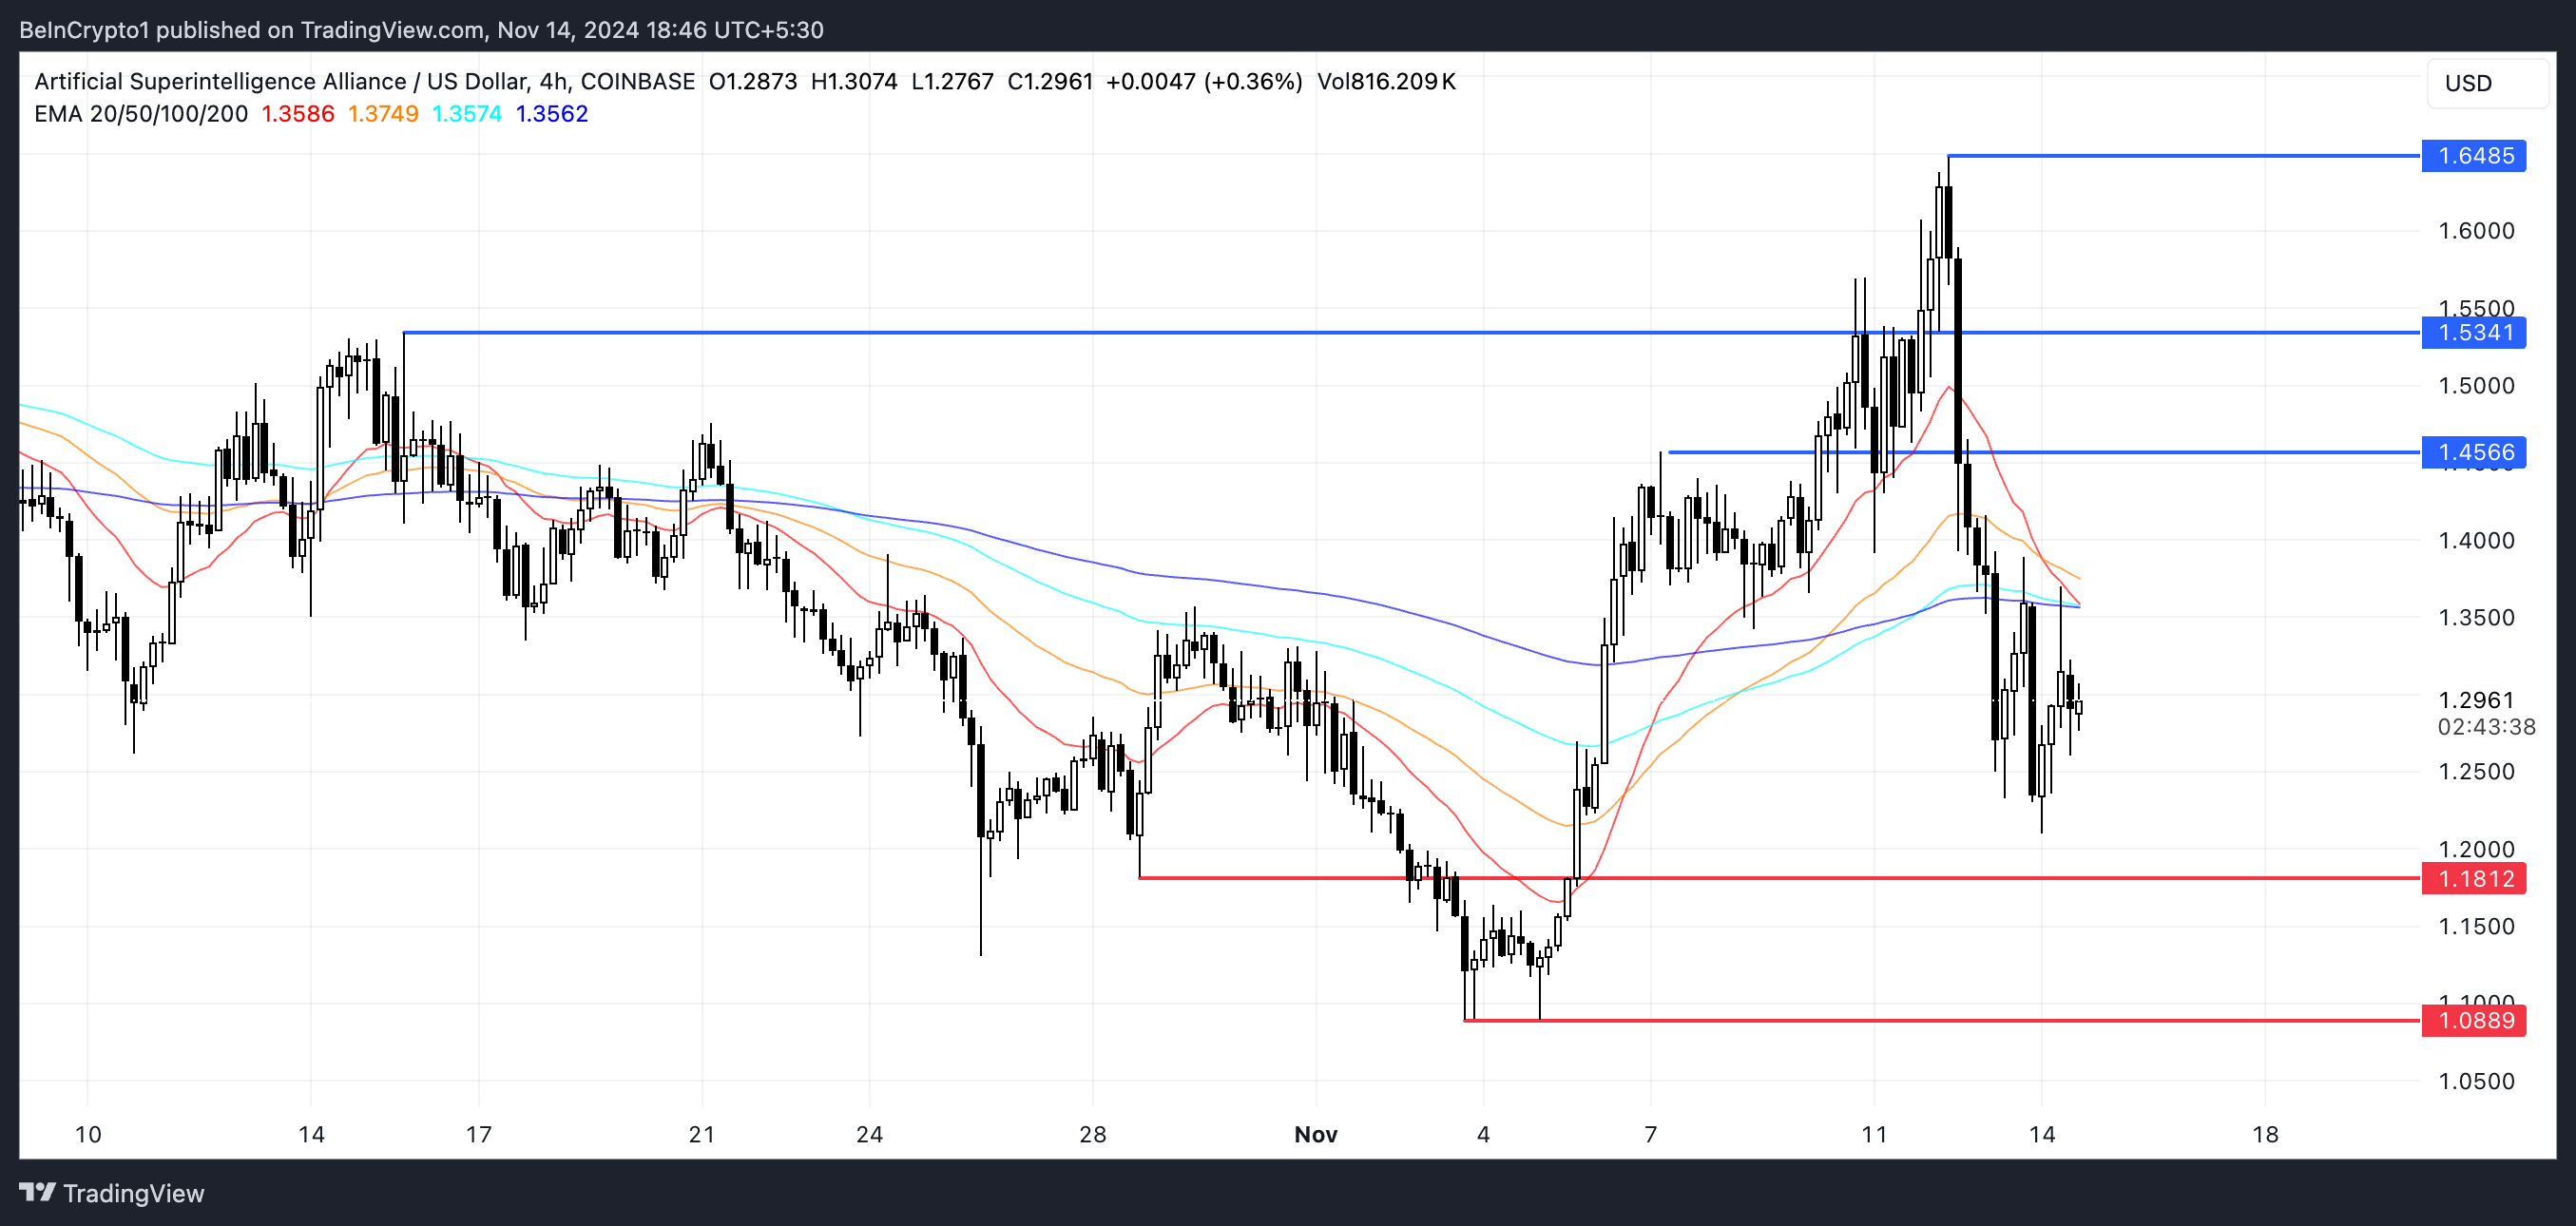
If the death cross occurs, FET could test its nearest support at $1.18. If this level fails, the price could drop to $1.08, representing a potential 16% correction.
However, if momentum shifts positively, FET price may challenge resistances at $1.45 and $1.53. Breaking these levels could see it rise to $1.64, offering a potential 35% price increase.
Disclaimer
In line with the Trust Project guidelines, this price analysis article is for informational purposes only and should not be considered financial or investment advice. BeInCrypto is committed to accurate, unbiased reporting, but market conditions are subject to change without notice. Always conduct your own research and consult with a professional before making any financial decisions. Please note that our Terms and Conditions, Privacy Policy, and Disclaimers have been updated.
Market
Bitcoin (BTC) Price Eyes $100,000 After Breaking All-Time Highs

Bitcoin’s (BTC) price has surged by 21.70% over the past seven days, repeatedly reaching new all-time highs. Currently, BTC is roughly 10% below the $100,000 milestone, with the uptrend showing exceptional strength, as indicated by technical markers like the DMI and EMA lines.
With market sentiment shifting into a phase of growing confidence but not yet reaching euphoria, there is still room for growth before potential corrections. However, while momentum remains positive, traders should stay cautious of possible retracements as Bitcoin moves toward this significant milestone.
Bitcoin’s Current Uptrend Is Very Strong
The BTC DMI chart highlights Bitcoin’s strong uptrend. The Average Directional Index (ADX) is currently at 48, signaling significant trend strength. The ADX is a tool that measures how strong a trend is—values above 25 suggest a strong trend and anything above 40 is considered very strong.
A few days ago, the ADX was nearing 60, indicating that the uptrend was even more powerful then.

The Directional Movement Index (+DI and -DI) further clarifies this trend’s direction. With +DI at 30.37, the data indicates a prevailing upward movement, while the -DI at 13.67 suggests weaker selling pressure. This combination shows that buyers currently have a firm upper hand over sellers, reinforcing Bitcoin’s bullish momentum.
The difference between these values supports the overall strength of the current uptrend, suggesting that bullish forces are still dominating the market despite the recent surge.
Bitcoin NUPL Is Still Far From Euphoria
Bitcoin’s NUPL (Net Unrealized Profit/Loss) metric currently sits at 0.62, placing it in the “Belief – Denial” stage. NUPL measures the total unrealized profit or loss of all Bitcoin holders, helping to identify the broader sentiment in the market.
At 0.62, market sentiment has moved from cautious belief to growing confidence but not yet reaching extreme optimism.
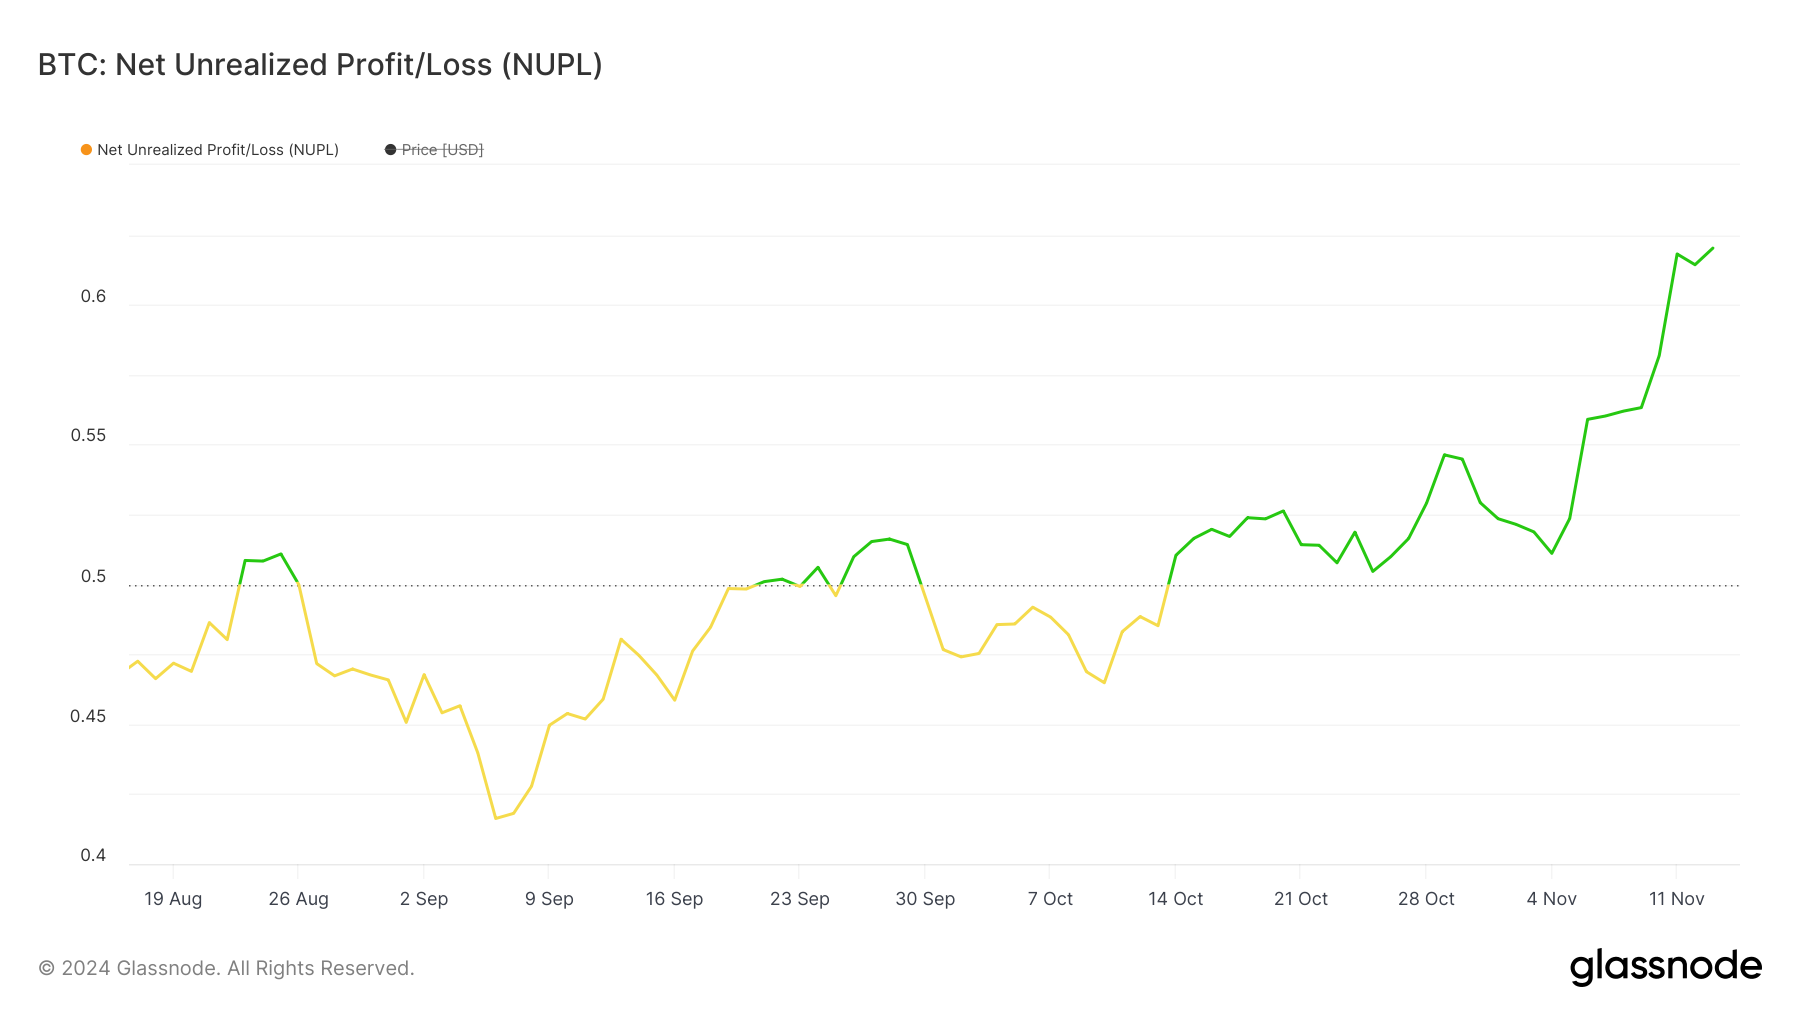
Despite being in the “Belief – Denial” stage, the NUPL level is still significantly below 0.7, the threshold for “Euphoria – Greed.” Historically, this next level has marked a period when Bitcoin often faces strong corrections as market sentiment shifts toward unsustainable greed.
With the current NUPL value below this critical threshold, the BTC price can still grow before reaching levels typically associated with overheating.
BTC Price Prediction: Will BTC Reach $100,000 In November?
Bitcoin’s EMA lines are currently showing a very strong bullish setup, with the price sitting above all of them and short-term EMAs positioned above the long-term ones.
This alignment is a classic indicator of a well-supported uptrend, suggesting that momentum is in favor of further gains.
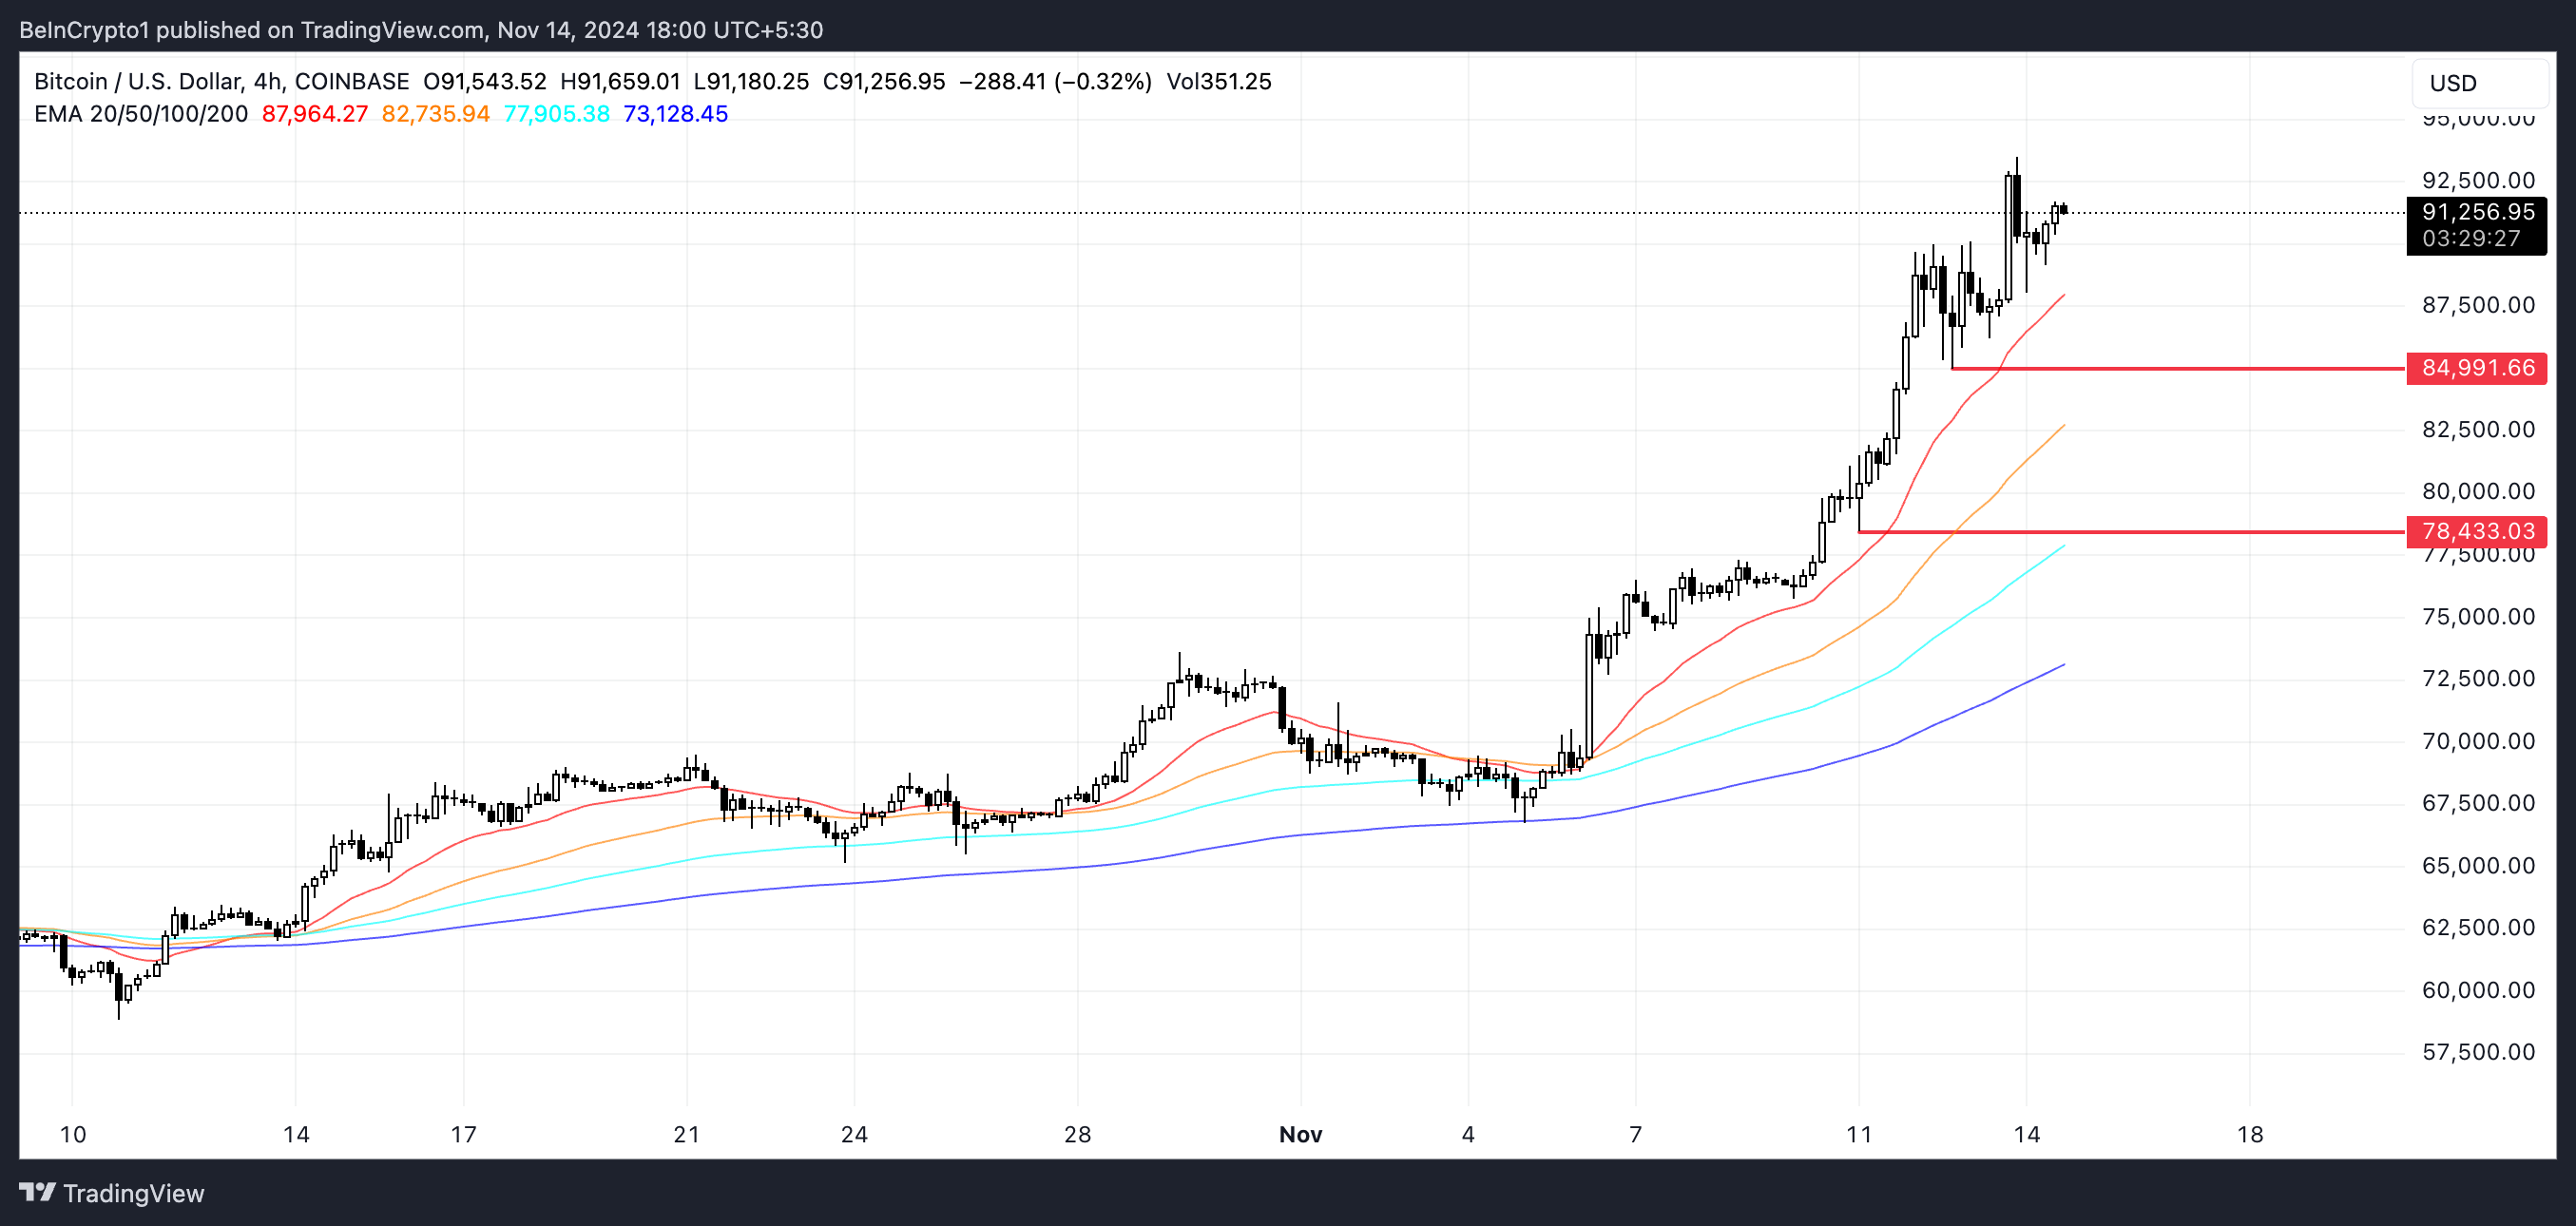
BTC’s price is also just roughly 10% below the historic $100,000 mark, and, given the trend’s current strength and supportive metrics like NUPL, reaching this milestone seems possible in the near future. However, corrections are always possible before a new all-time high is established.
If the trend loses strength, Bitcoin price could face a retracement, potentially testing key support levels at $85,000 and $78,400.
Disclaimer
In line with the Trust Project guidelines, this price analysis article is for informational purposes only and should not be considered financial or investment advice. BeInCrypto is committed to accurate, unbiased reporting, but market conditions are subject to change without notice. Always conduct your own research and consult with a professional before making any financial decisions. Please note that our Terms and Conditions, Privacy Policy, and Disclaimers have been updated.
Market
Will Dogecoin (DOGE) Price Hold Above $0.35?
The price of the leading meme coin, Dogecoin (DOGE), has recently witnessed a meteoric rise. Rallying by 111% over the past week, the coin currently trades at a three-year high of $0.40.
However, technical indicators suggest that the rally may be losing momentum, and a potential pullback could be on the horizon.
Dogecoin Is Overbought
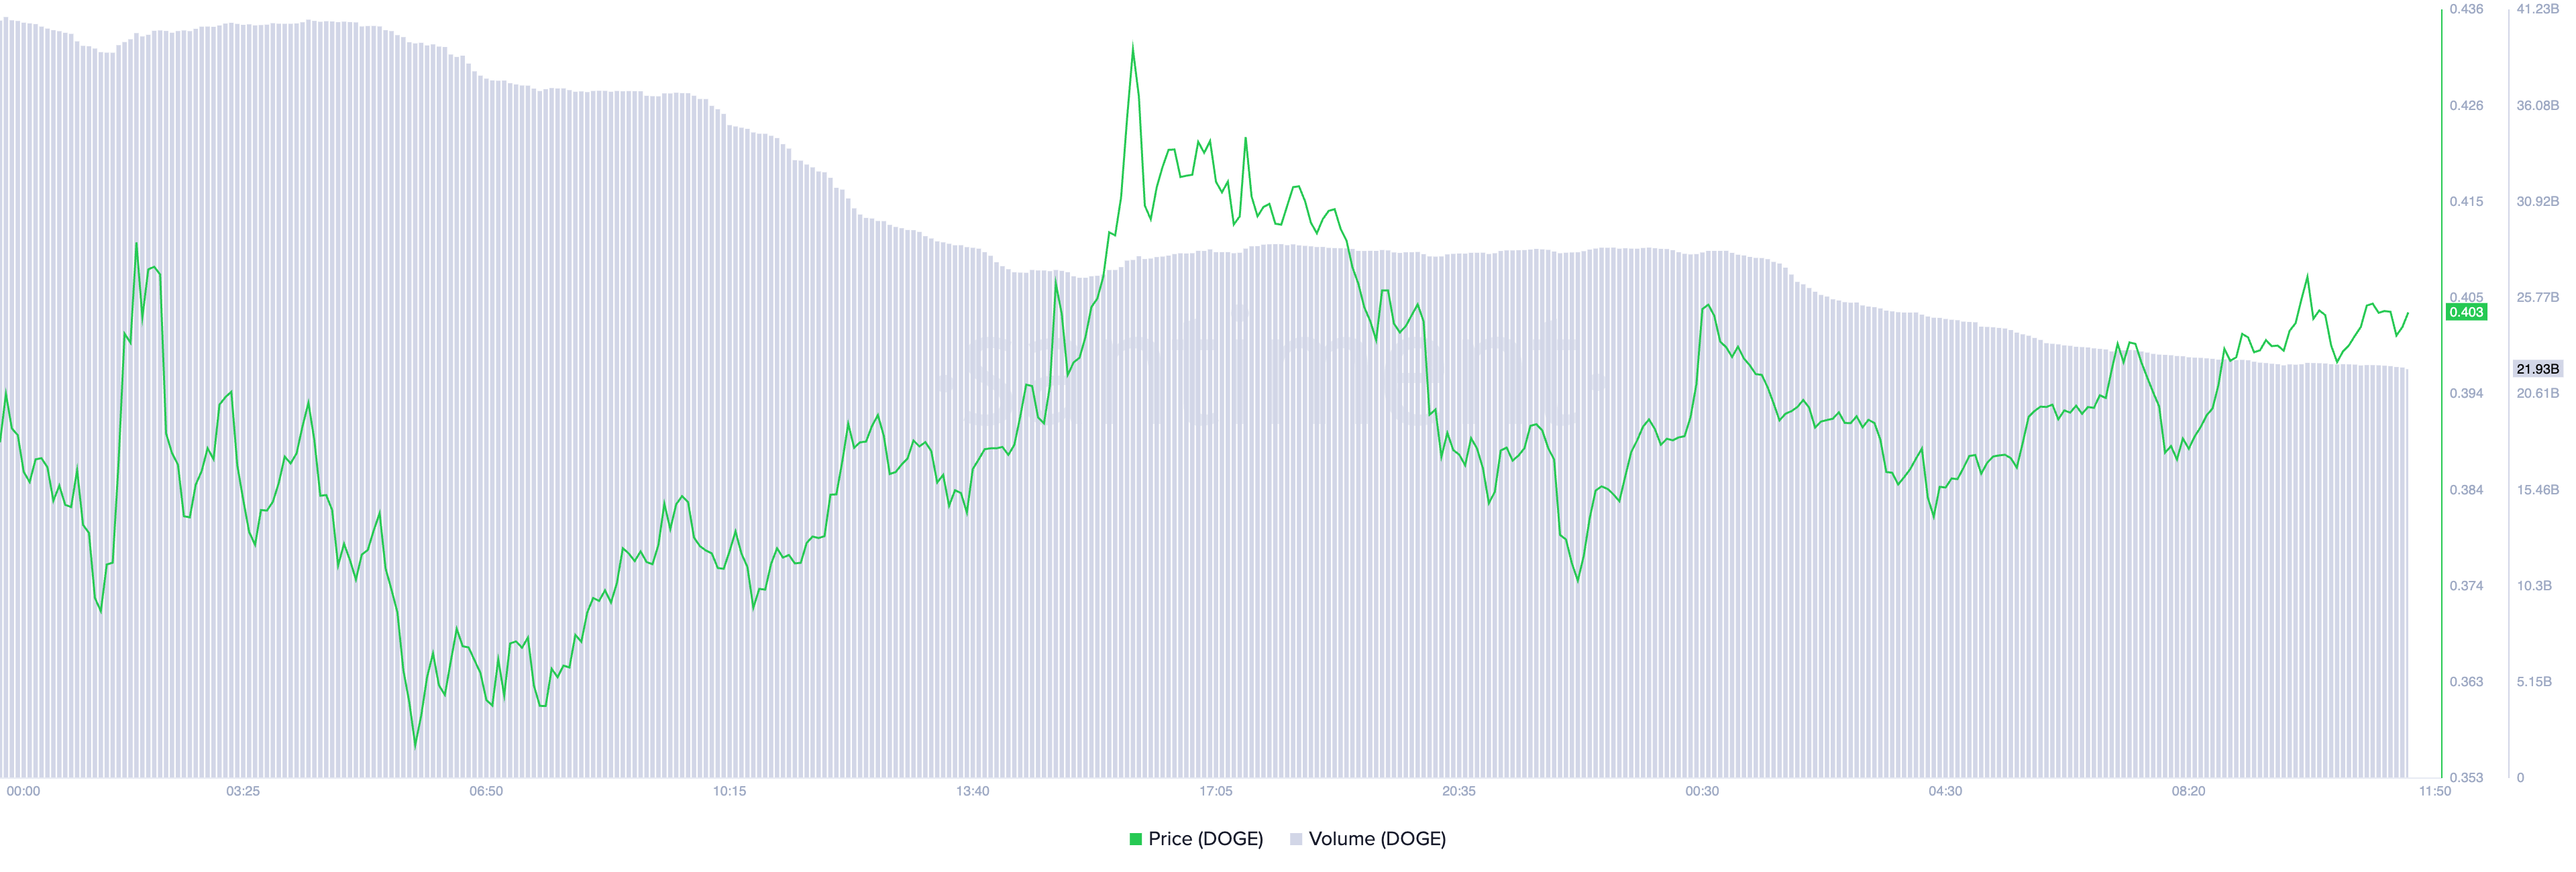
Dogecoin’s price has climbed 7% in the past 24 hours. However, during the same period, its trading volume declined by 33%, confirming the gradual surge in the meme coin’s selloffs.
When an asset’s price climbs but trading volume drops, it signals a weakening in the rally’s momentum. Lower trading volume during a price increase indicates that fewer investors are actively buying at these higher levels, suggesting reduced demand. This divergence is a bearish sign, as it means that the price increase lacks the strong buying support needed for a sustained rally.
Moreover, readings from the DOGE/USD one-day chart show that the altcoin has been overbought and is due for a pullback. The coin’s Relative Strength Index (RSI) is the first indication of this. As of this writing, the indicator’s value is 92.86, its highest since March.
The RSI measures an asset’s overbought and oversold market conditions, and it ranges between 0 and 100. Values above 70 indicate that the asset is overbought and due for a correction. Conversely, values under 30 suggest that the asset is oversold and may witness a rebound.
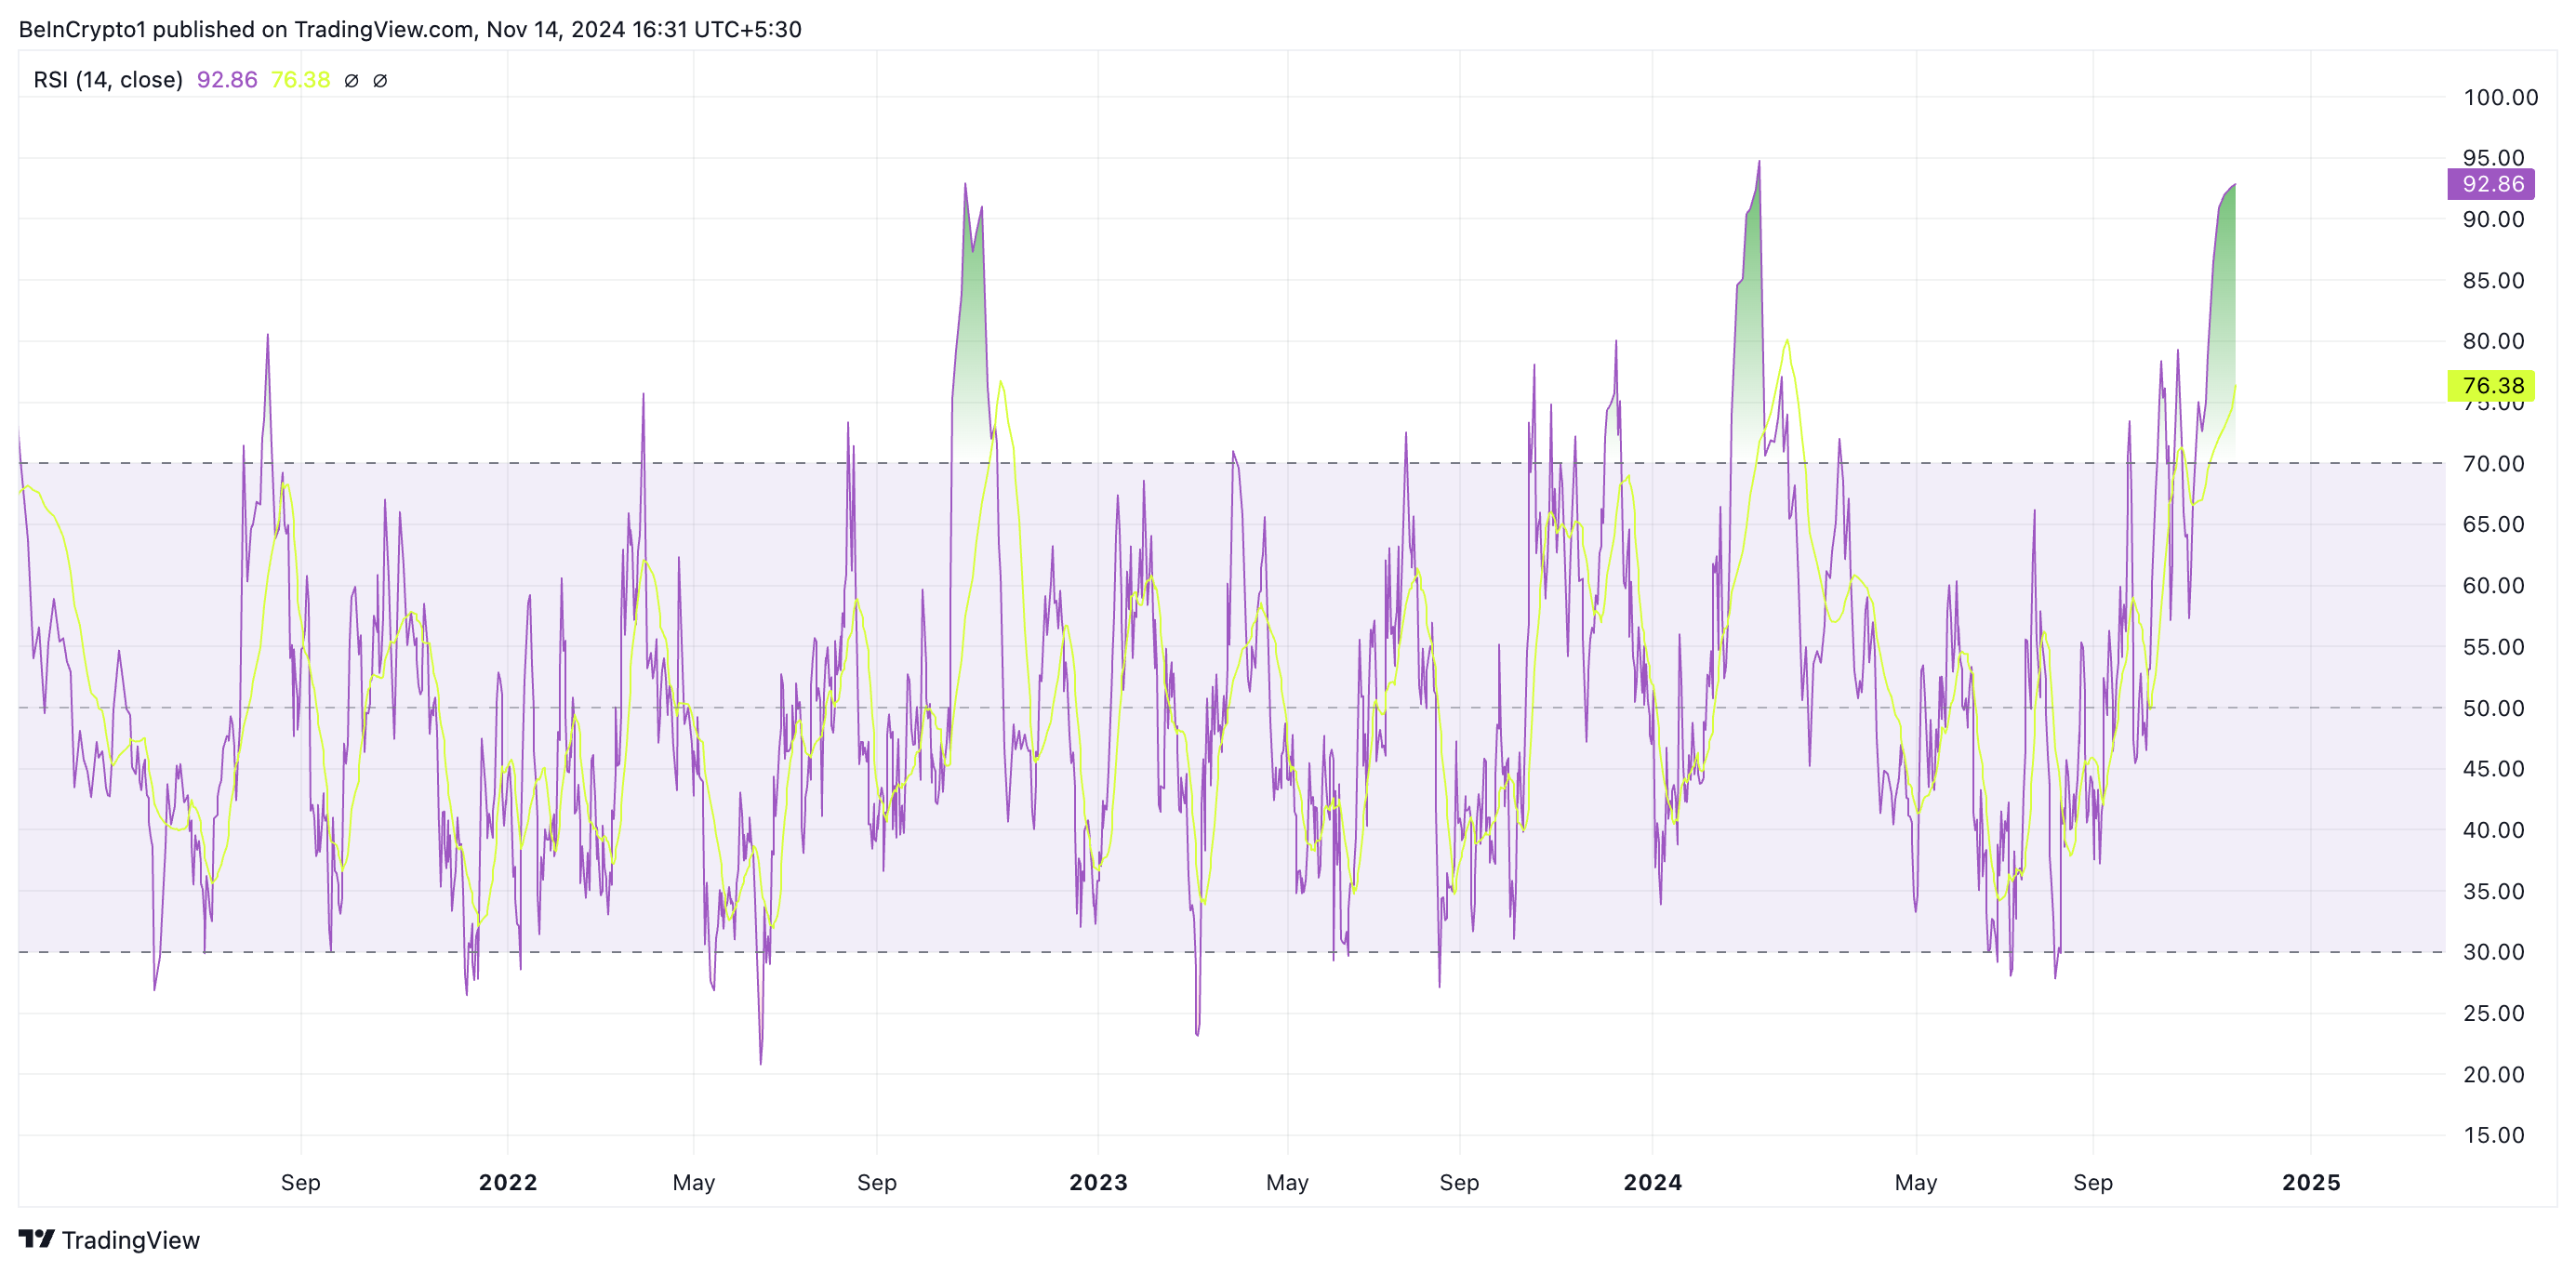
DOGE’s RSI reading of 92.86 indicates that it is significantly overbought and that a price correction is inevitable in the near term.
DOGE Price Prediction: Fall Under $0.30 Imminent
DOGE’s price is currently placed above the upper band of its Bollinger Bands indicator, confirming the possibility of a price retracement in the short term.
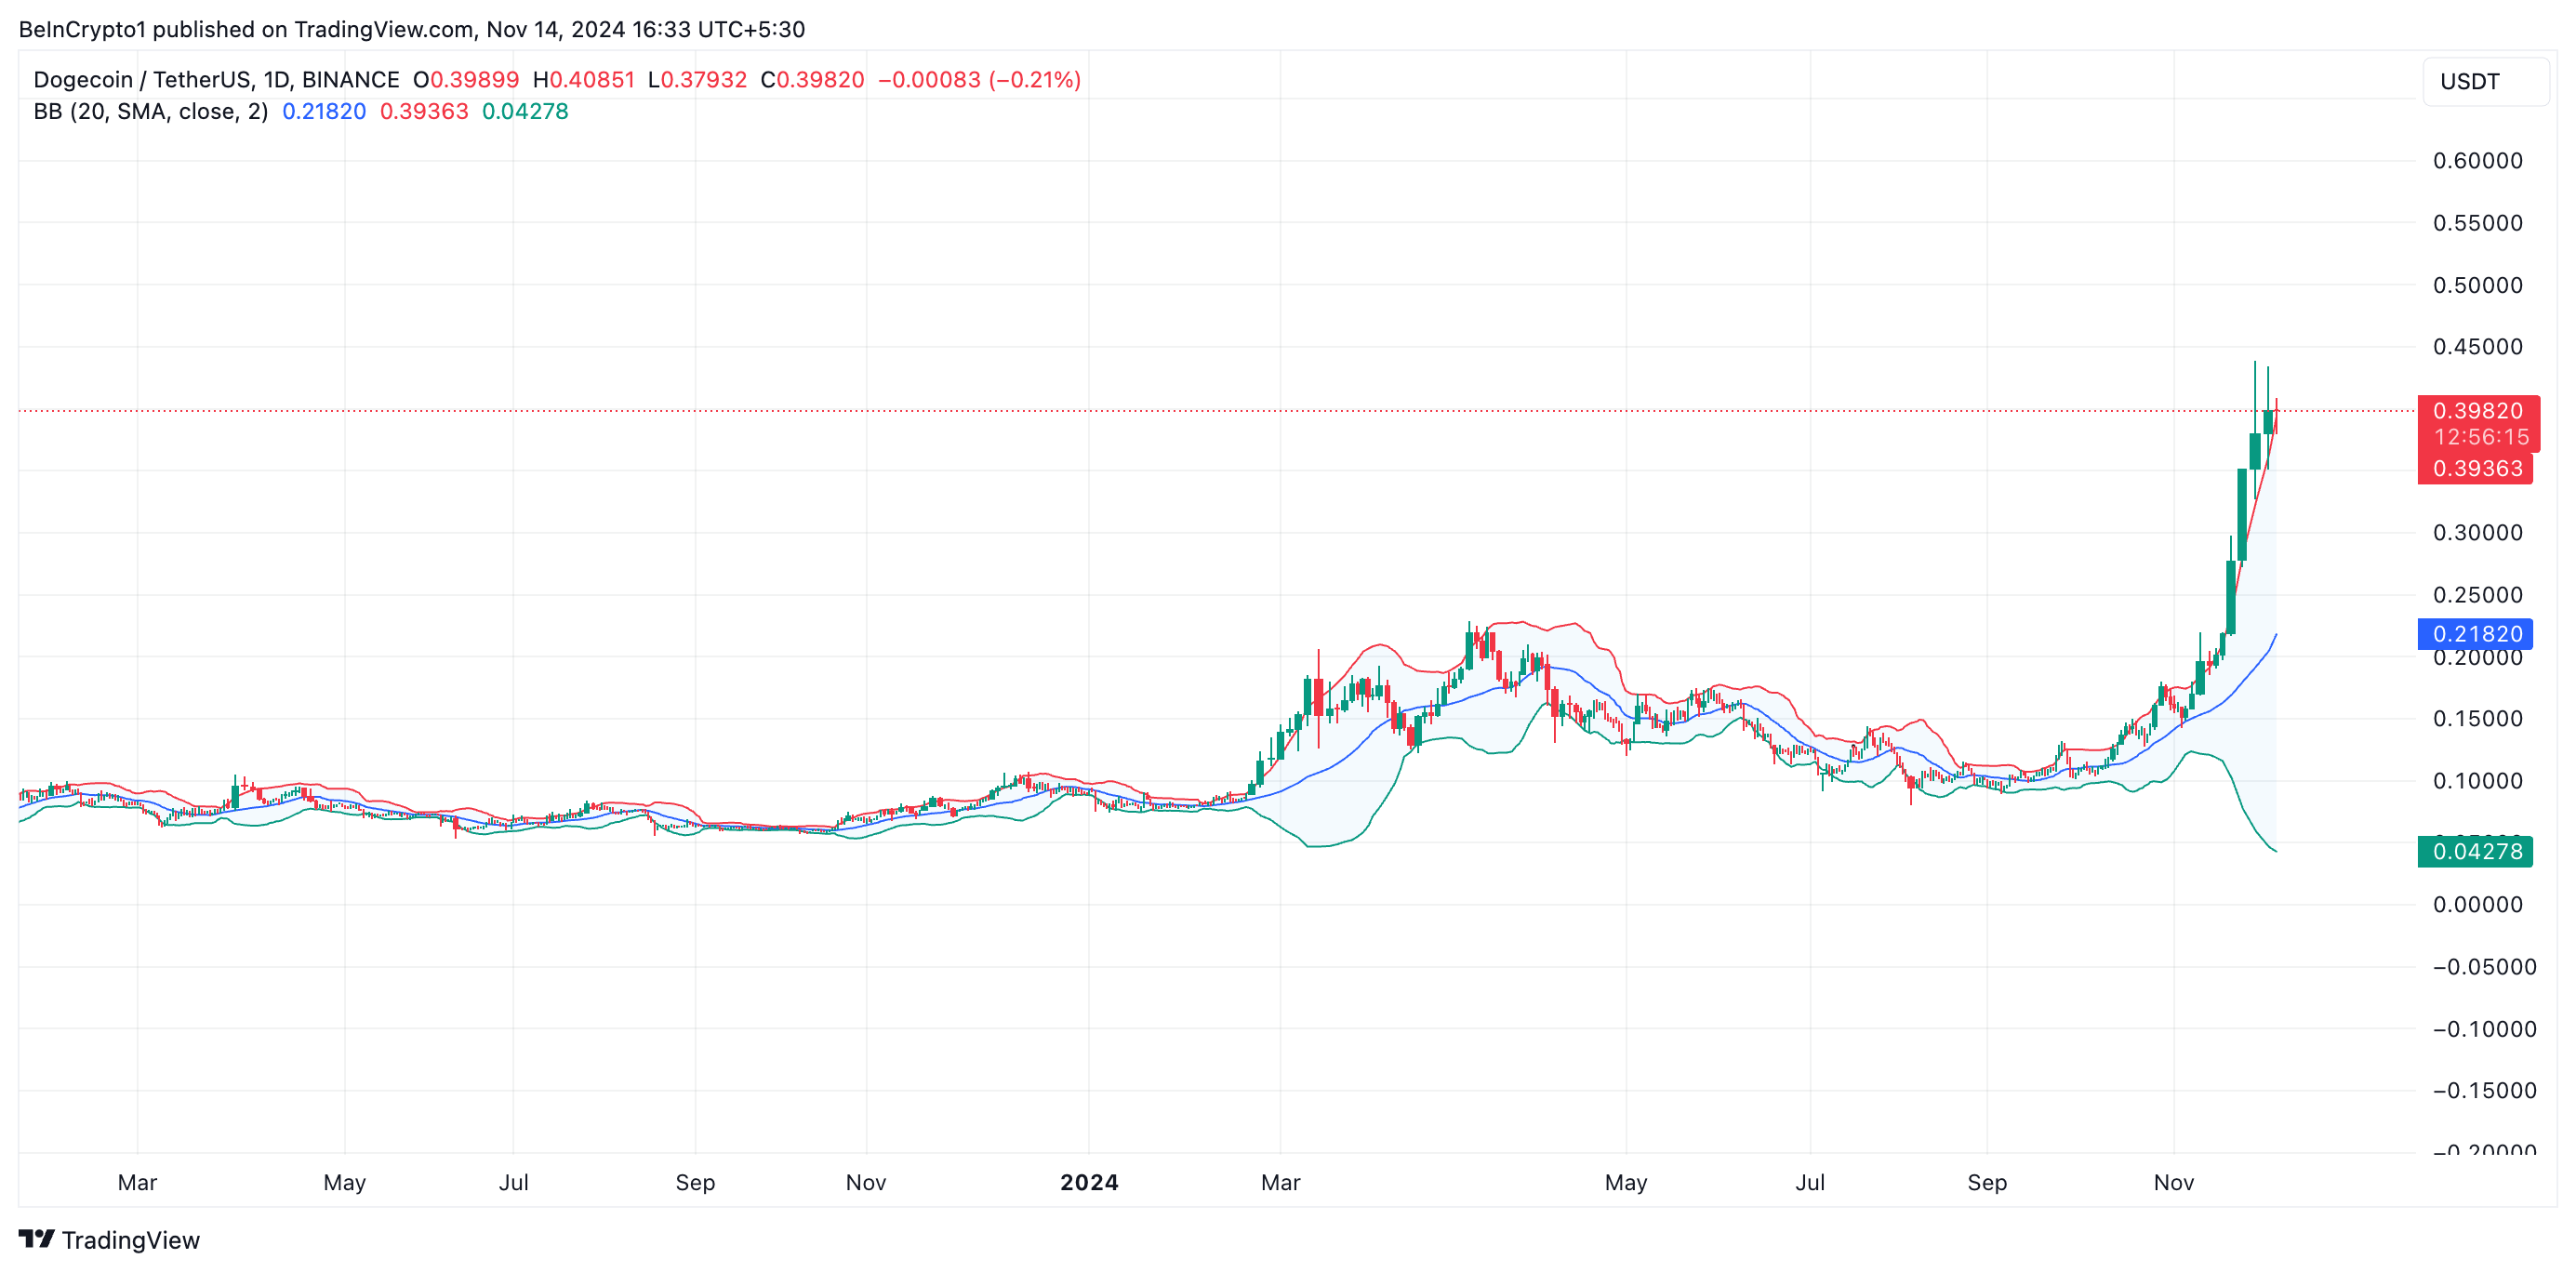
The Bollinger Bands indicator measures market volatility and identifies possible buy and sell signals. It comprises three primary components: the middle band, upper band, and lower band.
When an asset’s price rises above the upper band, it suggests that the asset may be overbought and overextended. Traders interpret this as a signal of potential downward pressure and take it as an opportunity to sell and lock in profits.
DOGE is currently trading at $0.40. Once a price correction begins, DOGE will likely test support at the $0.38 level. However, if buying pressure is weak and bulls cannot hold this line, the coin could drop sharply to $0.31.
Further selloffs at this point may drive the price even lower to $0.25.
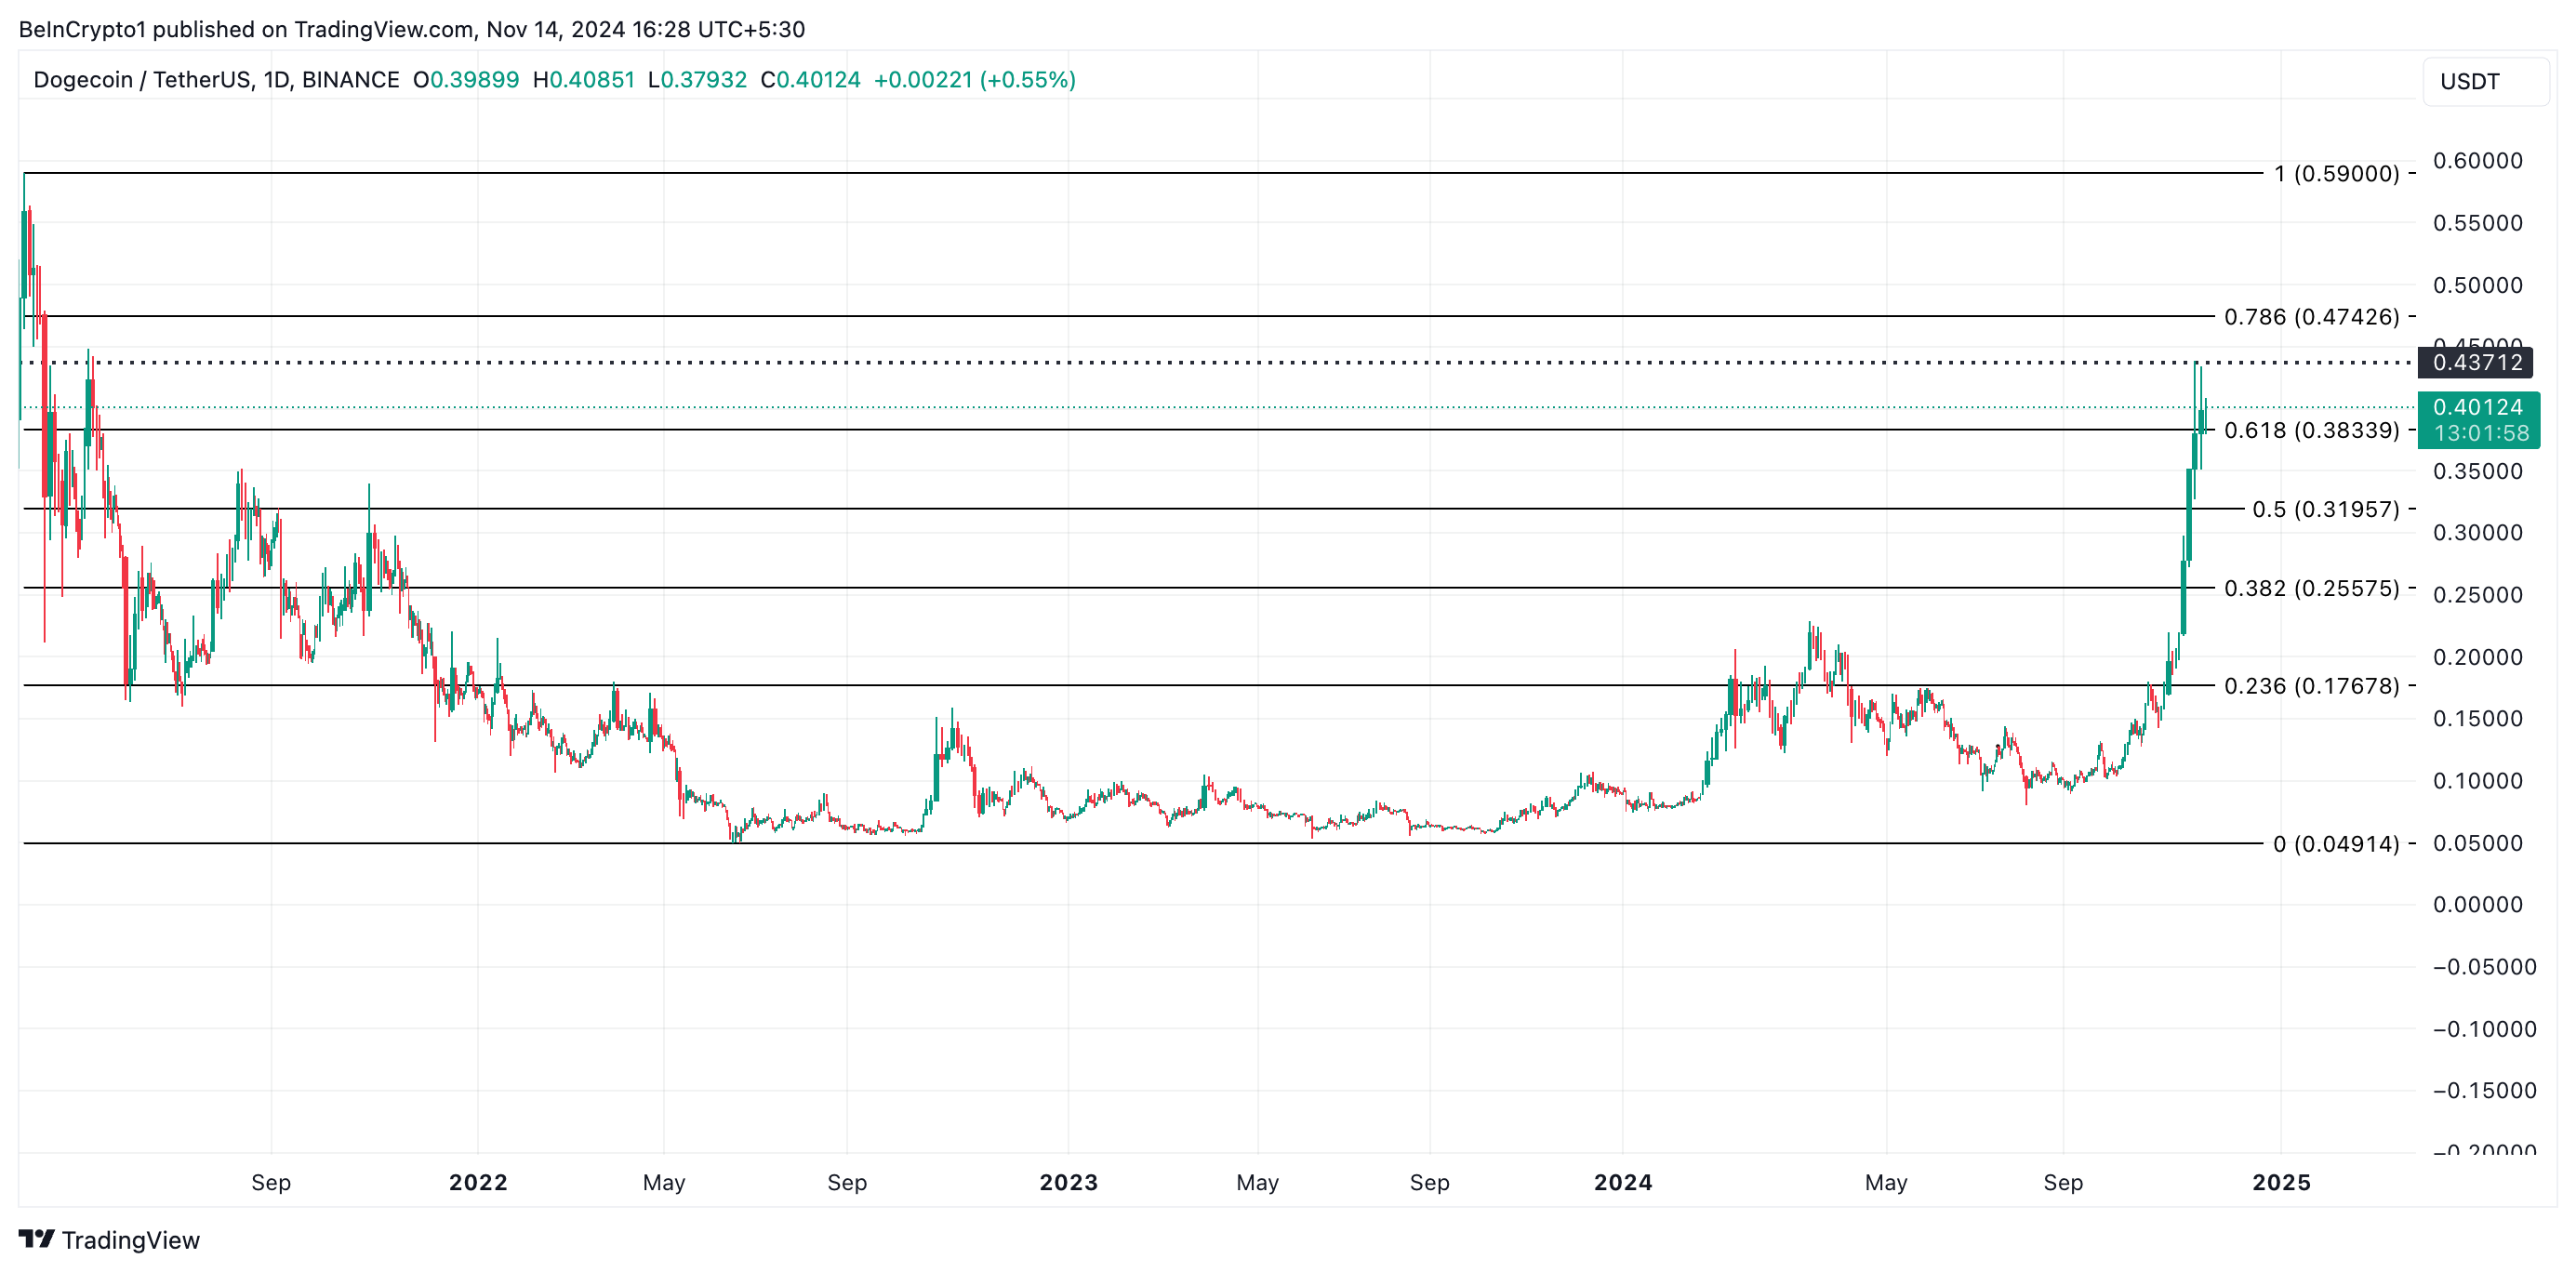
If demand strengthens, the Dogecoin price rally could reach $0.43, its peak so far during this bullish cycle, and potentially push toward $0.47—a level last seen in May 2021.
Disclaimer
In line with the Trust Project guidelines, this price analysis article is for informational purposes only and should not be considered financial or investment advice. BeInCrypto is committed to accurate, unbiased reporting, but market conditions are subject to change without notice. Always conduct your own research and consult with a professional before making any financial decisions. Please note that our Terms and Conditions, Privacy Policy, and Disclaimers have been updated.
-

 Bitcoin13 hours ago
57% of Investors Eye More Crypto
-

 Market12 hours ago
Can Chainlink Help WLFI Beat Setbacks?
-

 Regulation24 hours ago
Coinbase CEO Slams DOJ For Alleged Political Polymarket Probe
-

 Market24 hours ago
Cardano (ADA) Price Stabilizes After Recent Whale Activity
-

 Ethereum23 hours ago
Ethereum’s Rally Loses Steam: Analyst Foresee A Possible Brief Correction
-

 Altcoin17 hours ago
Delhi Police Arrests Suspect In $230 Million Crypto Heist
-

 Market23 hours ago
FLOKI Price Action Signals Strong Uptrend Despite Risks
-

 Market16 hours ago
Will PNUT Token Price Rally Past $2.49?


