
Market
Report Suggests Bitcoin’s ATH of $89,900 Could Rise Higher

Bitcoin price’s ongoing rally has the cryptocurrency leader on the brink of surpassing and forming ATH beyond $90,000. Although today’s pause in the uptrend caused some investor concerns, Glassnode’s latest report indicates that BTC’s rise may not be over just yet.
While there is room for further growth in Bitcoin’s price, all eyes are on where the new all-time high will be established.
Bitcoin Has Support
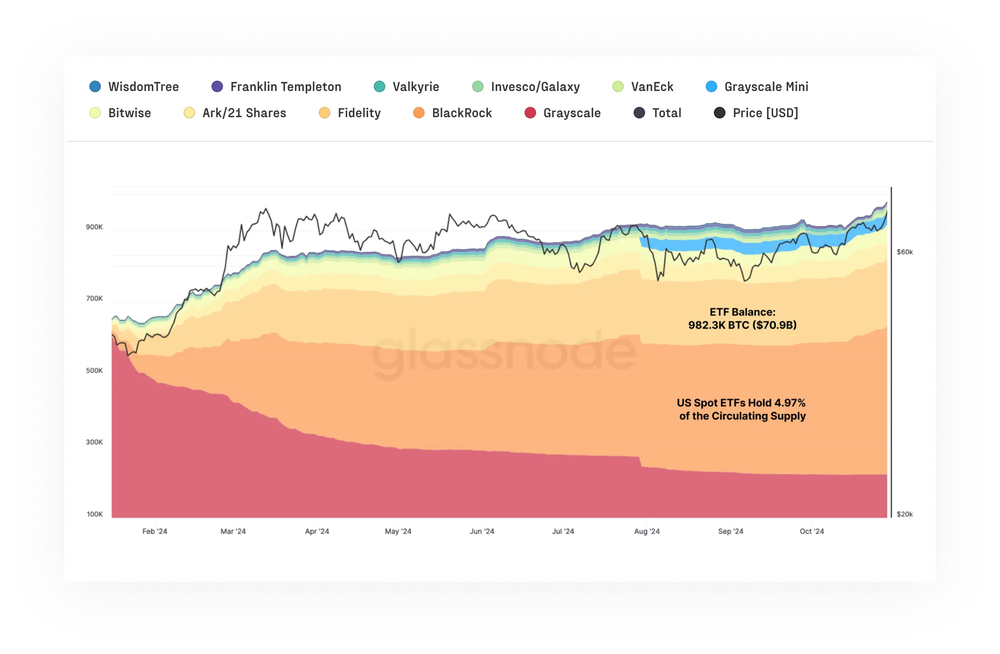
According to a report from Glassnode, Bitcoin ETFs are seeing record inflows, indicating growing confidence from mainstream investors. Recently, spot Bitcoin ETF assets have outpaced those of gold ETFs, highlighting strong institutional interest. This surge elevates Bitcoin’s status as a credible asset in traditional finance, suggesting that ETF-driven liquidity will play a significant role in influencing market trends and price dynamics.
Institutional demand for Bitcoin exposure has surged, with total assets managed across all BTC ETFs now reaching a market value of $70.9 billion. These ETFs collectively hold approximately 4.97% of Bitcoin’s circulating supply, reflecting substantial interest from institutional investors.
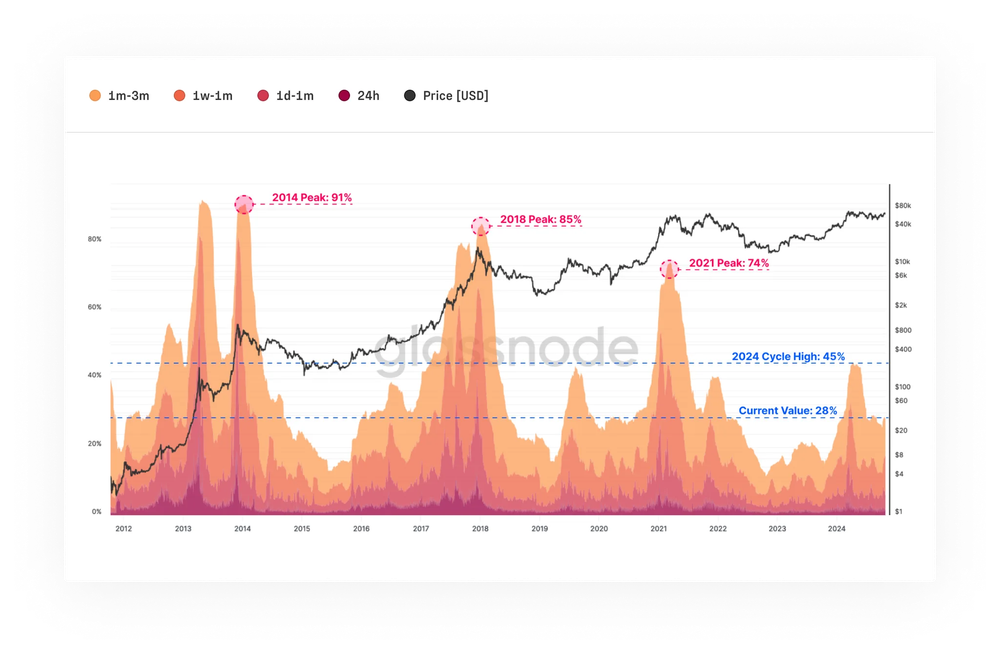
Furthermore, Past trends suggest a strong possibility for continued growth. Analysis of market cycles reveals that, following previous Bitcoin all-time highs, crypto markets have typically entered prolonged periods of expansion. With Bitcoin’s latest peak, current indicators imply a similar stage in the cycle, presenting an ideal entry opportunity for institutions aiming to leverage ongoing bullish momentum.
This trend is evident across both established and emerging markets, as seasoned investors distribute holdings to newcomers attracted by rapid price gains. Unlike previous all-time high distribution phases, the share of wealth held by new investors has not reached past peak levels, indicating this cycle may still have room to run.
BTC Price Prediction: Aiming at The Target
Bitcoin is currently trading at $88,022, reaching a new all-time high (ATH) of $89,922 in recent days. Despite some speculation about a possible decline, Bitcoin’s trajectory remains strong.
Market indicators point to a positive macro outlook for Bitcoin, with the next critical target set at $90,000. Achieving this level could provide insights into BTC’s future price direction and stability.
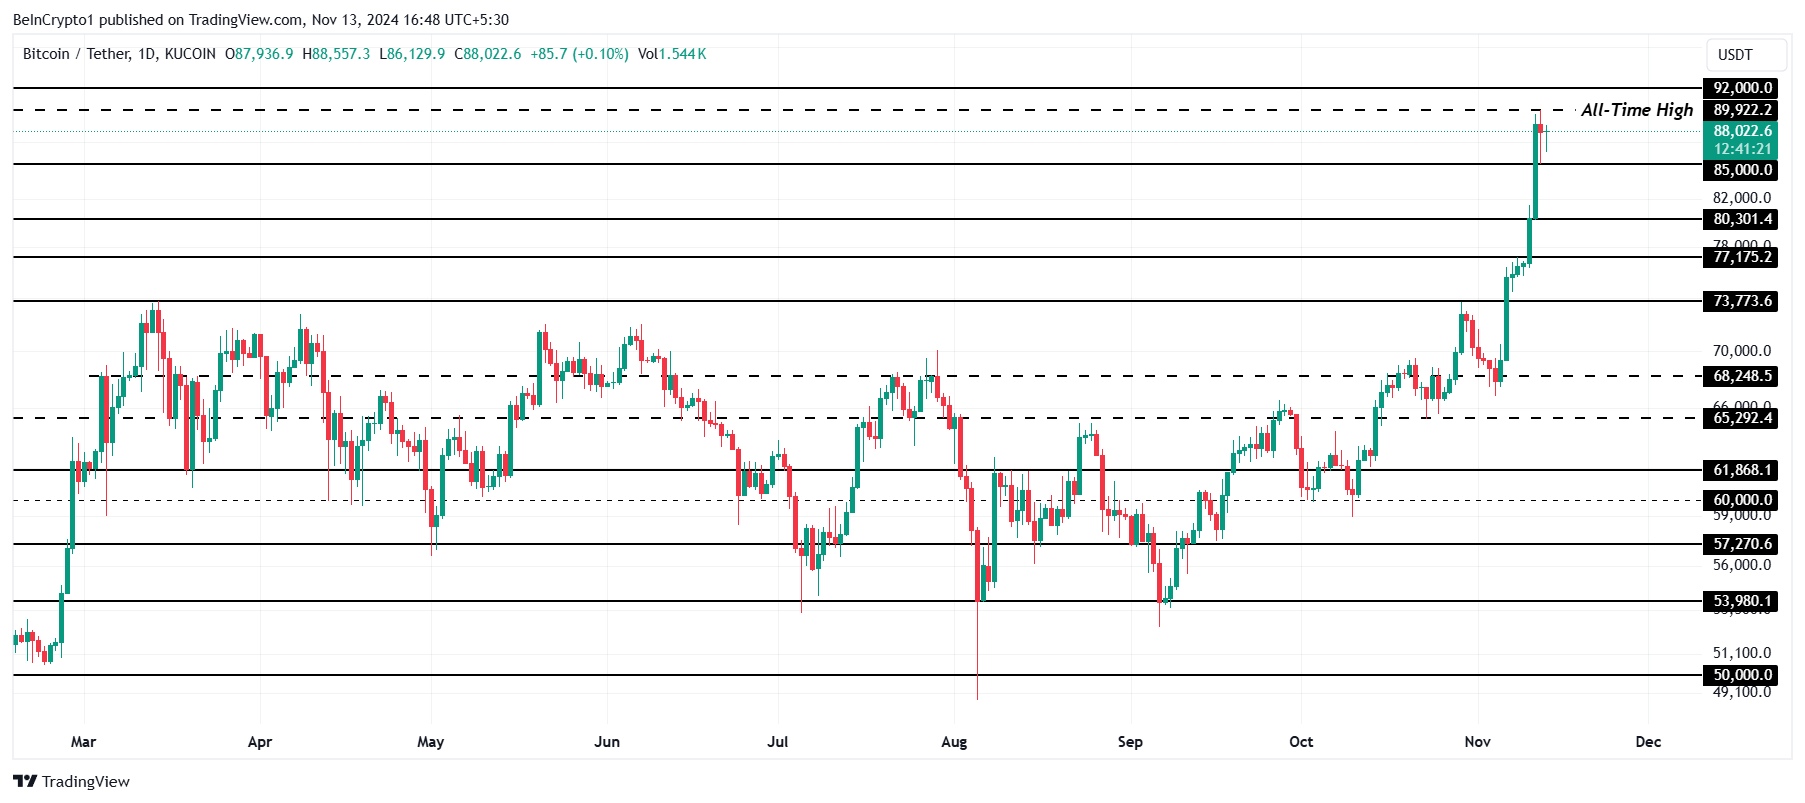
However, if Bitcoin encounters selling pressure and profit-taking begins, the price could dip to $85,000. Failing to hold at this level may lead to further declines, potentially reaching $80,301 and invalidating the current bullish outlook.
Disclaimer
In line with the Trust Project guidelines, this price analysis article is for informational purposes only and should not be considered financial or investment advice. BeInCrypto is committed to accurate, unbiased reporting, but market conditions are subject to change without notice. Always conduct your own research and consult with a professional before making any financial decisions. Please note that our Terms and Conditions, Privacy Policy, and Disclaimers have been updated.


XRP price started a fresh decline from the $2.20 zone. The price is now consolidating and might face hurdles near the $2.120 level.
- XRP price started a fresh decline after it failed to clear the $2.20 resistance zone.
- The price is now trading below $2.150 and the 100-hourly Simple Moving Average.
- There is a connecting bearish trend line forming with resistance at $2.120 on the hourly chart of the XRP/USD pair (data source from Kraken).
- The pair might extend losses if it fails to clear the $2.20 resistance zone.
XRP Price Faces Rejection
XRP price failed to continue higher above the $2.20 resistance zone and reacted to the downside, like Bitcoin and Ethereum. The price declined below the $2.150 and $2.120 levels.
The bears were able to push the price below the 50% Fib retracement level of the recovery wave from the $2.023 swing low to the $2.199 high. There is also a connecting bearish trend line forming with resistance at $2.120 on the hourly chart of the XRP/USD pair.
The price is now trading below $2.150 and the 100-hourly Simple Moving Average. However, the bulls are now active near the $2.10 support level. They are protecting the 61.8% Fib retracement level of the recovery wave from the $2.023 swing low to the $2.199 high.

On the upside, the price might face resistance near the $2.120 level and the trend line zone. The first major resistance is near the $2.150 level. The next resistance is $2.20. A clear move above the $2.20 resistance might send the price toward the $2.240 resistance. Any more gains might send the price toward the $2.2650 resistance or even $2.2880 in the near term. The next major hurdle for the bulls might be $2.320.
Another Decline?
If XRP fails to clear the $2.150 resistance zone, it could start another decline. Initial support on the downside is near the $2.10 level. The next major support is near the $2.0650 level.
If there is a downside break and a close below the $2.0650 level, the price might continue to decline toward the $2.020 support. The next major support sits near the $2.00 zone.
Technical Indicators
Hourly MACD – The MACD for XRP/USD is now gaining pace in the bearish zone.
Hourly RSI (Relative Strength Index) – The RSI for XRP/USD is now below the 50 level.
Major Support Levels – $2.10 and $2.050.
Major Resistance Levels – $2.120 and $2.20.

Circle’s initial public offering (IPO) filing has raised concerns among industry experts, who are sounding alarms over the company’s financial health, distribution costs, and valuation.
While the move marks a significant step toward mainstream financial integration, experts’ skepticism casts doubt on the company’s long-term prospects.
Analysts Highlight Red Flags With Circle IPO
On April 1, BeInCrypto reported that Circle had filed for an IPO. The company plans to list its Class A common stock on the New York Stock Exchange (NYSE) under “CRCL.”
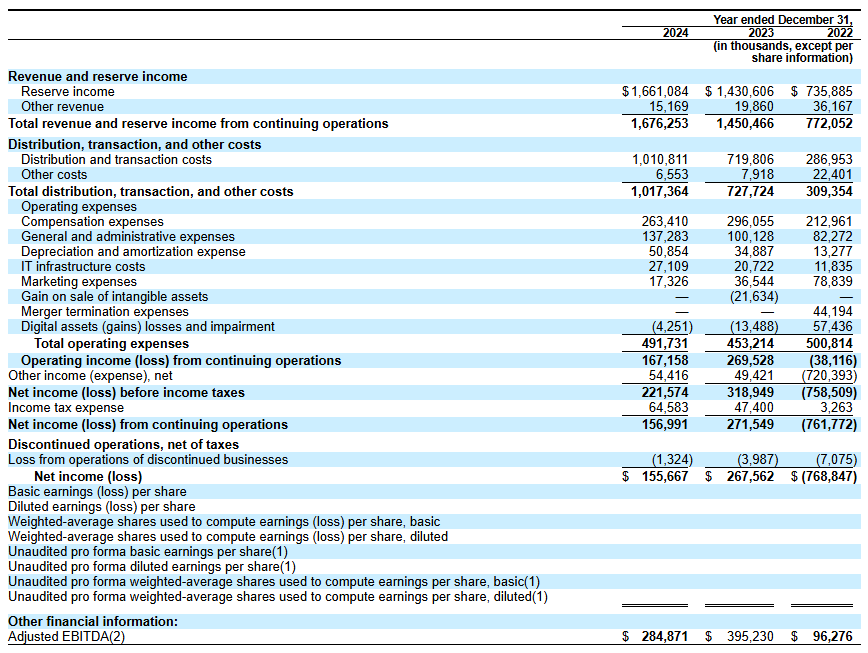
Circle’s IPO filing reveals revenue of $1.67 billion in 2024, a notable increase from previous years. However, a closer examination of the company’s financials has uncovered some challenges.
Matthew Sigel, Head of Digital Assets Research at VanEck, noted that revenue increased 16% year over year. Yet, at the same time, the company reported a 29% decrease in EBITDA year over year, indicating a decline in operational profitability. Additionally, net income fell by 42%, reflecting a significant drop in overall profitability.
Sigel pointed out four factors contributing to the decline in these financial metrics. He explained that the company’s rapid expansion and new service integrations negatively impacted net income.
Furthermore, the discontinuation of services like Circle Yield reduced other revenue streams. This, in turn, exacerbated the decline in profitability.
“Costs related to restructuring, legal settlements, and acquisition-related expenses also played a role in the decline in EBITDA and net income, despite overall revenue growth,” Sigel added.
Importantly, he focused on Circle’s increased distribution and transaction costs. Sigel revealed that the cost rose due to higher fees paid to partners like Coinbase and Binance.
A related post by Farside Investors on X (formerly Twitter) shed further light on these expenses.
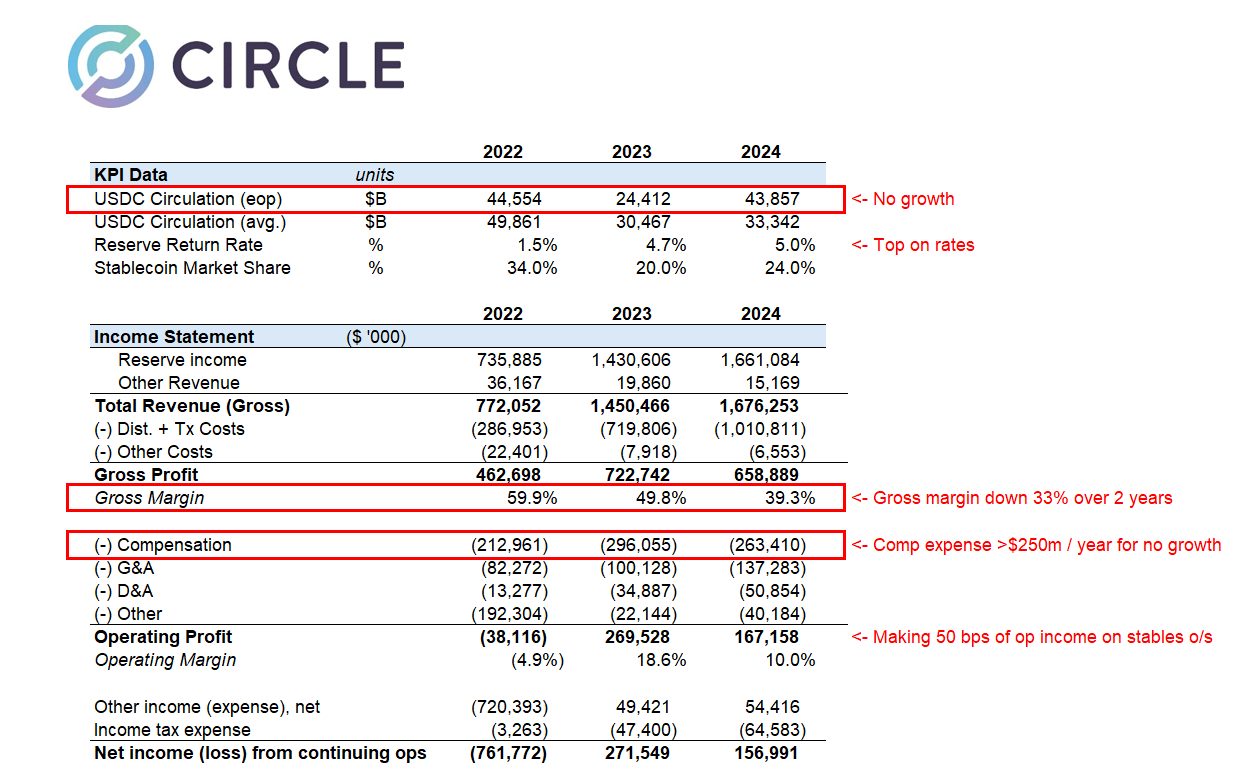
“In 2024, the company spent over $1 billion on “distribution and transaction costs,” probably much higher than Tether as a % of revenue,” the post read.
This prompts speculation that Circle may be overspending to maintain its market share in the competitive stablecoin sector. The company’s historical performance further fuels skepticism.
Farside Investors added that in 2022, Circle recorded a staggering $720 million loss. Notably, the year was marked by significant turmoil in the crypto industry, including the high-profile collapses of FTX and Three Arrows Capital (3AC).
This suggests that Circle may be vulnerable to market shocks. Thus, it calls into question the company’s risk management capabilities—especially in the inherently volatile crypto market.
“The gross creation and redemption numbers are a lot higher than we would have thought for USDC. Gross creations in a year are many multiples higher than the outstanding balance,” Farside Investors remarked.
In addition, analyst Omar expressed doubts about Circle’s $5 billion valuation.
“Nothing to love in the Circle IPO filing and no idea how it prices at $5 billion,” he questioned.
He drew attention to several concerns, including the company’s gross margins being severely impacted by high distribution costs. The analyst also pointed out that the deregulation of the US market is poised to disrupt Circle’s position.
Additionally, Omar stressed that Circle spends over $250 million annually on compensation and another $140 million on general and administrative costs, raising questions about its financial efficiency. He also noted that interest rates—core income drivers for Circle—will likely decline, presenting additional challenges.
“32x ’24 earnings for a business that just lost its mini-monopoly and facing several headwinds is expensive when growth structurally challenged,” Omar said.
Ultimately, the analyst concluded that the IPO filing was a desperate attempt to secure liquidity before facing serious market difficulties.
Meanwhile, Wyatt Lonergan, General Partner at VanEck, shared his predictions for Circle’s IPO, outlining four potential scenarios. In the base case, he forecasted that Circle would capitalize on the stablecoin narrative and secure key partnerships to drive growth.
In a bear case, Lonergan speculated that poor market conditions might lead to a Coinbase buyout.
“Circle IPOs, the market continues to tank, Circle stock goes with it. Poor business fundamentals cited. Coinbase swoops in to buy at a discount to the IPO price. USDC is all theirs at long last. Coinbase acquires Circle for something close to the IPO price, and they never go public,” Lonergan claimed.
Lastly, he outlined a probable scenario where Ripple bids up Circle’s valuation to a staggering $15 to $20 billion and acquires the company.
Disclaimer
In adherence to the Trust Project guidelines, BeInCrypto is committed to unbiased, transparent reporting. This news article aims to provide accurate, timely information. However, readers are advised to verify facts independently and consult with a professional before making any decisions based on this content. Please note that our Terms and Conditions, Privacy Policy, and Disclaimers have been updated.

Reason to trust
![]()
Strict editorial policy that focuses on accuracy, relevance, and impartiality
Created by industry experts and meticulously reviewed
The highest standards in reporting and publishing
Strict editorial policy that focuses on accuracy, relevance, and impartiality
Morbi pretium leo et nisl aliquam mollis. Quisque arcu lorem, ultricies quis pellentesque nec, ullamcorper eu odio.
Ethereum price started a recovery wave above the $1,850 level. ETH is now consolidating and facing key hurdles near the $1,920 level.
- Ethereum started a recovery wave above $1,820 and $1,850 levels.
- The price is trading above $1,860 and the 100-hourly Simple Moving Average.
- There is a connecting bullish trend line forming with support at $1,860 on the hourly chart of ETH/USD (data feed via Kraken).
- The pair must clear the $1,900 and $1,920 resistance levels to start a decent increase.
Ethereum Price Starts Recovery
Ethereum price managed to stay above the $1,750 support zone and started a recovery wave, like Bitcoin. ETH was able to climb above the $1,820 and $1,850 resistance levels.
The bulls even pushed the price above the $1,880 resistance zone. There was a move above the 50% Fib retracement level of the downward wave from the $2,032 swing high to the $1,767 low. However, the bears are active near the $1,920 zone.
Ethereum price is now trading above $1,850 and the 100-hourly Simple Moving Average. There is also a connecting bullish trend line forming with support at $1,860 on the hourly chart of ETH/USD.
On the upside, the price seems to be facing hurdles near the $1,900 level. The next key resistance is near the $1,920 level and the 61.8% Fib retracement level of the downward wave from the $2,032 swing high to the $1,767 low.

The first major resistance is near the $1,970 level. A clear move above the $1,970 resistance might send the price toward the $2,020 resistance. An upside break above the $2,020 resistance might call for more gains in the coming sessions. In the stated case, Ether could rise toward the $2,050 resistance zone or even $2,120 in the near term.
Another Decline In ETH?
If Ethereum fails to clear the $1,920 resistance, it could start another decline. Initial support on the downside is near the $1,860 level and the trend line. The first major support sits near the $1,845 zone.
A clear move below the $1,845 support might push the price toward the $1,800 support. Any more losses might send the price toward the $1,765 support level in the near term. The next key support sits at $1,710.
Technical Indicators
Hourly MACD – The MACD for ETH/USD is losing momentum in the bullish zone.
Hourly RSI – The RSI for ETH/USD is now above the 50 zone.
Major Support Level – $1,860
Major Resistance Level – $1,920

Pi Network Faces Community Backlash, Is Pi Coin Price Heading to Zero?

XRP Recovery Stalls—Are Bears Still In Control?

Institutional Risk Aversion Drives $218 Million Bitcoin ETF Outflows

PENDLE Price Jumps 8% Today Amid Huge Whale Accumulation

Experts Raise Red Flags Over Finances
Will BNB Price Rally to ATH After VanEck BNB ETF Filing?

2.52 Million Altcoins Are Ruining Crypto’s Future

Animoca Brands Valuation Tanks 75% In Two Years, Here’s Why

Crypto exchange BingX hacked for $43 million

Are The Big Players Losing Interest?

Hong Kong’s Securities Association Tips Authorities On Crypto Self-Regulation

Coinbase cbBTC Set to go Live on Solana
2.52 Million Altcoins Are Ruining Crypto’s Future
Animoca Brands Valuation Tanks 75% In Two Years, Here’s Why
Crypto exchange BingX hacked for $43 million
Are The Big Players Losing Interest?
Hong Kong’s Securities Association Tips Authorities On Crypto Self-Regulation
Coinbase cbBTC Set to go Live on Solana
-

 Market22 hours ago
Bitcoin Price Battles Key Hurdles—Is a Breakout Still Possible?
-

 Bitcoin19 hours ago
$500 Trillion Bitcoin? Saylor’s Bold Prediction Shakes the Market!
-

 Bitcoin20 hours ago
Big Bitcoin Buy Coming? Saylor Drops a Hint as Strategy Shifts
-
 Altcoin18 hours ago
Will XRP, SOL, ADA Make the List?
-

 Market24 hours ago
XRP Bulls Fight Back—Is a Major Move Coming?
-
 Market23 hours ago
Is CZ’s April Fool’s Joke a Crypto Reality or Just Fun?
-

 Market21 hours ago
XRP Price Struggles as Whale Selling Rises To $2.3 Billion
-

 Market20 hours ago
Fake Gemini Bankruptcy Emails Target Users