Market
What Past US Elections Reveal About Crypto Market Trends

The US Presidential election is anticipated to have a substantial impact on global markets, with the cryptocurrency sector standing as no exception. Traders, analysts, and crypto enthusiasts worldwide closely monitor the US, where shifting attitudes toward digital assets make a difference.
In a recent report, on-chain analytics platform Santiment explored the connection between the most important US political event and crypto market movements. With results expected in days, here’s a look back at the crypto market reactions during the last two US presidential election cycles.
How Did US Elections Impact Crypto During Past Cycles
Analysts expect a close race in the 2024 US presidential election and predict a prolonged counting period. Given the tight competition, multiple days may pass after Election Day on Nov. 5 before the final results are confirmed and the next president is publicly announced.
In past elections, markets have reacted swiftly to presidential outcomes. Officials announced Joe Biden’s victory in 2020 four days after Election Day, triggering positive trends despite ongoing global economic turbulence from COVID-19.
While the election influenced market movements, some argue that a bull run was already on the horizon as the international community focused on economic recovery and pandemic response.

After Donald Trump’s 2016 victory, the crypto market saw a minor five-day retrace, with Bitcoin and altcoins dipping before quickly rebounding from the initial volatility. Cryptocurrency markets are famously volatile, and election cycles tend to amplify this effect.
In 2020, Joe Biden’s win fueled optimism for stimulus-driven policies and potentially more lenient monetary practices, leading to a surge in crypto prices. The brief dip and swift recovery in 2016, contrasted with the post-election rally in 2020, highlight how political shifts can significantly impact market trends.
As a result, the announcement of Joe Biden’s victory in the 2020 election was far more positive for crypto, and markets reacted almost instantly after the news broke.
Read more: How Can Blockchain Be Used for Voting in 2024?

The 2024 election is expected to bring significant price fluctuations in crypto markets, driven by the incoming administration’s stance on regulation and policy. Both major presidential candidates have outlined their views on cryptocurrency, offering a glimpse into the potential direction of US digital asset policy in the years ahead.
Candidate Positions on Cryptocurrency: Trump vs. Harris
Donald Trump
Cryptocurrency enthusiasts widely view Trump’s proposals as more favorable due to his emphasis on industry-friendly policies and his family’s active involvement in digital assets. The crypto community has largely responded positively to his proposals, which many view as encouraging to market growth:
- National Bitcoin Reserve: Trump proposed creating a national bitcoin stockpile at the Bitcoin 2024 conference in July, aimed at establishing the US as a cryptocurrency frontrunner.
- Crypto-Friendly Regulatory Policies: Trump has pledged to create a presidential advisory council on cryptocurrency, aiming to develop clear, favorable regulations.
- SEC Leadership Overhaul: Trump has stated he would replace SEC Chair Gary Gensler, aiming for a regulatory shift he describes as more favorable to digital assets.
- Family Ventures in Crypto: Trump’s sons, Donald Trump Jr. and Eric Trump, recently launched World Liberty Financial, a cryptocurrency exchange, underscoring the family’s involvement in the industry.
Kamala Harris
Harris, though supportive, emphasizes consumer protection, which some in the crypto space interpret as less conducive to industry expansion:
- Support for Innovation in Digital Assets: Harris has voiced support for digital assets and AI, emphasizing the need to foster innovation while protecting consumers.
- Framework for Regulatory Clarity: Harris proposed a regulatory framework for digital assets in October 2024, focusing on investor protections and transparent guidelines.
- Blockchain’s Potential: Harris has acknowledged blockchain technology’s potential, calling for balanced regulations that support innovation without compromising consumer safety.
- Engagement with Industry Leaders: Harris has engaged in dialogue with cryptocurrency leaders throughout 2024, signaling her openness to digital innovations while maintaining regulatory standards.
These differing approaches have resulted in a significantly higher volume of mentions around Trump’s crypto discussions and policies compared to Harris’s, reflecting the community’s heightened interest in his approach.

On Polymarket, prediction rates show higher support for Trump over Harris among the crypto community, though Harris has recently closed the gap, making it a closer race.
Read more: How To Use Polymarket In The United States: Step-by-Step Guide
Regardless of who wins the 2024 election, the cryptocurrency sector anticipates continued growth and evolving regulatory frameworks as the new administration steps in. The crypto community will closely observe how the incoming administration navigates the rise of digital assets, balancing the drive for innovation with regulatory safeguards.
Disclaimer
In adherence to the Trust Project guidelines, BeInCrypto is committed to unbiased, transparent reporting. This news article aims to provide accurate, timely information. However, readers are advised to verify facts independently and consult with a professional before making any decisions based on this content. Please note that our Terms and Conditions, Privacy Policy, and Disclaimers have been updated.
Market
Dogecoin (DOGE) Bleeds Further—Fresh Weekly Lows Test Investor Patience

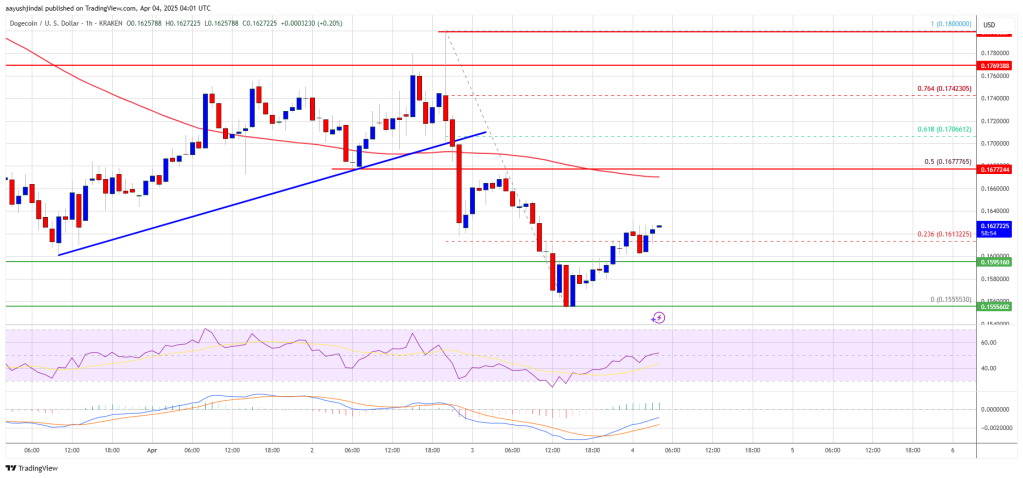
Dogecoin started a fresh decline from the $0.180 zone against the US Dollar. DOGE is consolidating and might struggle to recover above $0.1680.
- DOGE price started a fresh decline below the $0.1750 and $0.170 levels.
- The price is trading below the $0.1680 level and the 100-hourly simple moving average.
- There was a break below a key bullish trend line forming with support at $0.170 on the hourly chart of the DOGE/USD pair (data source from Kraken).
- The price could extend losses if it breaks the $0.1550 support zone.
Dogecoin Price Dips Again
Dogecoin price started a fresh decline after it failed to clear $0.180, like Bitcoin and Ethereum. DOGE dipped below the $0.1750 and $0.1720 support levels.
There was a break below a key bullish trend line forming with support at $0.170 on the hourly chart of the DOGE/USD pair. The bears were able to push the price below the $0.1620 support level. It even traded close to the $0.1550 support.
A low was formed at $0.1555 and the price is now consolidating losses. There was a minor move above the 23.6% Fib retracement level of the downward move from the $0.180 swing high to the $0.1555 low.
Dogecoin price is now trading below the $0.170 level and the 100-hourly simple moving average. Immediate resistance on the upside is near the $0.1650 level. The first major resistance for the bulls could be near the $0.1680 level. It is near the 50% Fib retracement level of the downward move from the $0.180 swing high to the $0.1555 low.
The next major resistance is near the $0.1740 level. A close above the $0.1740 resistance might send the price toward the $0.180 resistance. Any more gains might send the price toward the $0.1880 level. The next major stop for the bulls might be $0.1950.
Another Decline In DOGE?
If DOGE’s price fails to climb above the $0.170 level, it could start another decline. Initial support on the downside is near the $0.160 level. The next major support is near the $0.1550 level.
The main support sits at $0.150. If there is a downside break below the $0.150 support, the price could decline further. In the stated case, the price might decline toward the $0.1320 level or even $0.120 in the near term.
Technical Indicators
Hourly MACD – The MACD for DOGE/USD is now losing momentum in the bearish zone.
Hourly RSI (Relative Strength Index) – The RSI for DOGE/USD is now above the 50 level.
Major Support Levels – $0.1600 and $0.1550.
Major Resistance Levels – $0.1680 and $0.1740.
Market
Bitcoin & Ethereum Options Expiry: Can Prices Stay Stable?

The crypto market is set to see $2.58 billion in Bitcoin and Ethereum options expire today, a development that could trigger short-term price volatility and impact traders’ profitability.
Of this total, Bitcoin (BTC) options account for $2.18 billion, while Ethereum (ETH) options represent $396.16 million.
Bitcoin and Ethereum Holders Brace For Volatility
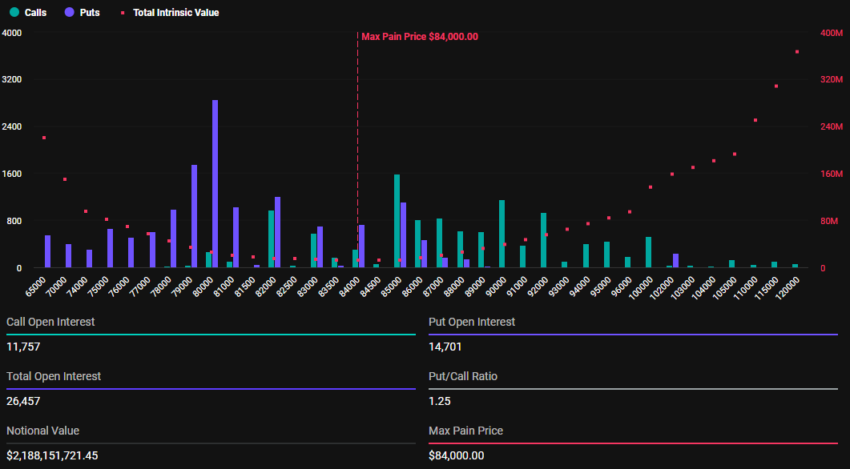
According to data on Deribit, 26,457 Bitcoin options will expire today, significantly lower than the first quarter (Q1) closer, where 139,260 BTC contracts went bust last week. The options contracts due for expiry today have a put-to-call ratio 1.25 and a maximum pain point of $84,000.
The put-to-call ratio indicates a higher volume of puts (sales) relative to calls (purchases), indicating a bearish sentiment. More traders or investors are betting on or protecting against a potential market drop.
On the other hand, 221,303 Ethereum options will also expire today, down from 1,068,519 on the last Friday of March. With a put-to-call ratio of 1.41 and a max pain point of $1,850, the expirations could influence ETH’s short-term price movement.
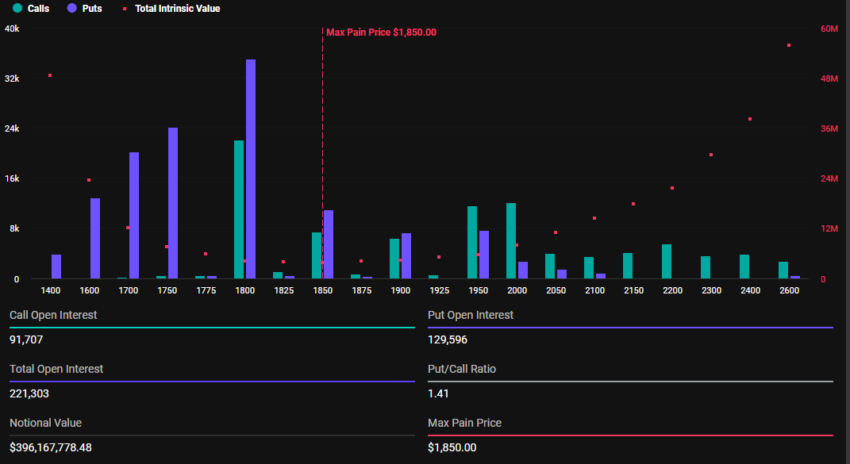
As the options contracts near expiration at 8:00 UTC today, Bitcoin and Ethereum prices are expected to approach their respective maximum pain points. According to BeInCrypto data, BTC was trading at $82,895 as of this writing, whereas ETH was exchanging hands for $1,790.
This suggests that prices might rise as smart money aims to move them toward the “max pain” level. Based on the Max Pain theory, options prices tend to gravitate toward strike prices where the highest number of contracts, both calls and puts, expire worthless.
Nevertheless, price pressure on BTC and ETH will likely ease after 08:00 UTC on Friday when Deribit settles the contracts. However, the sheer scale of these expirations could still fuel heightened volatility in the crypto markets.
“Where do you see the market going next? Deribit posed.
Elsewhere, analysts at Greeks.live explain the current market sentiment, highlighting a bearish outlook. This adds credence to why more traders are betting on or protecting against a potential market drop.
Bearish Sentiment Grips Markets
In a post on X (Twitter), Greeks.live reported a predominantly bearish sentiment in the options market. This follows US President Donald Trump’s tariff announcement.
BeInCrypto reported that the new tariffs constituted a 10% blanket rate and 25% on autos. While this fell short of market expectations, it was still perceived as a negative development, sparking widespread concern among traders.
According to the analysts, options flow reflected this pessimism, with heavy put buying dominating trades.
“Trump’s tariffs are viewed as severe trade disruption… The market’s initial positive reaction with a price spike to $88 was seen as gambling/short covering, followed by a sharp reversal as reality set in about economic impacts. Options flow remains heavily bearish, with traders noting significant put buying, including “700 79k puts for end of April,” wrote Greeks.live analysts.
Traders snapping up 700 $79,000 puts for the end of April signals expectations of a sustained downturn. According to the analysts, the consensus among traders points to continued volatility, with a potential “bad close” below $83,000 today, Friday, April 4. Such an action would erase the earlier pump entirely.
Meanwhile, many traders are adopting bearish strategies, favoring short calls or put calendars. Shorting calls is reportedly deemed the most effective approach in the current climate.
Therefore, while the market’s initial reaction to Trump’s tariffs was a mix of hope and reality, the reversal reflects the broader economic fallout from Trump’s policies. As traders brace for choppy conditions, the bearish outlook in options trading paints a cautious picture for the days ahead.
Global supply chain disruptions and economic uncertainty remain at the forefront of market concerns.
Disclaimer
In adherence to the Trust Project guidelines, BeInCrypto is committed to unbiased, transparent reporting. This news article aims to provide accurate, timely information. However, readers are advised to verify facts independently and consult with a professional before making any decisions based on this content. Please note that our Terms and Conditions, Privacy Policy, and Disclaimers have been updated.
Market
XRP Battle Heats Up—Can Bulls Turn the Tide?

XRP price started a fresh decline below the $2.050 zone. The price is now consolidating and might face hurdles near the $2.10 level.
- XRP price started a fresh decline below the $2.120 and $2.050 levels.
- The price is now trading below $2.10 and the 100-hourly Simple Moving Average.
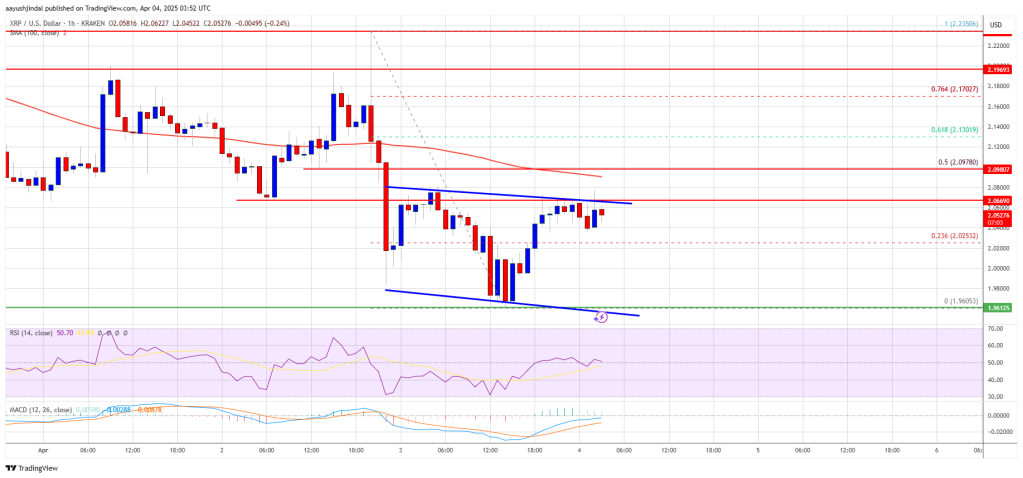
- There is a short-term declining channel forming with resistance at $2.0680 on the hourly chart of the XRP/USD pair (data source from Kraken).
- The pair might extend losses if it fails to clear the $2.10 resistance zone.
XRP Price Attempts Recovery
XRP price extended losses below the $2.050 support level, like Bitcoin and Ethereum. The price declined below the $2.00 and $1.980 support levels. A low was formed at $1.960 and the price is attempting a recovery wave.
There was a move above the $2.00 and $2.020 levels. The price surpassed the 23.6% Fib retracement level of the downward move from the $2.235 swing high to the $1.960 low. However, the bears are active below the $2.10 resistance zone.
The price is now trading below $2.10 and the 100-hourly Simple Moving Average. On the upside, the price might face resistance near the $2.070 level. There is also a short-term declining channel forming with resistance at $2.0680 on the hourly chart of the XRP/USD pair.
The first major resistance is near the $2.10 level. It is near the 50% Fib retracement level of the downward move from the $2.235 swing high to the $1.960 low. The next resistance is $2.120.
A clear move above the $2.120 resistance might send the price toward the $2.180 resistance. Any more gains might send the price toward the $2.2350 resistance or even $2.40 in the near term. The next major hurdle for the bulls might be $2.50.
Another Decline?
If XRP fails to clear the $2.10 resistance zone, it could start another decline. Initial support on the downside is near the $2.00 level. The next major support is near the $1.960 level.
If there is a downside break and a close below the $1.960 level, the price might continue to decline toward the $1.920 support. The next major support sits near the $1.90 zone.
Technical Indicators
Hourly MACD – The MACD for XRP/USD is now losing pace in the bearish zone.
Hourly RSI (Relative Strength Index) – The RSI for XRP/USD is now above the 50 level.
Major Support Levels – $2.00 and $1.960.
Major Resistance Levels – $2.10 and $2.120.
-

 Market21 hours ago
IP Token Price Surges, but Weak Demand Hints at Reversal
-

 Altcoin22 hours ago
Binance Issues Key Announcement On StakeStone TGE; Here’s All
-

 Altcoin21 hours ago
Movimiento millonario de Solana, SOLX es la mejor opción
-

 Ethereum21 hours ago
Ethereum Trading In ‘No Man’s Land’, Breakout A ‘Matter Of Time’?
-

 Bitcoin21 hours ago
BlackRock Approved by FCA to Operate as UK Crypto Asset Firm
-

 Bitcoin24 hours ago
US Dollar Index Drops – What Does It Mean for Bitcoin?
-

 Market20 hours ago
HBAR Foundation Eyes TikTok, Price Rally To $0.20 Possible
-

 Altcoin20 hours ago
John Squire Says XRP Could Spark A Wave of Early Retirements


