Market
VanEck Expands DeFi Offerings with PYTH ETN on Euronext

Asset manager VanEck has launched a new ETN based on PYTH, specifically for European buyers. The Pyth network, a decentralized oracle protocol, has earned praise from VanEck for its potential to transform the DeFi landscape.
This launch follows several similar crypto-focused ventures by VanEck in recent months.
VanEck Launches PYTH ETN
According to a recent press release, asset manager VanEck is listing a new exchange-traded note (ETN) based on PYTH today. The Pyth network is a decentralized oracle protocol that uses PYTH as a network token. PYTH’s value has risen slightly since this announcement, bucking a decline this month, but there has not been a substantial price jump.
This new ETN is one of several recent crypto project investments by VanEck. Earlier in October, the firm launched a $30 million venture fund aimed at crypto startups and, just last week, partnered with Kiln to offer Solana staking.
Read more: What Is a Blockchain Oracle? An Introductory Guide
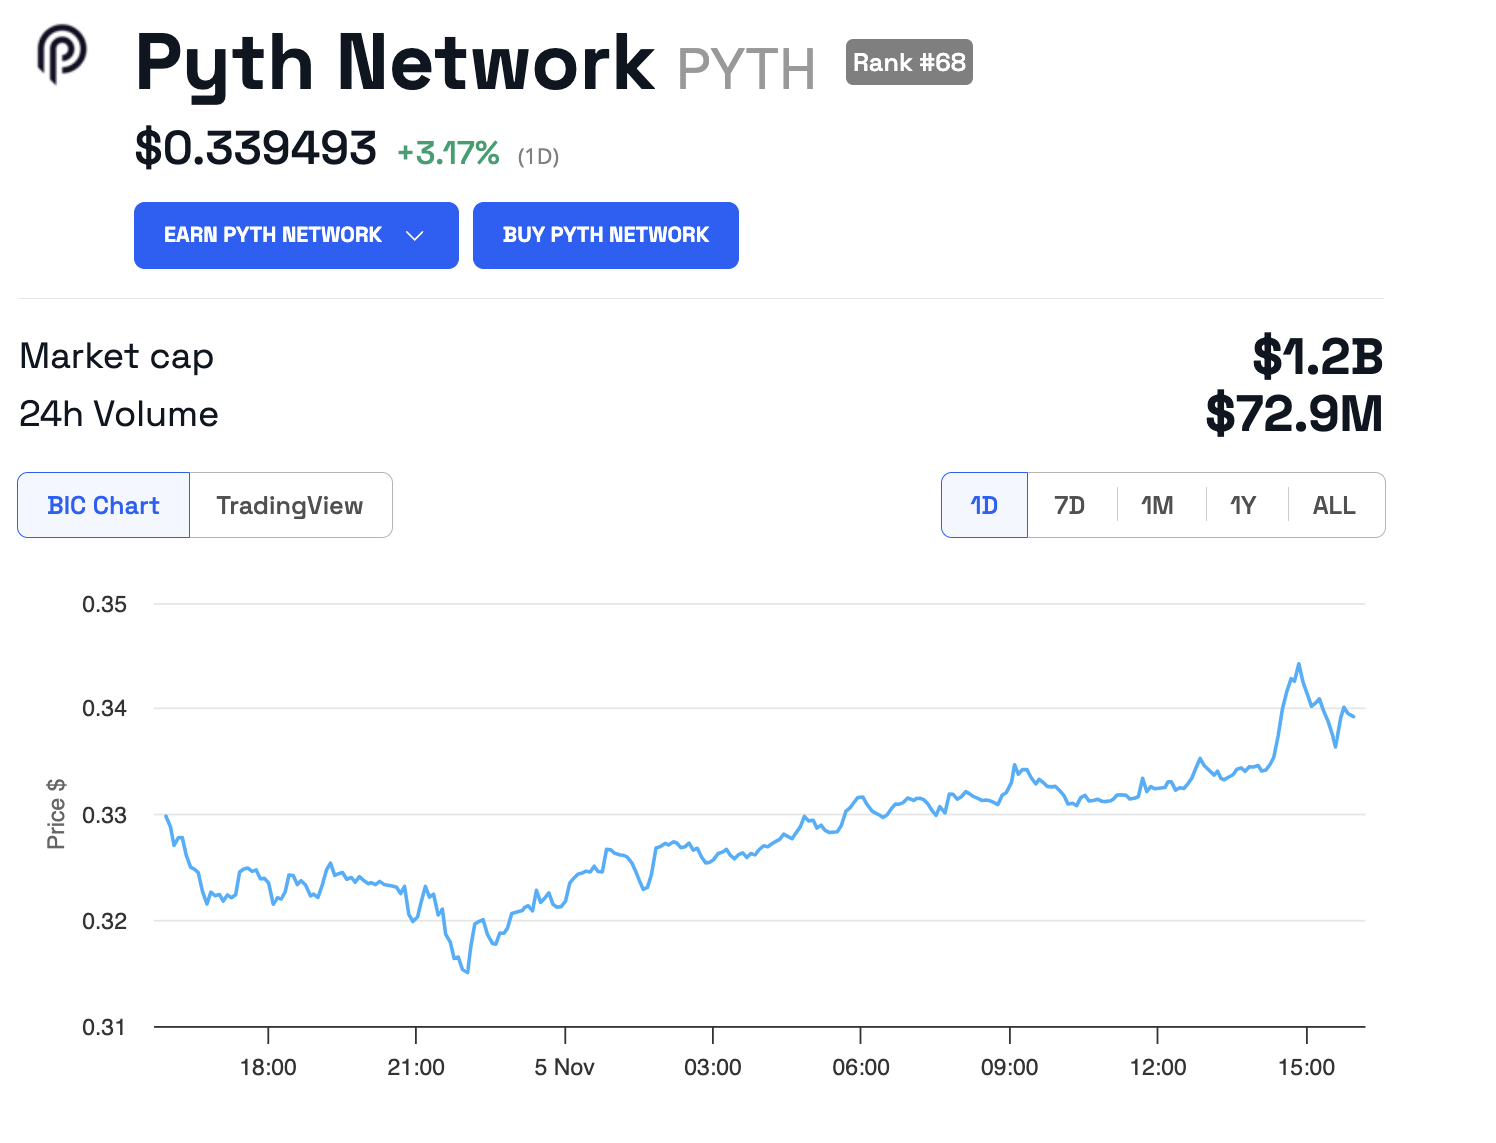
VanEck publicly stated that Pyth’s technical potential inspired its latest ETN offering. Listed on Euronext Paris and Euronext Amsterdam, the ETN is now available to investors. Although distinct from an ETF, it shares some similarities: its value is tied to PYTH, and VanEck secures the ETN’s underlying assets in cold storage.
“Smart contracts… are gaining increasing significance in the financial world… and oracle networks play a crucial role in enabling [their] real-world use. With our Pyth ETN, investors have the opportunity to participate in the development of… Pyth Network, which has the potential to become a crucial part of DeFi application infrastructure,” VanEck Europe CEO Martijn Rozemuller said.
Read more: Crypto ETN vs. Crypto ETF: What Is the Difference?
However, it remains unclear whether “underlying assets” specifically refers to PYTH tokens. The ETN’s value is derived from the MarketVector Pyth Network VWAP Close Index, which in turn tracks PYTH’s value indirectly. This layered approach to value calculation may help explain why PYTH’s price has remained relatively stable since the announcement.
The press release also notes that the ETN is available across 15 European countries under the ticker VYPT, with a total expense ratio of 1.5%. VanEck cautions twice in its statement about the “risk of extreme volatility” associated with the product.
Disclaimer
In adherence to the Trust Project guidelines, BeInCrypto is committed to unbiased, transparent reporting. This news article aims to provide accurate, timely information. However, readers are advised to verify facts independently and consult with a professional before making any decisions based on this content. Please note that our Terms and Conditions, Privacy Policy, and Disclaimers have been updated.
Market
BTC Futures Show Bullish Sentiment, Options Traders Cautious

After a surge in Bitcoin spot ETF inflows on April 2, yesterday’s market action painted a different picture as institutional investors began offloading BTC holdings.
Despite this retreat, futures traders remain confident, with open interest climbing and funding rates staying positive. However, the options market tells a different story, with traders showing less conviction in sustained upward momentum. As a key batch of BTC options nears expiration, all eyes are on how the market will respond to this divergence.
BTC Spot ETFs See $99.86 Million Outflow as Institutional Confidence Wavers
Institutional investors withdrew liquidity from BTC spot ETFs yesterday, resulting in a net outflow of $99.86 million.

This abrupt shift followed April 2’s $767 million net inflow, which ended a three-day streak of outflows. It signaled a brief return of institutional confidence before momentum quickly reversed.
Grayscale’s ETF GBTC saw the highest amount of fund exits, with a daily net outflow of $60.20 million, bringing its net assets under management to $22.60 billion.
However, BlackRock’s ETF IBIT stood out, witnessing a daily net inflow of $65.25 million. At press time, Bitcoin Spot ETFs have a total net asset value of $92.18 billion, plummeting 5% over the past 24 hours.
Bitcoin Derivatives Split as Traders Bet on Both Sides of the Market
Meanwhile, the derivatives market remains split—Bitcoin futures traders are leaning bullish, backed by rising open interest and positive funding rates. In contrast, options traders appear more hesitant, signaling uncertainty in the market’s next move.
At press time, Bitcoin futures open is $52.63 billion, up 2% over the past day. The coin’s funding rate remains positive and currently stands at 0.0084%.

Notably, amid the broader market dip, BTC’s price has noted a minor 0.34% decline during the review period.
When BTC’s price declines while its futures open interest rises and funding rates remain positive, it suggests that traders are increasing leveraged positions despite the price drop. The positive funding rate indicates that long positions remain dominant, meaning traders expect a rebound.
However, caution is advised. If BTC’s price continues to fall, it could trigger long liquidations as overleveraged positions get squeezed.
In contrast, the options market tells a different story, with traders showing less conviction in sustained upward momentum. This is evident from the high demand for put options.
According to Deribit, the notional value of BTC options expiring today is $2.17 billion, with a put-to-call ratio of 1.24. This confirms the prevalence of sales options among market participants.
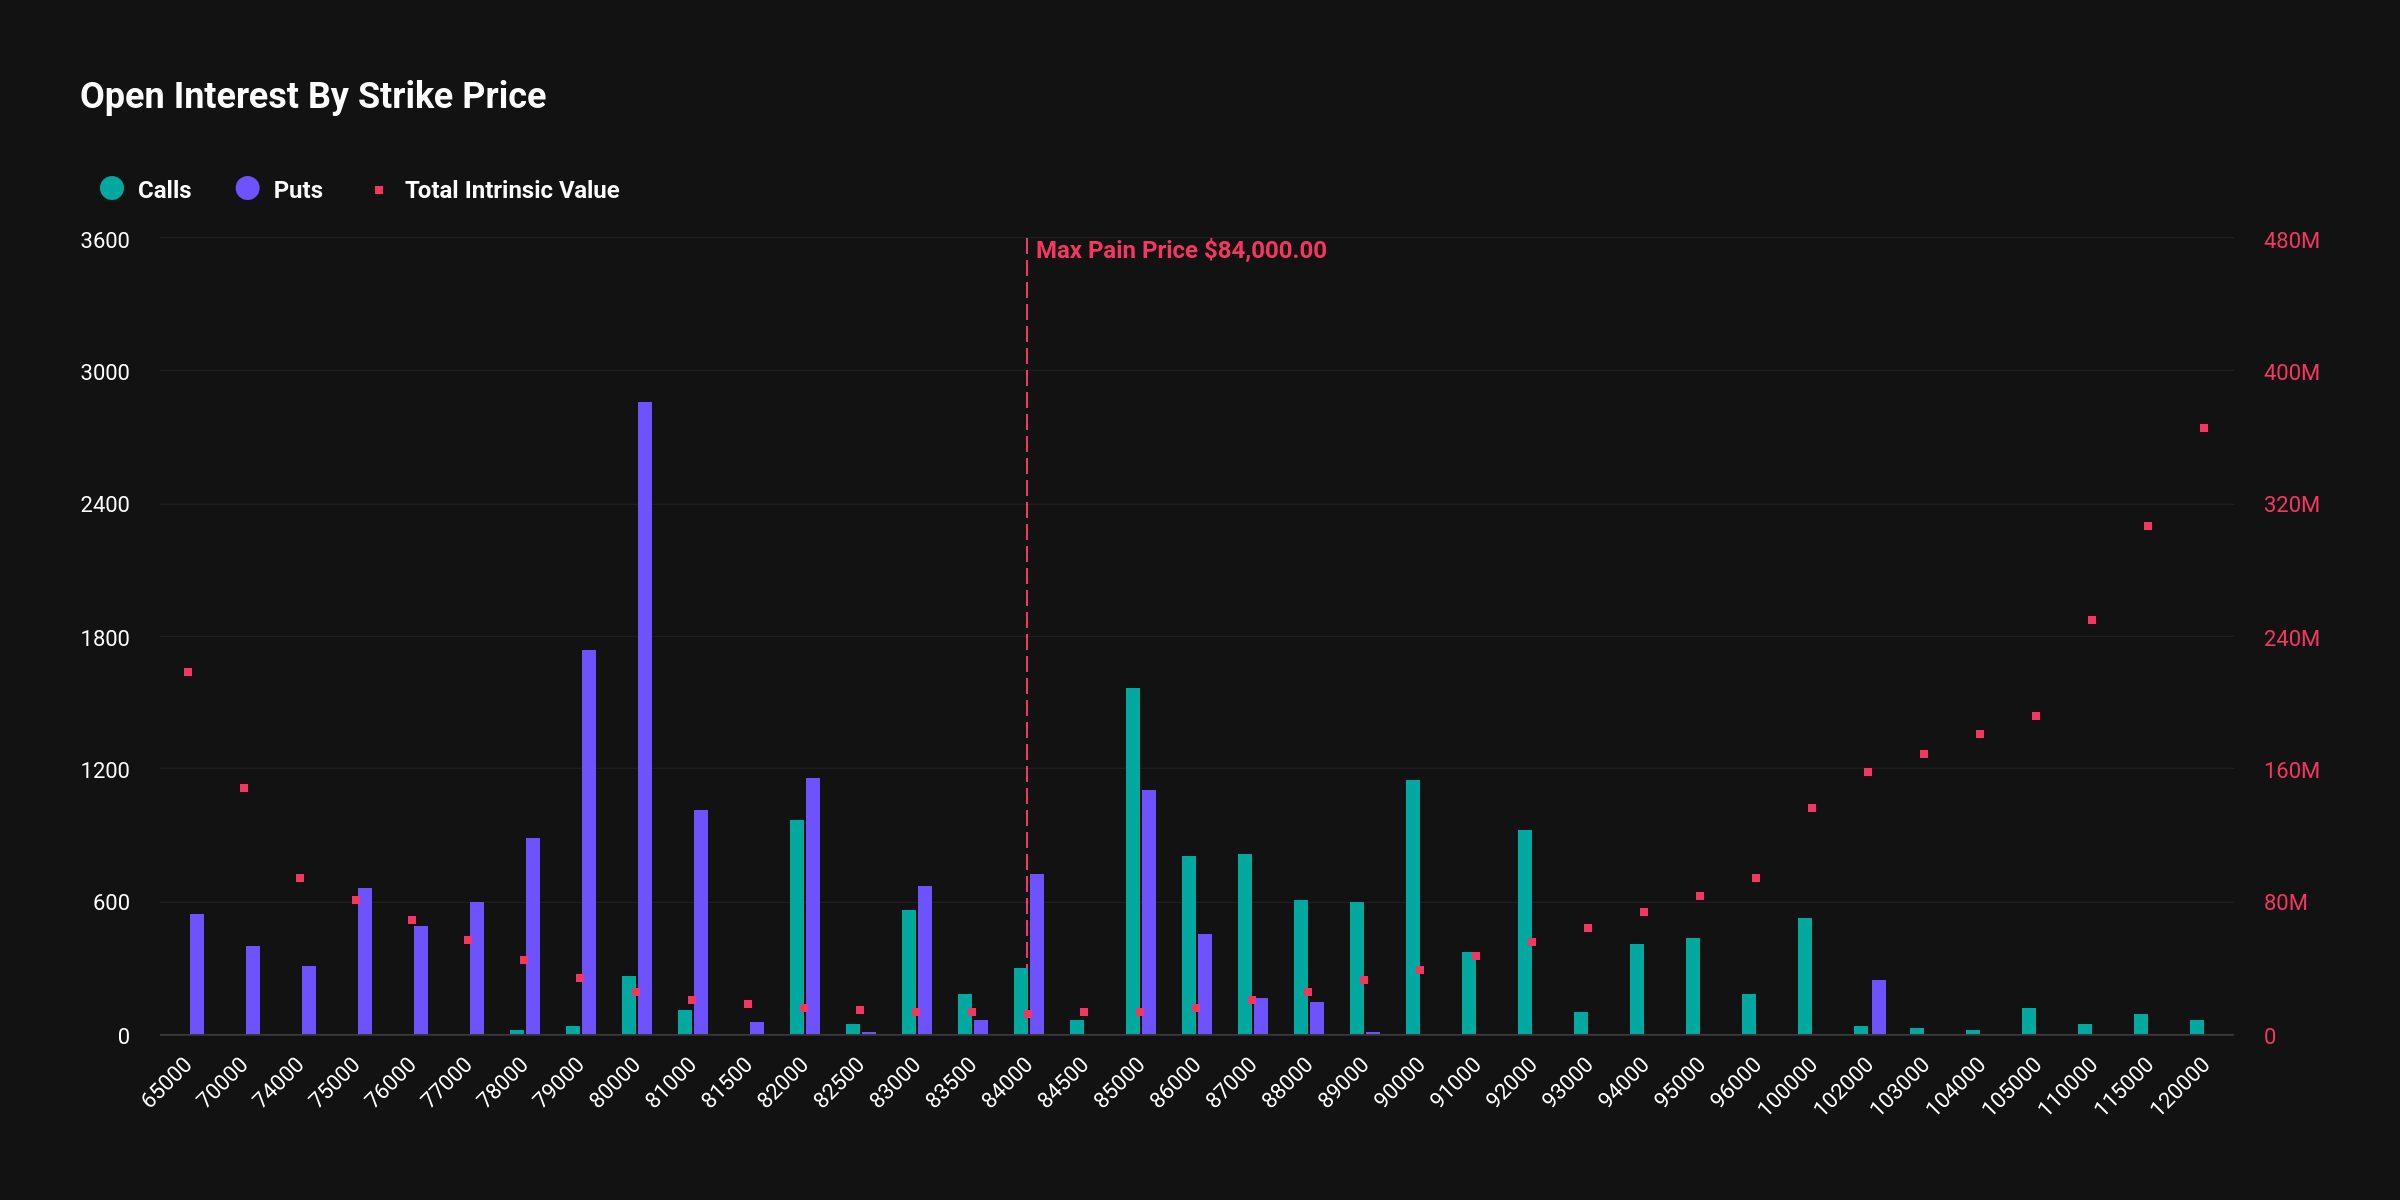
This divide between futures and options traders suggests a tug-of-war between bullish speculation and cautious hedging, potentially leading to heightened volatility in the near term.
Disclaimer
In line with the Trust Project guidelines, this price analysis article is for informational purposes only and should not be considered financial or investment advice. BeInCrypto is committed to accurate, unbiased reporting, but market conditions are subject to change without notice. Always conduct your own research and consult with a professional before making any financial decisions. Please note that our Terms and Conditions, Privacy Policy, and Disclaimers have been updated.
Market
What to Expect on May 7

The highly anticipated Pectra upgrade will launch on the Ethereum (ETH) mainnet on May 7, 2025, after overcoming a series of technical challenges and delays in the testnet phase.
Ethereum developers announced the date during the All Core Developers Consensus (ACDC) meeting on April 3, 2025.
Pectra Upgrade Countdown Begins
The upgrade was initially slated for a tentative mainnet launch on April 30. However, Ethereum developers have postponed the launch by one week.
“We’ll go ahead and lock in May 7 for Pectra on mainnet,” Ethereum Foundation researcher Alex Stokes said.
In preparation for this, Stokes confirmed that client releases will be made available by April 21, ensuring that all users have the necessary updates and tools ahead of the mainnet launch. On April 23, a detailed blog post outlining the Pectra mainnet will be published.
The Pectra upgrade will introduce 11 Ethereum Improvement Proposals (EIPs) to enhance various aspects of the network. Notably, three EIPs are dedicated to improving the validator experience.
The first is EIP-7251. This will increase the staking limit for validators from 32 ETH to 2,048 ETH per validator. This change aims to enhance capital efficiency for large stakers and staking pools.
“This simplifies the staking experience, allowing users to manage multiple validators under one node instead of several,” an analyst remarked.
Moreover, EIP-7002 introduces execution-layer triggerable withdrawals, giving validators more control. Meanwhile, EIP-6110 reduces the deposit processing delay from about 9 hours to just 13 minutes.
The upgrade will also include EIP-7702, a major step toward account abstraction. It allows Externally Owned Accounts (EOAs) to gain smart contract functionality while maintaining simplicity. This enables features like transaction batching, gas sponsorship (where third parties pay fees), passkey-based authentication, spending controls, and asset recovery mechanisms.
Finally, the upgrade increases blob capacity through EIP-7691. In addition, EIP-7623 helps manage the increased bandwidth requirements. These updates aim to make Ethereum more scalable, efficient, and user-friendly.
It is worth noting that the road to the mainnet launch has not been without hurdles. Two previous tests on the Holesky and Sepolia test networks failed to finalize properly. However, Pectra achieved full finalization on the Hoodi testnet on March 26, marking a significant milestone toward the successful deployment of the upgrade.
Despite the technical progress, ETH continues to face market challenges.

Data from BeInCrypto shows that ETH dropped 4.8% over the past week, with weekly losses extending to 17.1%. At the time of writing, the altcoin was trading at $1,822, reflecting a small daily gain of 0.8%.
Disclaimer
In adherence to the Trust Project guidelines, BeInCrypto is committed to unbiased, transparent reporting. This news article aims to provide accurate, timely information. However, readers are advised to verify facts independently and consult with a professional before making any decisions based on this content. Please note that our Terms and Conditions, Privacy Policy, and Disclaimers have been updated.
Market
XRP Futures and Illinois Lawsuit Relief

Coinbase filed with the US Commodity Futures Trading Commission (CFTC) to launch futures contracts for Ripple’s XRP token.
The move comes after a positive development for the crypto derivatives market in the US, reflecting shifting regulatory ties in the country.
Coinbase Files for XRP Futures Trading With CFTC
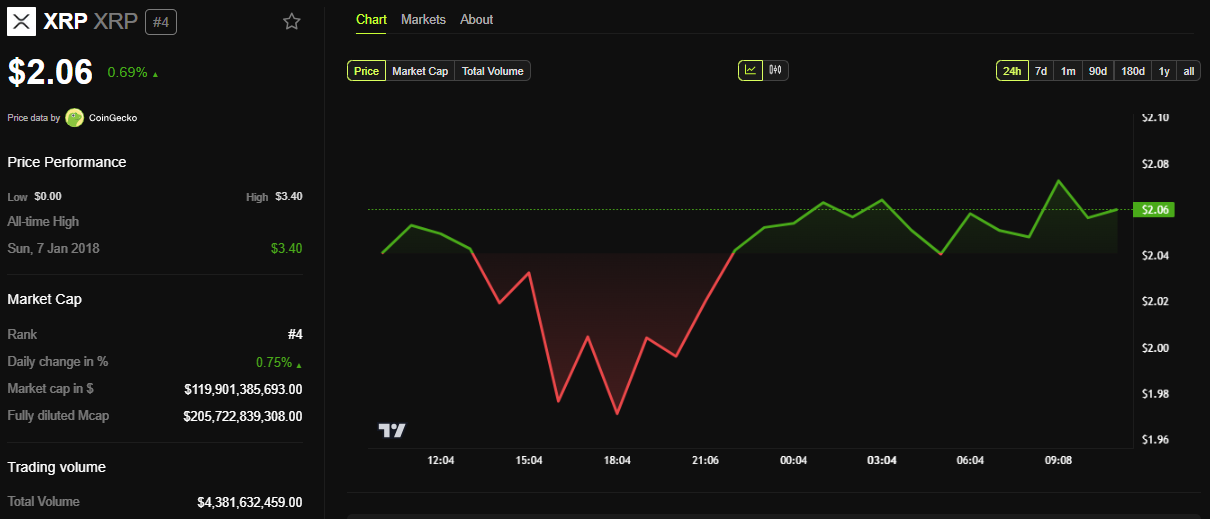
Coinbase Derivatives has submitted a filing to self-certify XRP futures. It will provide a regulated, capital-efficient means for market participants to gain exposure to XRP. The new contract could go live as soon as April 21.
“We’re excited to announce that Coinbase Derivatives has filed with the CFTC to self-certify XRP futures – bringing a regulated, capital-efficient way to gain exposure to one of the most liquid digital assets. We anticipate the contract going live on April 21, 2025,” read the announcement.
Meanwhile, the official filing indicates that the XRP futures contract will be a monthly cash-settled and margined contract trading under the symbol XRL.
Each contract represents 10,000 XRP and will be settled in US dollars. Trading will be available for the current month and two subsequent months. As a protective measure, trading will be temporarily halted if the spot XRP price moves more than 10% within an hour.
The Coinbase Exchange also confirmed that it has engaged with Futures Commission Merchants (FCMs) and other market participants. Both references reportedly expressed support for the launch.
However, Coinbase is not the first US-based exchange to introduce regulated XRP futures. In March, Chicago-based Bitnomial launched what it advertised as the country’s first CFTC-regulated XRP futures contract.
For Coinbase, however, the boldness comes after the CFTC eased key regulatory hurdles for crypto derivatives trading. As BeInCrypto reported, this signaled a more accommodating stance towards the sector.
“Pursuant to Commodity Futures Trading Commission (“CFTC” or “Commission”) Regulation 40.2(a), Coinbase Derivatives, LLC (the “Exchange” or “COIN”) hereby submits for self-certification its initial listing of the XRP Futures contract to be offered for trading on the Exchange…,” an excerpt in the filing indicated.
This suggests that the commodities regulator’s shift, revoking previous crypto-related guidelines, may boost institutional confidence. For XRP, this development bolsters confidence in the asset’s previously contentious status following Ripple’s recent regulatory breakthrough.
“Coinbase Derivatives’ filing with the CFTC to self-certify XRP futures aims to legitimize XRP trading by offering a regulated, capital-efficient product for investors,” one user remarked.
The futures contract might also help the odds of XRP ETF approval. Recently, the SEC delayed several applications to create one, and its status is in limbo.
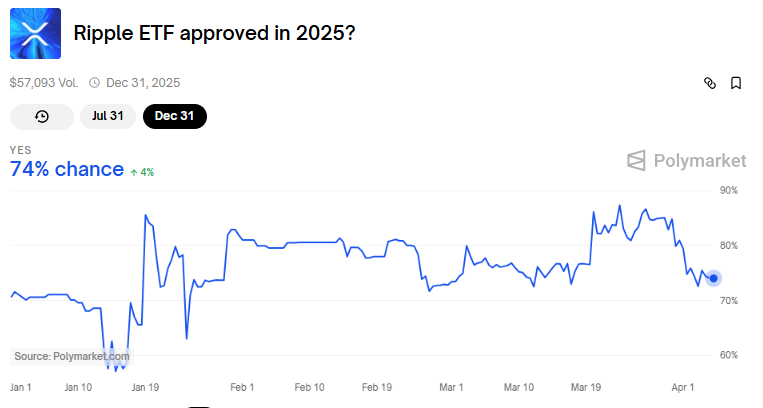
Data on Polymarket shows bettors see a 74% chance for XRP ETF approval in 2025 and a more modest 34% by July 31.
Regulatory and Legal Developments Favor Coinbase
Elsewhere, the timing of this filing aligns with recent favorable regulatory developments for Coinbase. Reports suggest Illinois intends to drop its lawsuit against the exchange over its staking services.
Up to 10 states filed a lawsuit against Coinbase in June 2023 alleging that its staking program constituted unregistered securities offerings.
This recent development makes Illinois the fourth state to withdraw legal action against Coinbase. Vermont, South Carolina, and Kentucky also dismissed their cases on March 13, 27, and 31, respectively.
However, the cases remain active in Alabama, California, Maryland, New Jersey, Washington and Wisconsin.
These legal retreats coincide with the US SEC’s (Securities and Exchange Commission) February decision to abandon its federal lawsuit against Coinbase. BeInCrypto reported that this development marked a broader shift in the regulatory approach under the current administration.
“Regulators are losing steam, and Coinbase is stacking quiet courtroom wins. Staking’s future in the US might just be back on track,” a user commented.
Illinois’ decision to drop its lawsuit comes as the state advances a Bitcoin strategic reserve bill. Specifically, Illinois State Representative John M. Cabello introduced House Bill 1844 (HB1844), highlighting Bitcoin’s potential as a decentralized, finite digital asset.
“A strategic bitcoin reserve aligns with Illinois’ commitment to fostering innovation in digital assets and providing Illinoisans with enhanced financial security,” the bill read.
Disclaimer
In adherence to the Trust Project guidelines, BeInCrypto is committed to unbiased, transparent reporting. This news article aims to provide accurate, timely information. However, readers are advised to verify facts independently and consult with a professional before making any decisions based on this content. Please note that our Terms and Conditions, Privacy Policy, and Disclaimers have been updated.
-

 Market21 hours ago
Bitcoin’s Future After Trump Tariffs
-

 Market23 hours ago
10 Altcoins at Risk of Binance Delisting
-

 Market22 hours ago
EDGE Goes Live, RSR Added to Roadmap
-

 Regulation20 hours ago
US Senate Banking Committee Approves Paul Atkins Nomination For SEC Chair Role
-

 Market18 hours ago
Binance Managed 94% of All Crypto Airdrops and Staking Rewards
-

 Market20 hours ago
TRUMP Token Hits Record Low Due To Liberation Day Tariffs
-

 Market19 hours ago
Pi Network Price Falls To Record New Low Amid Weak Inflows
-
 Regulation17 hours ago
US SEC Acknowledges Fidelity’s Filing for Solana ETF


