
Market
Will Toncoin Short-Term Holders Help the Price Rebound?

Toncoin (TON), the Telegram-native cryptocurrency, has seen its price decrease by 17% within the last 30 days. As a result, TON’s price fell below $5 before a slight bounce.
Despite this decline, the cryptocurrency’s price could be in line to recover some losses. This assertion is due to the change in sentiment of Toncoin short-term holders, which this on-chain analysis reveals.
Toncoin Holders Push for Recovery
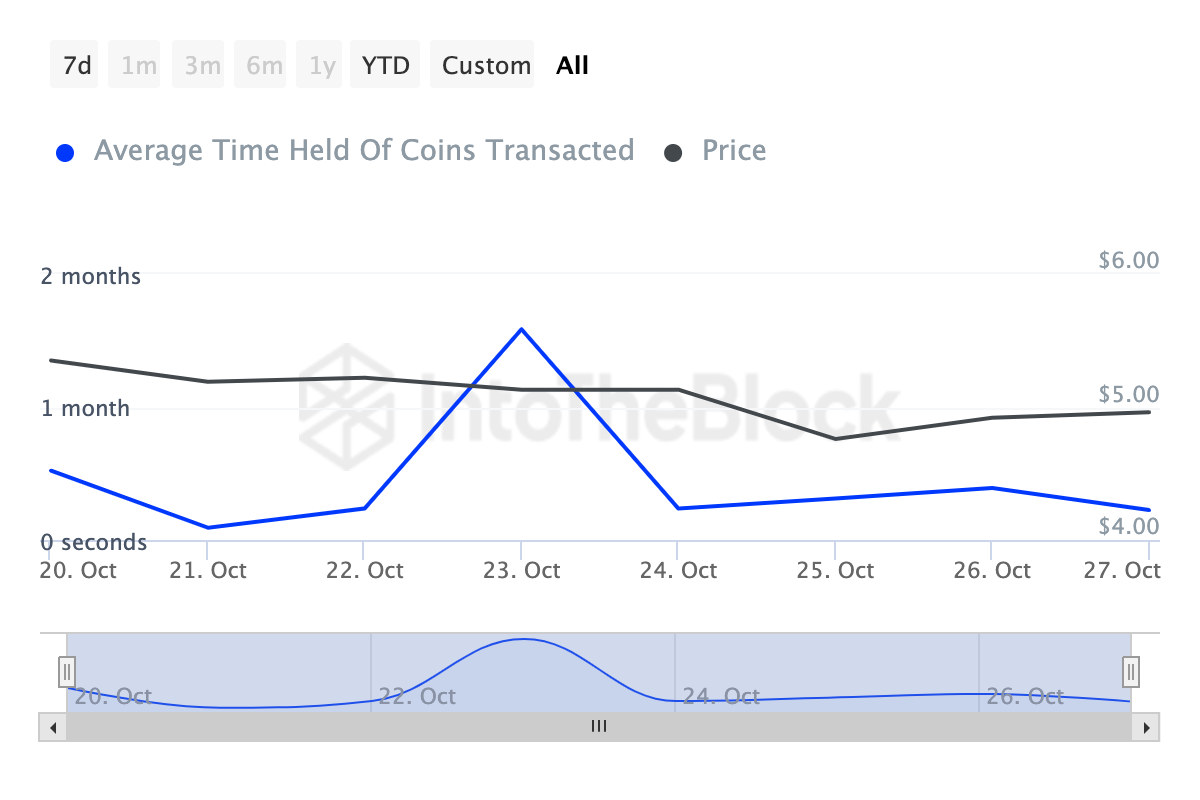
While TON’s price might have fallen below $5, IntoTheBlock data shows that the token’s Coins Holding Time has increased. Within the last seven days, this metric, which measures the amount of time a cryptocurrency has been held without being sold, is up 142%
Typically, when the holding time decreases, short-term holders have lost confidence in a crypto’s potential. However, since it increased, it indicates that Toncoin short-term holders believe that a rebound could be close.
For that to happen, the token’s Coins Holding Time has to sustain this momentum. If that happens, then Toncoin’s price might not add to its month-long 17% decline.
Read more: What Are Telegram Bot Coins?
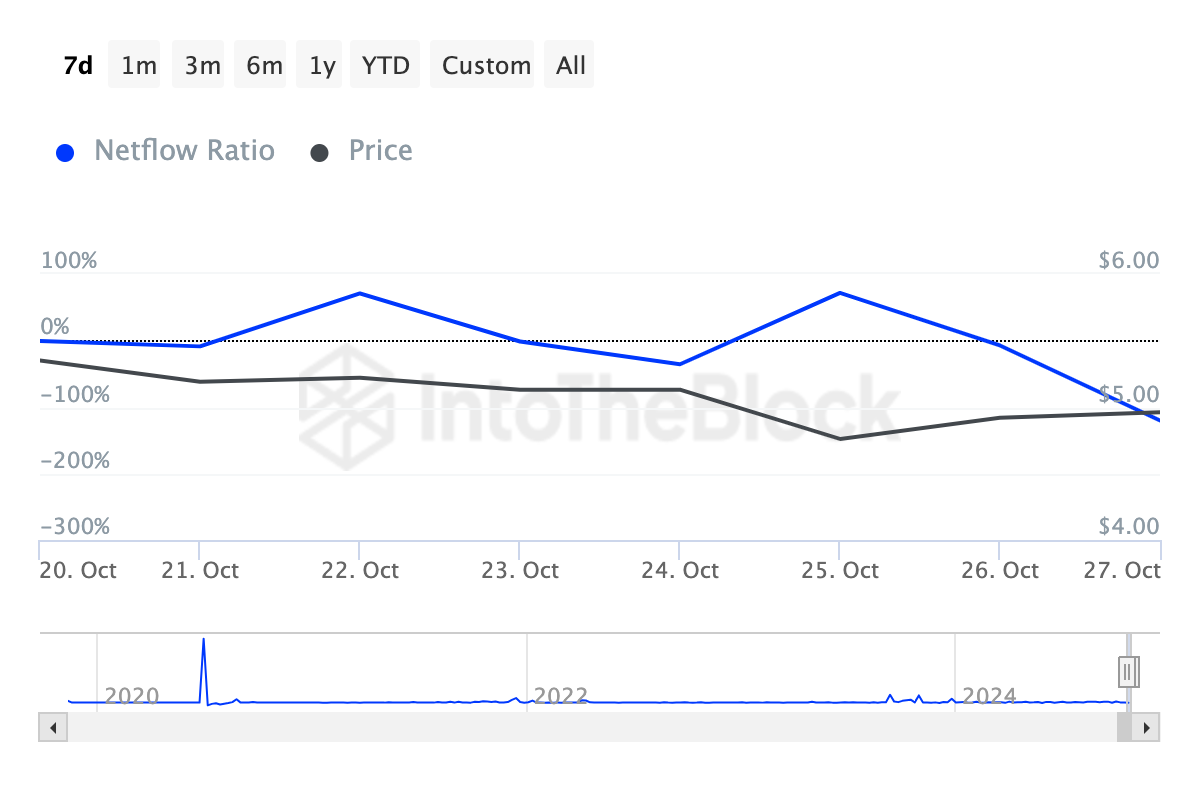
Another metric supporting this bias is the Large Holder Netflow to Exchange Ratio. This metric basically shows whether large holders of a cryptocurrency are sending more tokens to an exchange.
When the ratio rises, it indicates that these stakeholders are transferring more tokens to exchanges, often signaling an intent to sell. Conversely, a drop in the ratio suggests investors are holding back on selling as they avoid sending tokens to centralized platforms.
Therefore, the decline, as seen below, indicates that Toncoin whales have refrained from liquidating their assets. Should that remain the same, it could have a positive impact on TON’s price.
TON Price Prediction: Rally to $6 Begins
From a technical point of view, Toncoin is witnessing a massive rise in the Money Flow Index (MFI). The MFI, as the name implies, refers to the rate at which liquidity is entering a cryptocurrency.
A higher MFI signals increased buying pressure, while a lower MFI points to rising selling pressure, often implying a potential price drop. For TON, with buying pressure currently elevated, this suggests the cryptocurrency could push beyond $5.22.
Leveraging the Fibonacci indicator—which identifies key support and resistance levels—a continued rise in buying pressure might drive Toncoin’s price up to $6.15.
Read more: 6 Best Toncoin (TON) Wallets in 2024
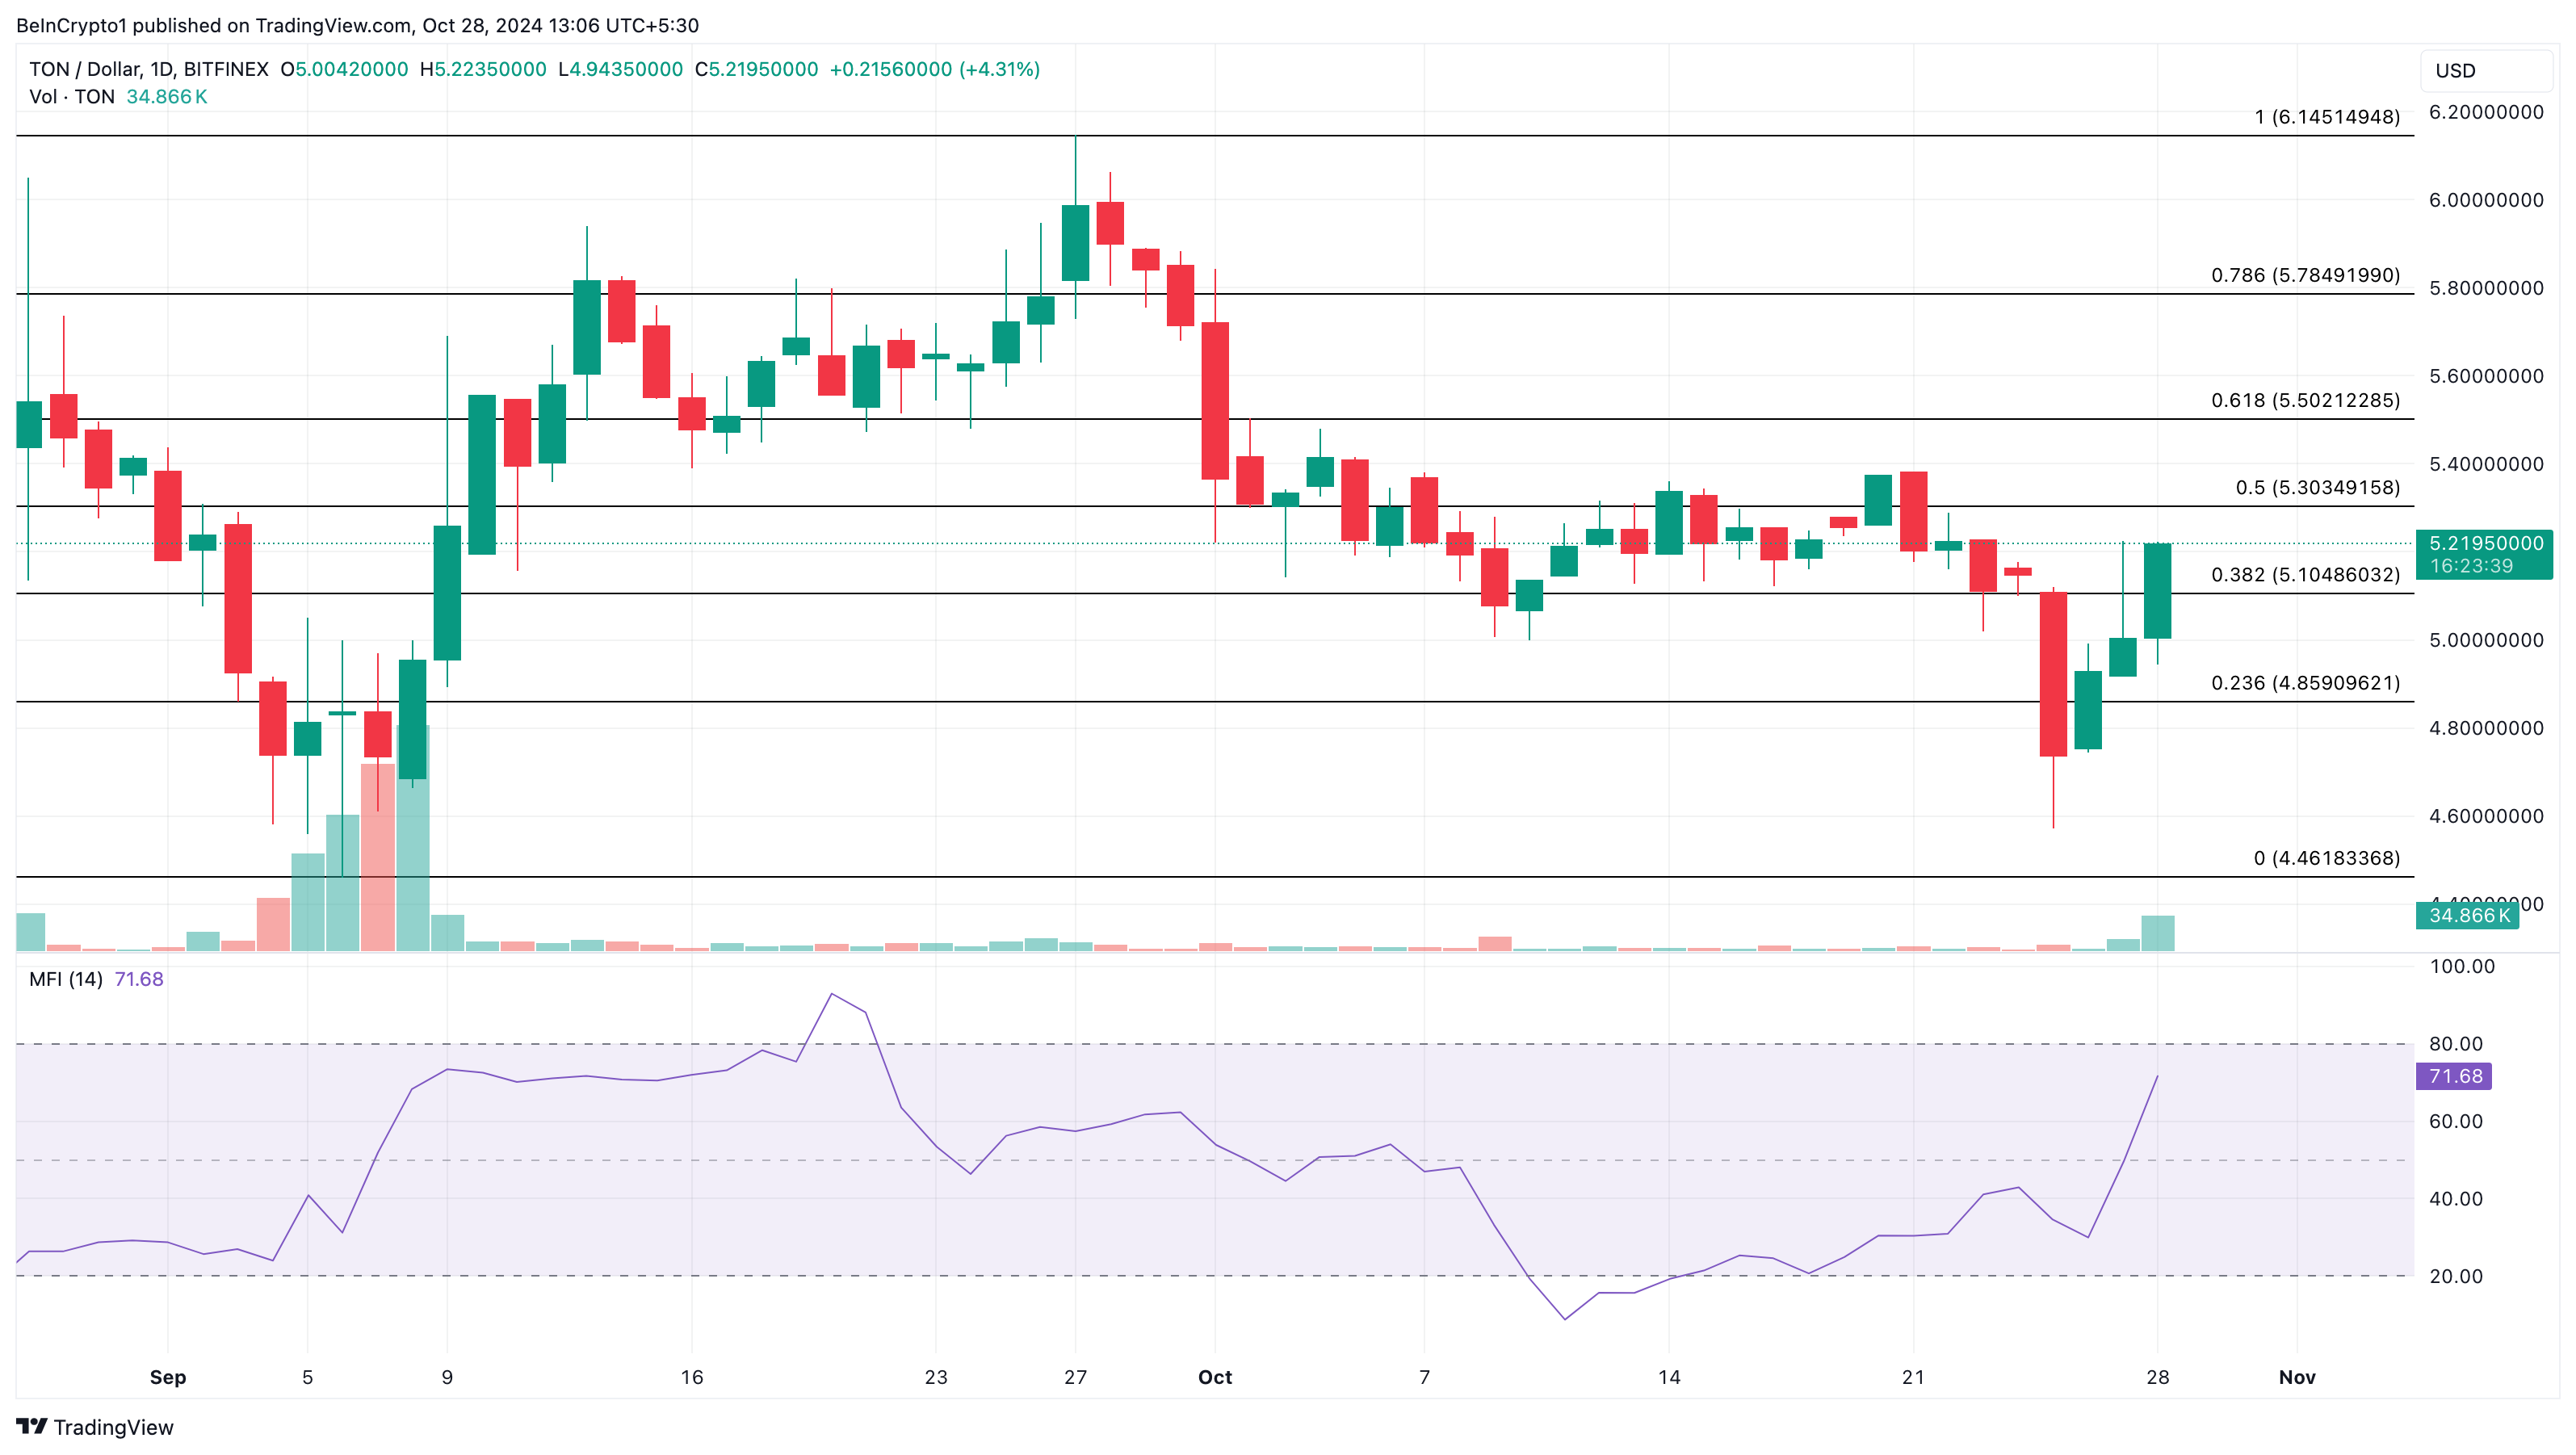
However, if Toncoin short-term holders opt to sell some assets, this upward trajectory could be disrupted, potentially causing the price to slide back to $4.46.
Disclaimer
In line with the Trust Project guidelines, this price analysis article is for informational purposes only and should not be considered financial or investment advice. BeInCrypto is committed to accurate, unbiased reporting, but market conditions are subject to change without notice. Always conduct your own research and consult with a professional before making any financial decisions. Please note that our Terms and Conditions, Privacy Policy, and Disclaimers have been updated.


Reason to trust
![]()
Strict editorial policy that focuses on accuracy, relevance, and impartiality
Created by industry experts and meticulously reviewed
The highest standards in reporting and publishing
Strict editorial policy that focuses on accuracy, relevance, and impartiality
Morbi pretium leo et nisl aliquam mollis. Quisque arcu lorem, ultricies quis pellentesque nec, ullamcorper eu odio.
Ethereum price started a recovery wave above the $1,850 level. ETH is now consolidating and facing key hurdles near the $1,920 level.
- Ethereum started a recovery wave above $1,820 and $1,850 levels.
- The price is trading above $1,860 and the 100-hourly Simple Moving Average.
- There is a connecting bullish trend line forming with support at $1,860 on the hourly chart of ETH/USD (data feed via Kraken).
- The pair must clear the $1,900 and $1,920 resistance levels to start a decent increase.
Ethereum Price Starts Recovery
Ethereum price managed to stay above the $1,750 support zone and started a recovery wave, like Bitcoin. ETH was able to climb above the $1,820 and $1,850 resistance levels.
The bulls even pushed the price above the $1,880 resistance zone. There was a move above the 50% Fib retracement level of the downward wave from the $2,032 swing high to the $1,767 low. However, the bears are active near the $1,920 zone.
Ethereum price is now trading above $1,850 and the 100-hourly Simple Moving Average. There is also a connecting bullish trend line forming with support at $1,860 on the hourly chart of ETH/USD.
On the upside, the price seems to be facing hurdles near the $1,900 level. The next key resistance is near the $1,920 level and the 61.8% Fib retracement level of the downward wave from the $2,032 swing high to the $1,767 low.

The first major resistance is near the $1,970 level. A clear move above the $1,970 resistance might send the price toward the $2,020 resistance. An upside break above the $2,020 resistance might call for more gains in the coming sessions. In the stated case, Ether could rise toward the $2,050 resistance zone or even $2,120 in the near term.
Another Decline In ETH?
If Ethereum fails to clear the $1,920 resistance, it could start another decline. Initial support on the downside is near the $1,860 level and the trend line. The first major support sits near the $1,845 zone.
A clear move below the $1,845 support might push the price toward the $1,800 support. Any more losses might send the price toward the $1,765 support level in the near term. The next key support sits at $1,710.
Technical Indicators
Hourly MACD – The MACD for ETH/USD is losing momentum in the bullish zone.
Hourly RSI – The RSI for ETH/USD is now above the 50 zone.
Major Support Level – $1,860
Major Resistance Level – $1,920

Reason to trust
![]()
Strict editorial policy that focuses on accuracy, relevance, and impartiality
Created by industry experts and meticulously reviewed
The highest standards in reporting and publishing
Strict editorial policy that focuses on accuracy, relevance, and impartiality
Morbi pretium leo et nisl aliquam mollis. Quisque arcu lorem, ultricies quis pellentesque nec, ullamcorper eu odio.
Bitcoin price started a recovery wave above the $83,500 zone. BTC is now consolidating and might struggle to settle above the $85,500 zone.
- Bitcoin started a decent recovery wave above the $83,500 zone.
- The price is trading above $83,000 and the 100 hourly Simple moving average.
- There is a connecting bullish trend line forming with support at $84,500 on the hourly chart of the BTC/USD pair (data feed from Kraken).
- The pair could start another increase if it stays above the $83,500 zone.
Bitcoin Price Starts Recovery
Bitcoin price managed to stay above the $82,000 support zone. BTC formed a base and recently started a decent recovery wave above the $82,500 resistance zone.
The bulls were able to push the price above the $83,500 and $84,200 resistance levels. The price even climbed above the $85,000 resistance. A high was formed at $85,487 and the price is now consolidating gains above the 23.6% Fib retracement level of the upward move from the $81,320 swing low to the $85,487 high.
Bitcoin price is now trading above $83,500 and the 100 hourly Simple moving average. There is also a connecting bullish trend line forming with support at $84,550 on the hourly chart of the BTC/USD pair.

On the upside, immediate resistance is near the $85,200 level. The first key resistance is near the $85,500 level. The next key resistance could be $85,850. A close above the $85,850 resistance might send the price further higher. In the stated case, the price could rise and test the $86,650 resistance level. Any more gains might send the price toward the $88,000 level or even $88,500.
Another Decline In BTC?
If Bitcoin fails to rise above the $85,500 resistance zone, it could start a fresh decline. Immediate support on the downside is near the $84,500 level and the trend line. The first major support is near the $83,500 level and the 50% Fib retracement level of the upward move from the $81,320 swing low to the $85,487 high.
The next support is now near the $82,850 zone. Any more losses might send the price toward the $82,000 support in the near term. The main support sits at $80,500.
Technical indicators:
Hourly MACD – The MACD is now losing pace in the bullish zone.
Hourly RSI (Relative Strength Index) – The RSI for BTC/USD is now above the 50 level.
Major Support Levels – $84,500, followed by $83,500.
Major Resistance Levels – $85,200 and $85,500.

Reason to trust
![]()
Strict editorial policy that focuses on accuracy, relevance, and impartiality
Created by industry experts and meticulously reviewed
The highest standards in reporting and publishing
Strict editorial policy that focuses on accuracy, relevance, and impartiality
Morbi pretium leo et nisl aliquam mollis. Quisque arcu lorem, ultricies quis pellentesque nec, ullamcorper eu odio.
Recent XRP price action has sparked a new prediction from a crypto analyst, as a potential Head and Shoulders pattern emerges on the chart. The analyst warns that this technical formation could trigger a significant price correction for XRP, describing this downturn as the worst-case scenario.
Analyst Predicts XRP Price Crash To $1.15
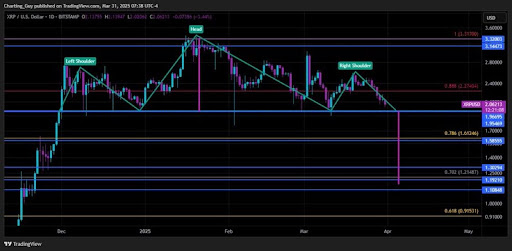
The ‘Charting Guy,’ a pseudonymous crypto analyst on X (formerly Twitter), has unveiled a potential Head and Shoulder pattern formation on the XRP price chart. The analyst has shared insights into the implications of this technical pattern, projecting a potential crash in the XRP price.
Related Reading
As a well-known bearish reversal pattern, the formation of a Head and Shoulder in the XRP price chart suggests a potential shift from an uptrend to a downtrend. Typically, a Head and Shoulder pattern consists of three peaks: the Left Shoulder, Head, and Right Shoulder. However, the Charting Guy has confirmed that XRP’s current pattern formation consists of two right shoulders and one head. Due to this irregularity, the analyst has expressed doubt about the possibility of the pattern playing out.
If the Head and Shoulder pattern eventually takes shape, it could lead to a significant drop in the XRP price, potentially bringing it down to as low as $1.15. This price level aligns with a key Fibonacci Golden Pocket retracement zone between 0.618 – 0.786.
Notably, the analyst has described this projected price crash as the worst-case scenario for XRP. While he believes a bearish move is possible, the analyst is confident that XRP’s broader market structure is bullish.
Moreover, the Charting Guy argues that if XRP does decline to $1.15, it would likely serve as a healthy retracement in an overall bullish trend. He noted that XRP’s price has been holding the $2 level on daily closes, meaning its price action remains strong above support levels. This also indicates the possibility of an uptrend resumption that could yield higher highs and higher lows for XRP.
Key Support And Resistance Levels To Watch
The Charting Guy’s analysis of XRP’s potential Head and Shoulder pattern formation highlights several critical price levels to watch. Since XRP has consistently closed daily candles above $2, the analyst has determined this level as short-term support.
Related Reading
XRP has also been wicking during recent pullbacks in a crucial range between $1.7 and $1.9. As a result, the crypto analyst has revealed that he will be watching this area closely for a potential price bounce.
The Golden Pocket retracement zone, which represents the worst-case scenario for the XRP price, is between $1.15 and $1.30. If XRP experiences a deeper price correction, lower support levels have been marked from $1.19 to $0.91.
For its resistance levels, the Charting Guy has pinpointed $2.27 as a key price point. Additionally, $3.14 – $3.32 has been identified as an upper resistance range where XRP could rally if bullish momentum resumes.
Featured image from Medium, chart from Tradingview.com

Ethereum Price Approaches Resistance—Will It Smash Through?

Tether Expands Bitcoin Reserves with 8,888 BTC Buy—What’s the Plan?

Bitcoin Price Bounces Back—Can It Finally Break Resistance?

Analyst Reveals ‘Worst Case Scenario’ With Head And Shoulders Formation

BeInCrypto US Morning Briefing: Standard Chartered and Bitcoin
SUI Price Stalls After Major $147 Million Token Unlock

2.52 Million Altcoins Are Ruining Crypto’s Future

Animoca Brands Valuation Tanks 75% In Two Years, Here’s Why

Crypto exchange BingX hacked for $43 million

Are The Big Players Losing Interest?

Hong Kong’s Securities Association Tips Authorities On Crypto Self-Regulation

Coinbase cbBTC Set to go Live on Solana
2.52 Million Altcoins Are Ruining Crypto’s Future
Animoca Brands Valuation Tanks 75% In Two Years, Here’s Why
Crypto exchange BingX hacked for $43 million
Are The Big Players Losing Interest?
Hong Kong’s Securities Association Tips Authorities On Crypto Self-Regulation
Coinbase cbBTC Set to go Live on Solana
-

 Ethereum23 hours ago
$2,300 Emerges As The Most Crucial Resistance
-

 Market20 hours ago
Bitcoin Price Battles Key Hurdles—Is a Breakout Still Possible?
-

 Market23 hours ago
CFTC’s Crypto Market Overhaul Under New Chair Brian Quintenz
-
 Altcoin22 hours ago
A Make or Break Situation As Ripple Crypto Flirts Around $2
-
 Market21 hours ago
Is CZ’s April Fool’s Joke a Crypto Reality or Just Fun?
-

 Bitcoin18 hours ago
Big Bitcoin Buy Coming? Saylor Drops a Hint as Strategy Shifts
-

 Bitcoin17 hours ago
$500 Trillion Bitcoin? Saylor’s Bold Prediction Shakes the Market!
-

 Market24 hours ago
Solana (SOL) Holds Steady After Decline—Breakout or More Downside?