
Market
GOAT Meme Coin Price Hits New All-Time High

Goatseus Maximus (GOAT), the AI-based meme coin trending recently, has hit a new all-time high after Binance announced that it would list the cryptocurrency. Following this development, the GOAT meme coin price climbed to $0.88.
This development has sparked speculation in the market, with some suggesting that the market cap could surpass $1 billion. Will that happen?
Binance Futures Listing Pushes the Volume Higher
According to the Binance announcement earlier today, the exchange will list the GOAT meme coin on the futures market, and users will be able to trade the meme coin using up to 75x leverage.
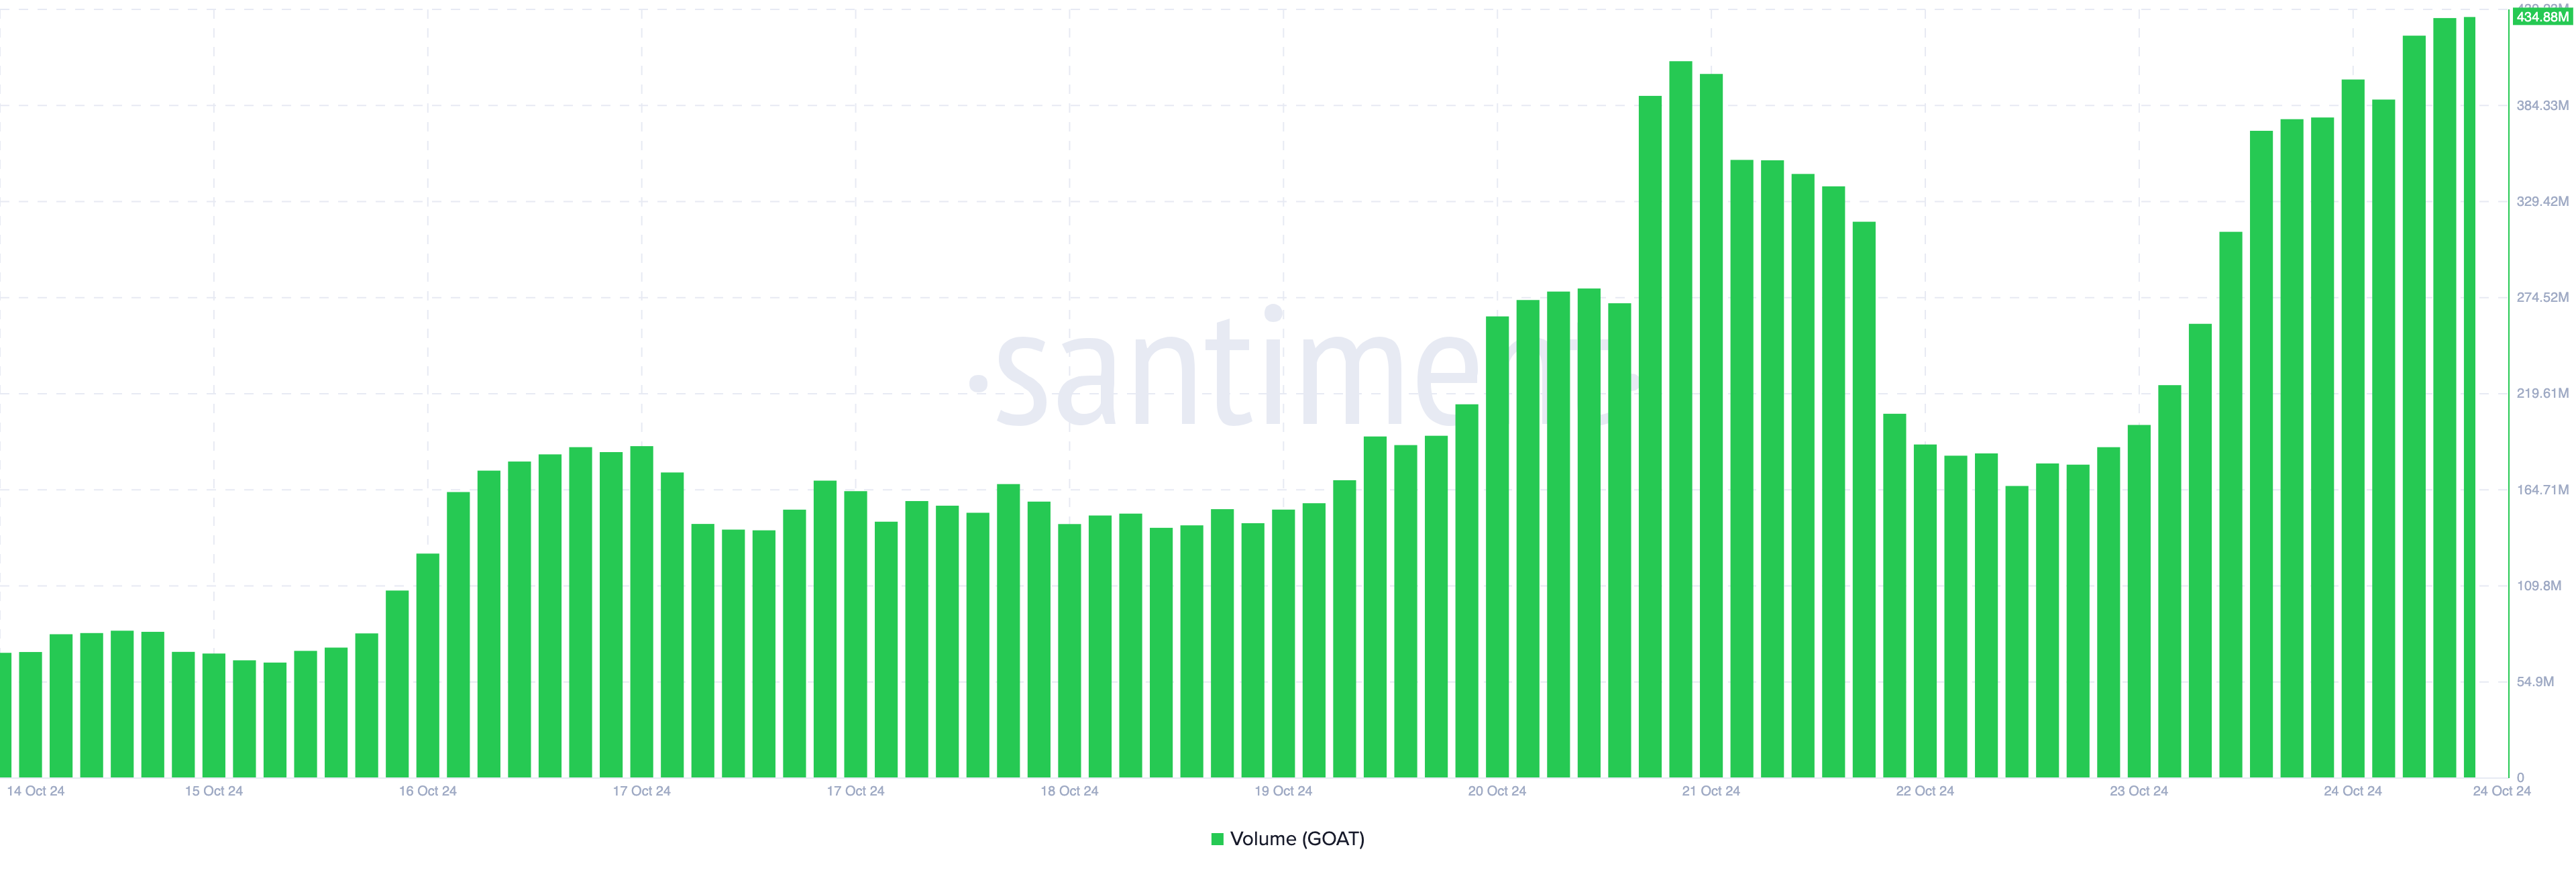
Before the disclosure, GOAT’s price was $0.77. But after that, the crypto’s value surged to $0.88 before it pulled back slightly to $0.85. Following the development, the volume surged to a new high of $434.88 million.
In the crypto market, trading volume represents the total number of coins or tokens traded over a specific period. It is a crucial metric that offers insights into market activity and liquidity, helping to gauge the strength and interest in a particular cryptocurrency.
Read More: Binance P2P Guide: Understanding What It Is and How It Works
If sustained, the rising trading volume, coupled with GOAT’s surging value, could push the price above $0.88. Additionally, the Binance futures listing allows more traders to gain exposure to the AI-driven meme coin.
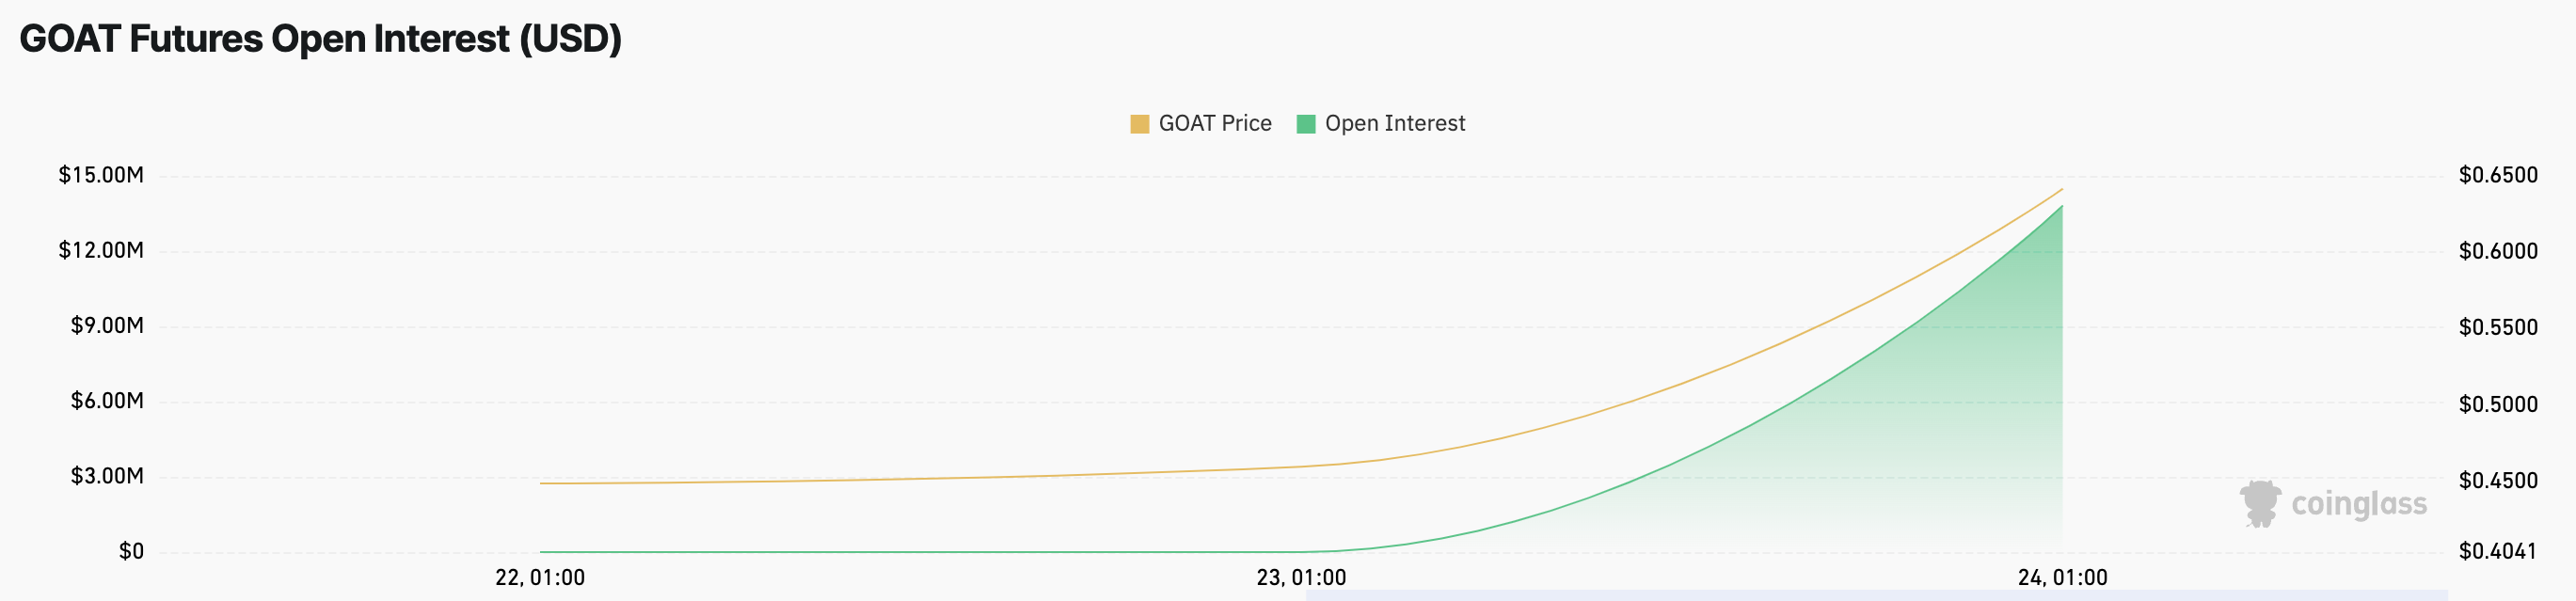
This trend appears to be taking shape as Open Interest (OI) continues to climb. According to Coinglass, OI in GOAT has surged by 272% in the last 24 hours, reaching $13.82 million, indicating growing interest from the market.
High Open Interest, by itself, signifies strong momentum behind the current market trend. Therefore, if the OI continues to increase, the GOAT’s uptrend will likely persist.
GOAT Price Prediction: Decline Before Rebound
On the 4-hour chart, the GOAT meme coin price has pulled back from $0.88 and is at $0.78. This retracement could be because the meme coin is overbought. For instance, the Bollinger Bands (BB) on the chart shows that the upper line of the indicator has touched GOAT’s price.
While this indicates rising volatility around it, it also indicates that the token has been overbought, as mentioned earlier. Assuming the lower band of the BB touched the price, then it would have been deemed oversold.
Read More: 11 Top Solana Meme Coins to Watch in October 2024
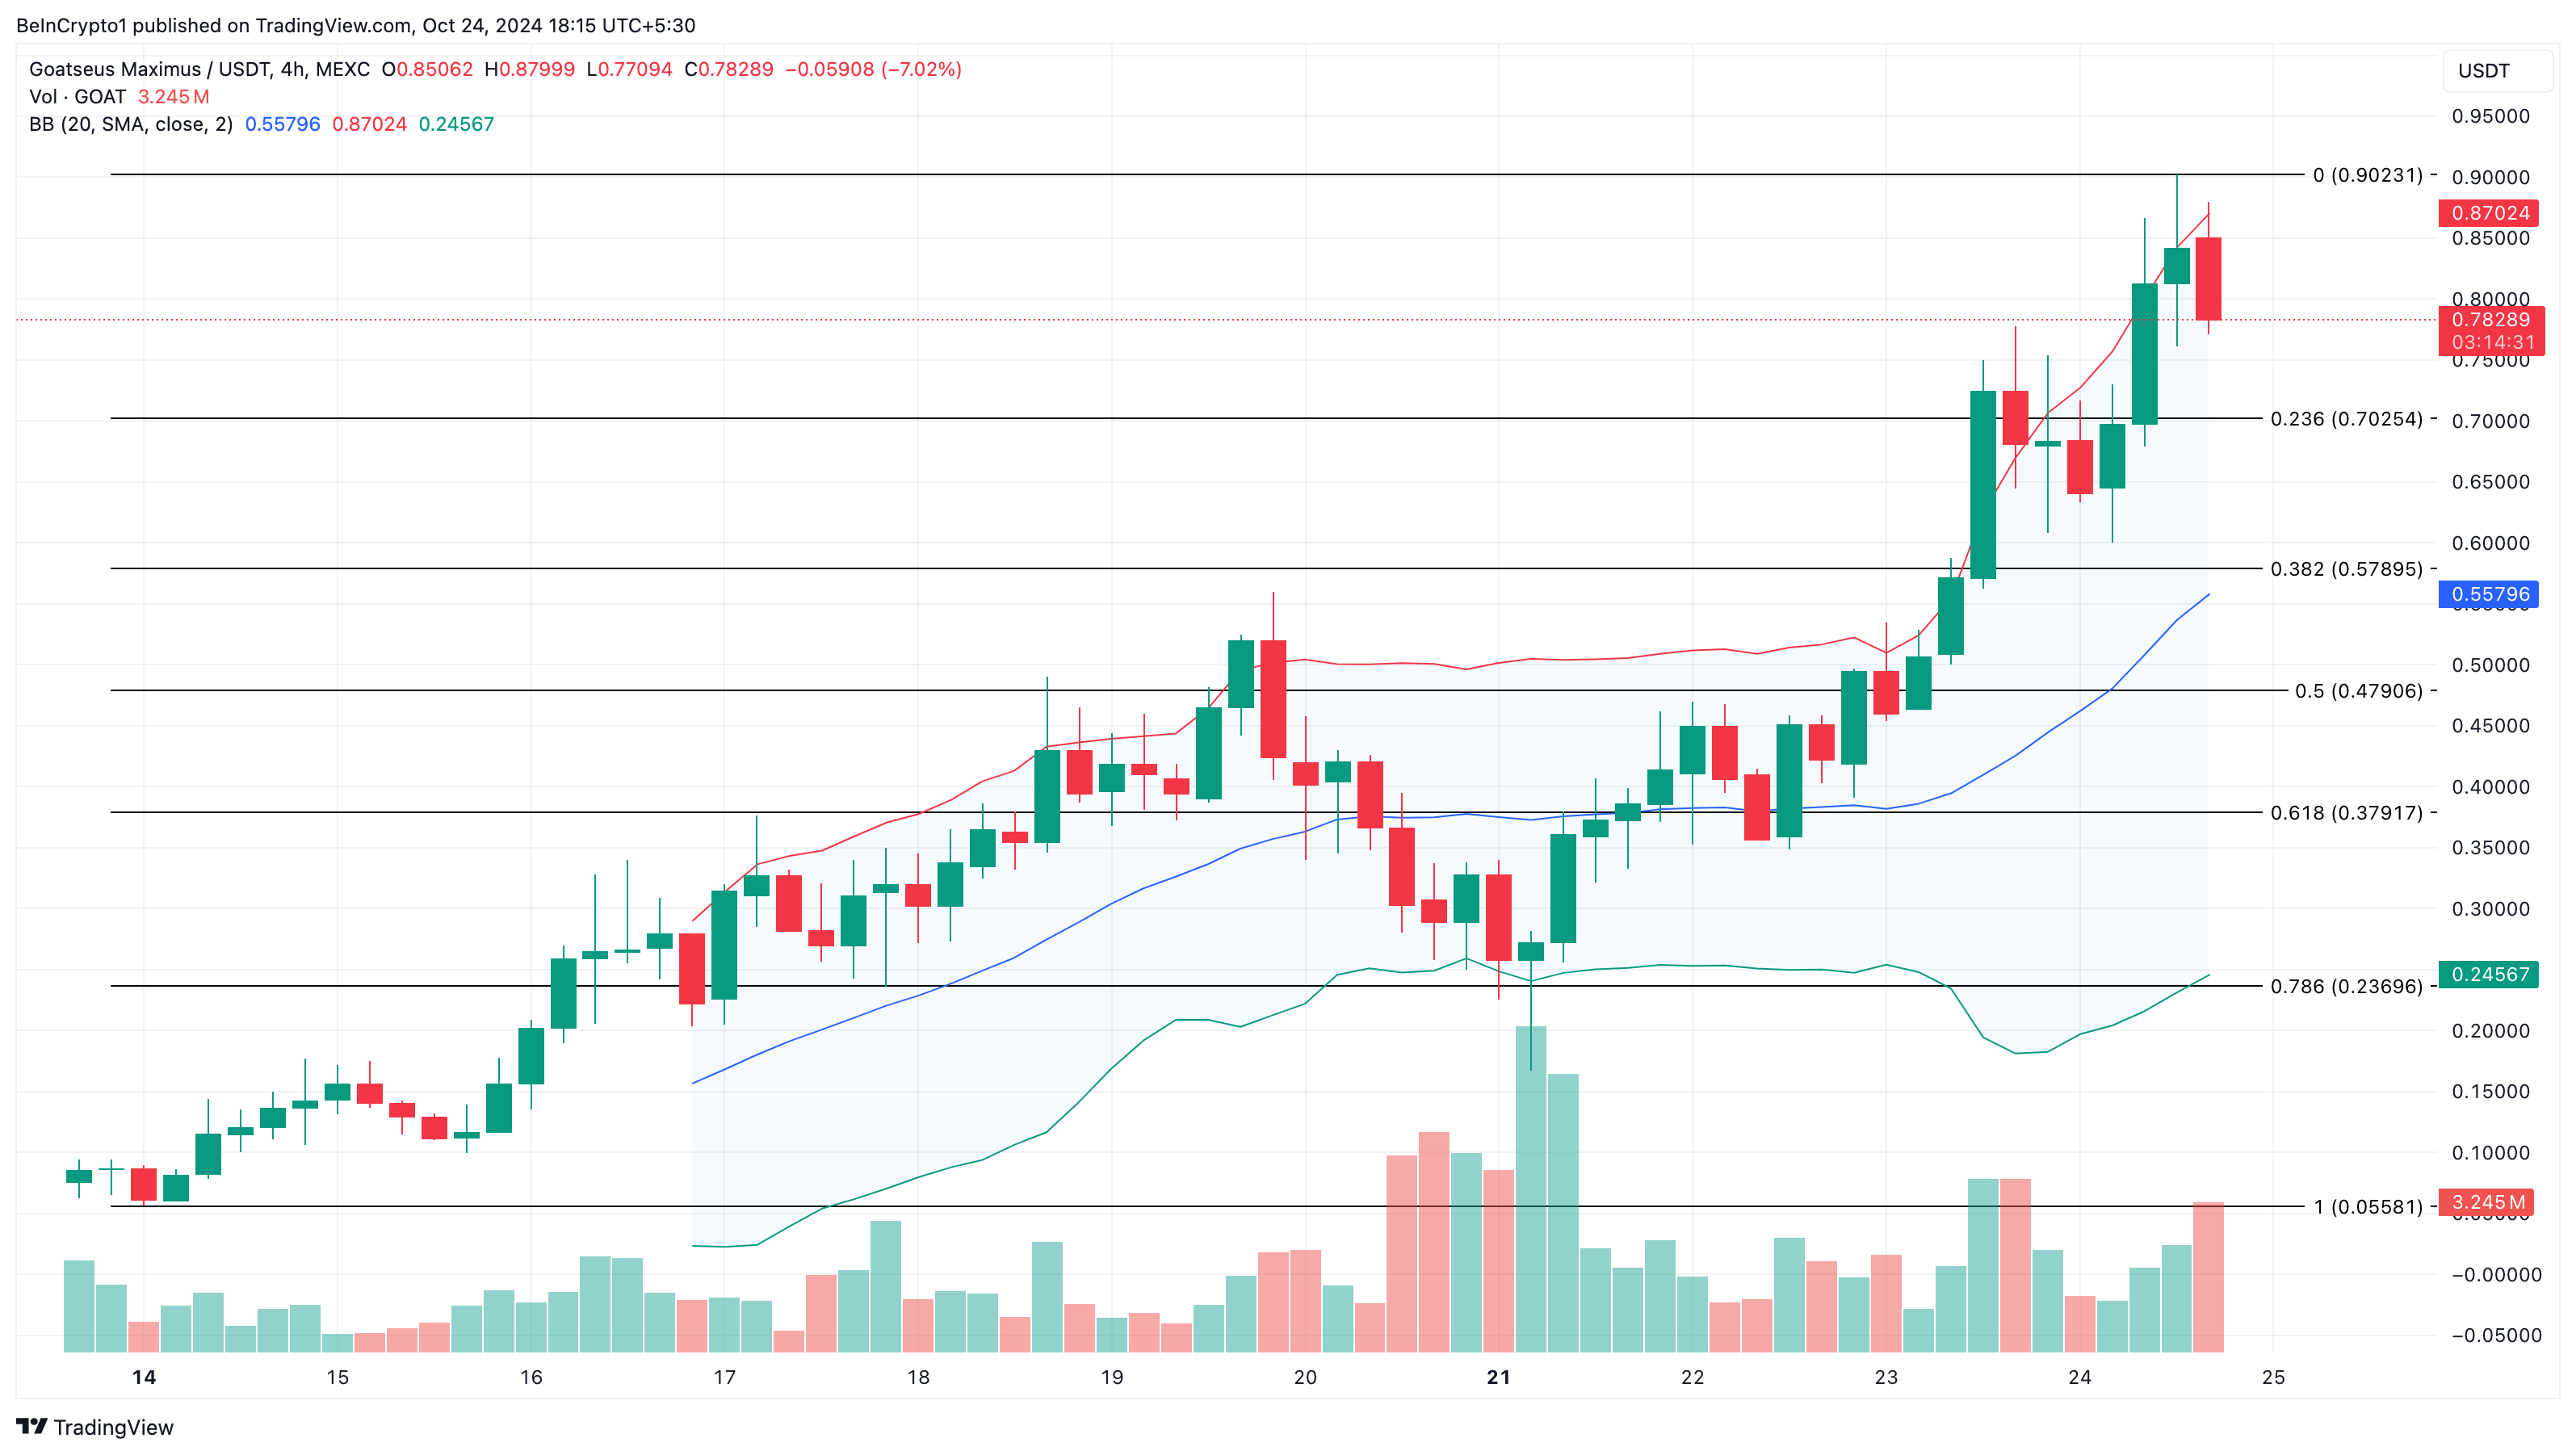
Considering this outlook, GOAT’s price could decline to $0.70, where the 23.6% nominal pullback sits. However, if Open Interest and volume continue to rise, the price is likely to bounce off the slight retracement. In that instance, it could climb toward $1.
Disclaimer
In line with the Trust Project guidelines, this price analysis article is for informational purposes only and should not be considered financial or investment advice. BeInCrypto is committed to accurate, unbiased reporting, but market conditions are subject to change without notice. Always conduct your own research and consult with a professional before making any financial decisions. Please note that our Terms and Conditions, Privacy Policy, and Disclaimers have been updated.


New coins such as FINE, launched three days ago, have seen their market cap reach $2.5 million. CHILLGUY, driven by TikTok hype, has amassed 120,000 holders and achieved $129 million in daily trading volume.
CHILLFAM, following in CHILLGUY’s footsteps, has quickly reached a $10 million market cap with a 300% price surge, showing the potential for continued interest in these emerging tokens.
This Is Fine (FINE)
FINE, launched on Pumpfun just three days ago and now graduated into Raydium, is attempting to capitalize on the growing trend of coins paired with animated video.
As of this writing, the coin boasts over 26,000 holders and a market cap of $2.5 million. However, it has experienced a steep decline, dropping more than 50%. If FINE can stabilize after this sharp drop, it may present an attractive entry point for traders eyeing a potential recovery.
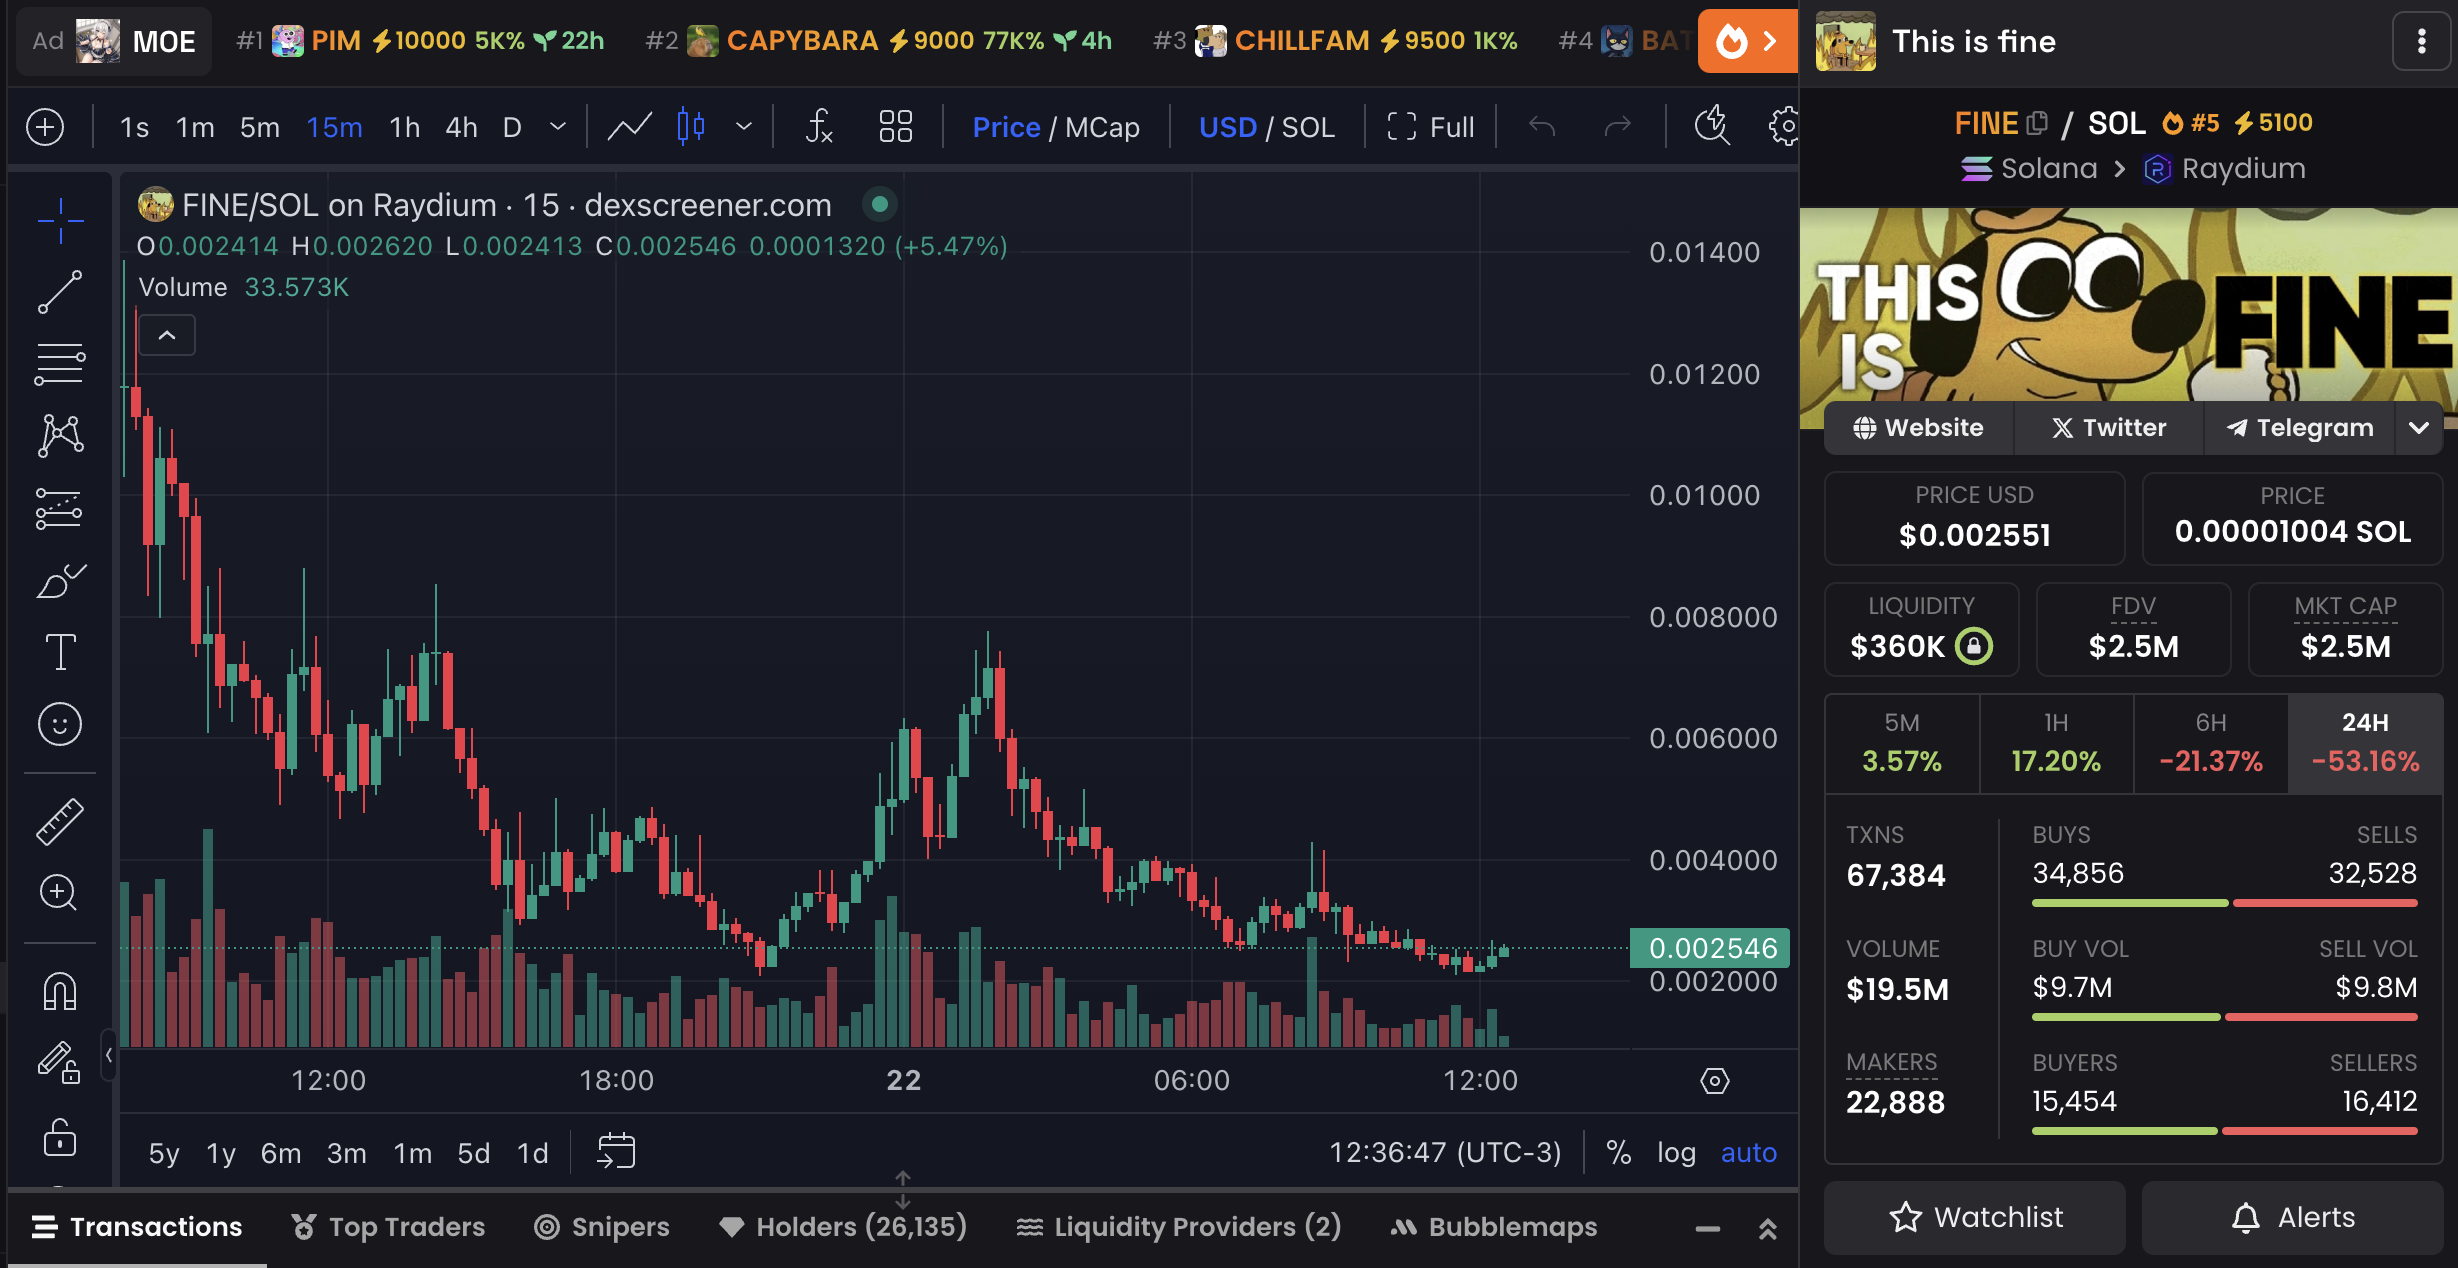
FINE’s RSI is 35, indicating that it is approaching the oversold zone. This suggests that selling pressure may be reaching an extreme, potentially setting the stage for a reversal or bounce if buying interest returns. However, the current bearish momentum highlights the need for caution before expecting a recovery.
Just a chill guy (CHILLGUY)
CHILLGUY, a Solana-based meme coin that gained popularity through TikTok, has quickly risen to prominence in less than a week. The coin’s rapid adoption is evident in its impressive metrics, boasting over 120,000 holders and amassing 112,000 transactions per day.
The coin’s daily trading volume has surpassed $129 million, showcasing substantial market activity and strong interest from traders. This level of engagement highlights CHILLGUY’s potential to sustain its momentum if the hype continues to drive liquidity and participation.
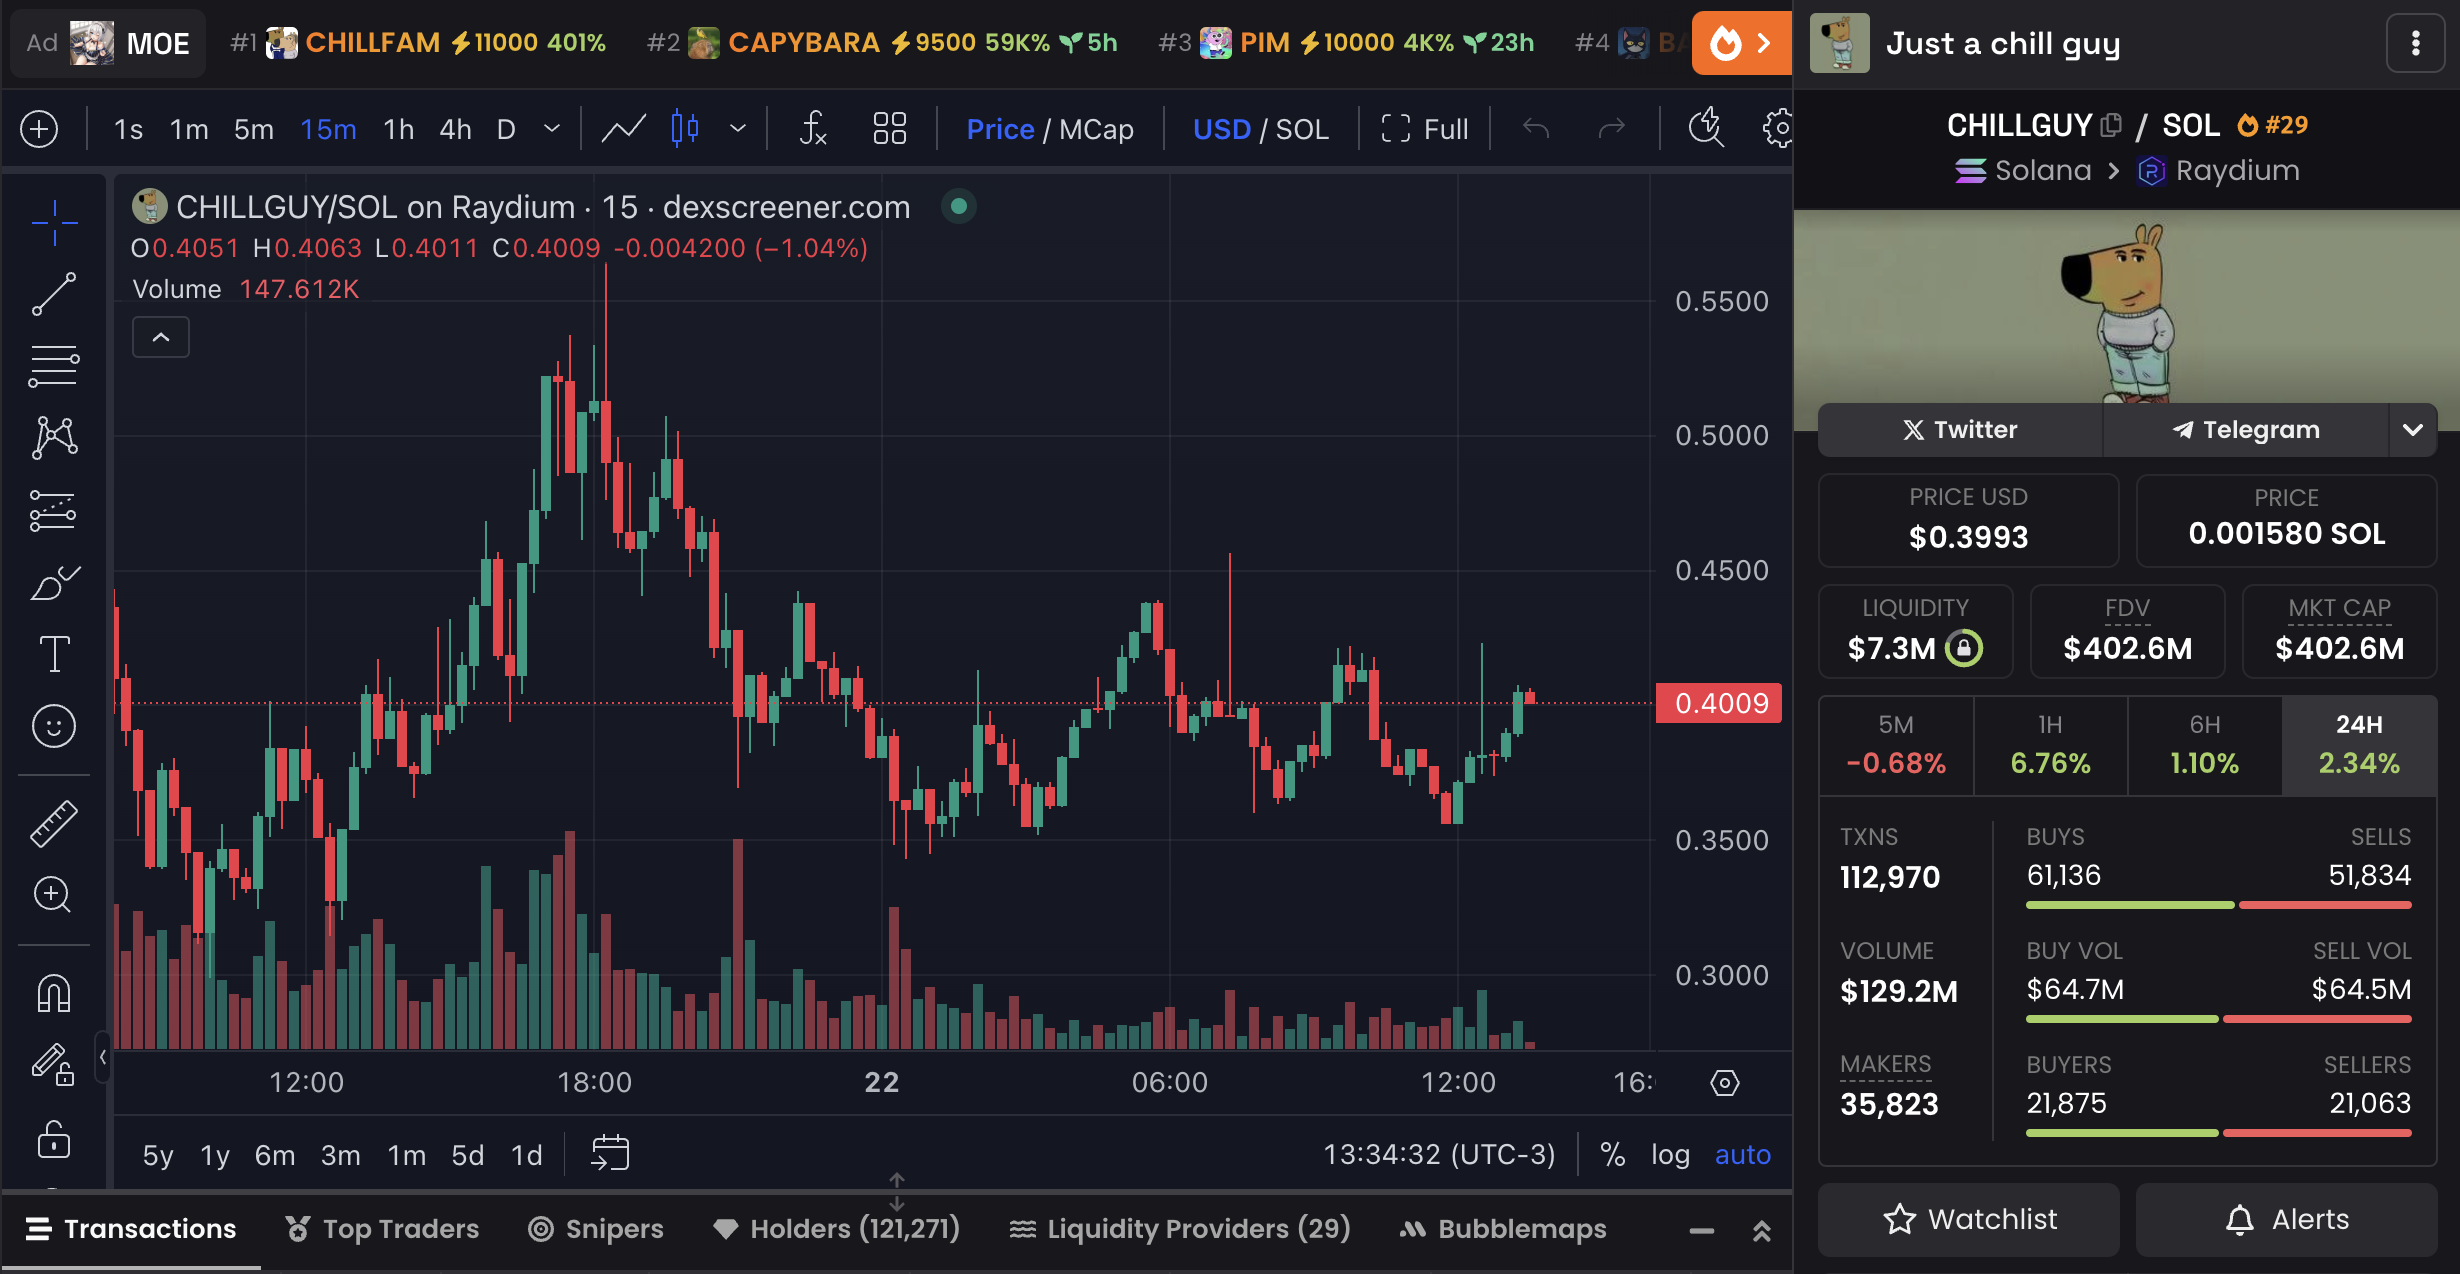
CHILLGUY’s RSI sits at 52.3, indicating a neutral zone where neither buyers nor sellers have a dominant edge. This balanced sentiment suggests the market is stabilizing after initial volatility, leaving room for the token to move in either direction depending on future market activity and demand.
Chill Family (CHILLFAM)
CHILLFAM, inspired by the success of CHILLGUY, was launched just two days ago. With nearly 58,000 holders and a daily trading volume of $55 million, the token is gaining traction among meme coins enthusiasts on Solana.
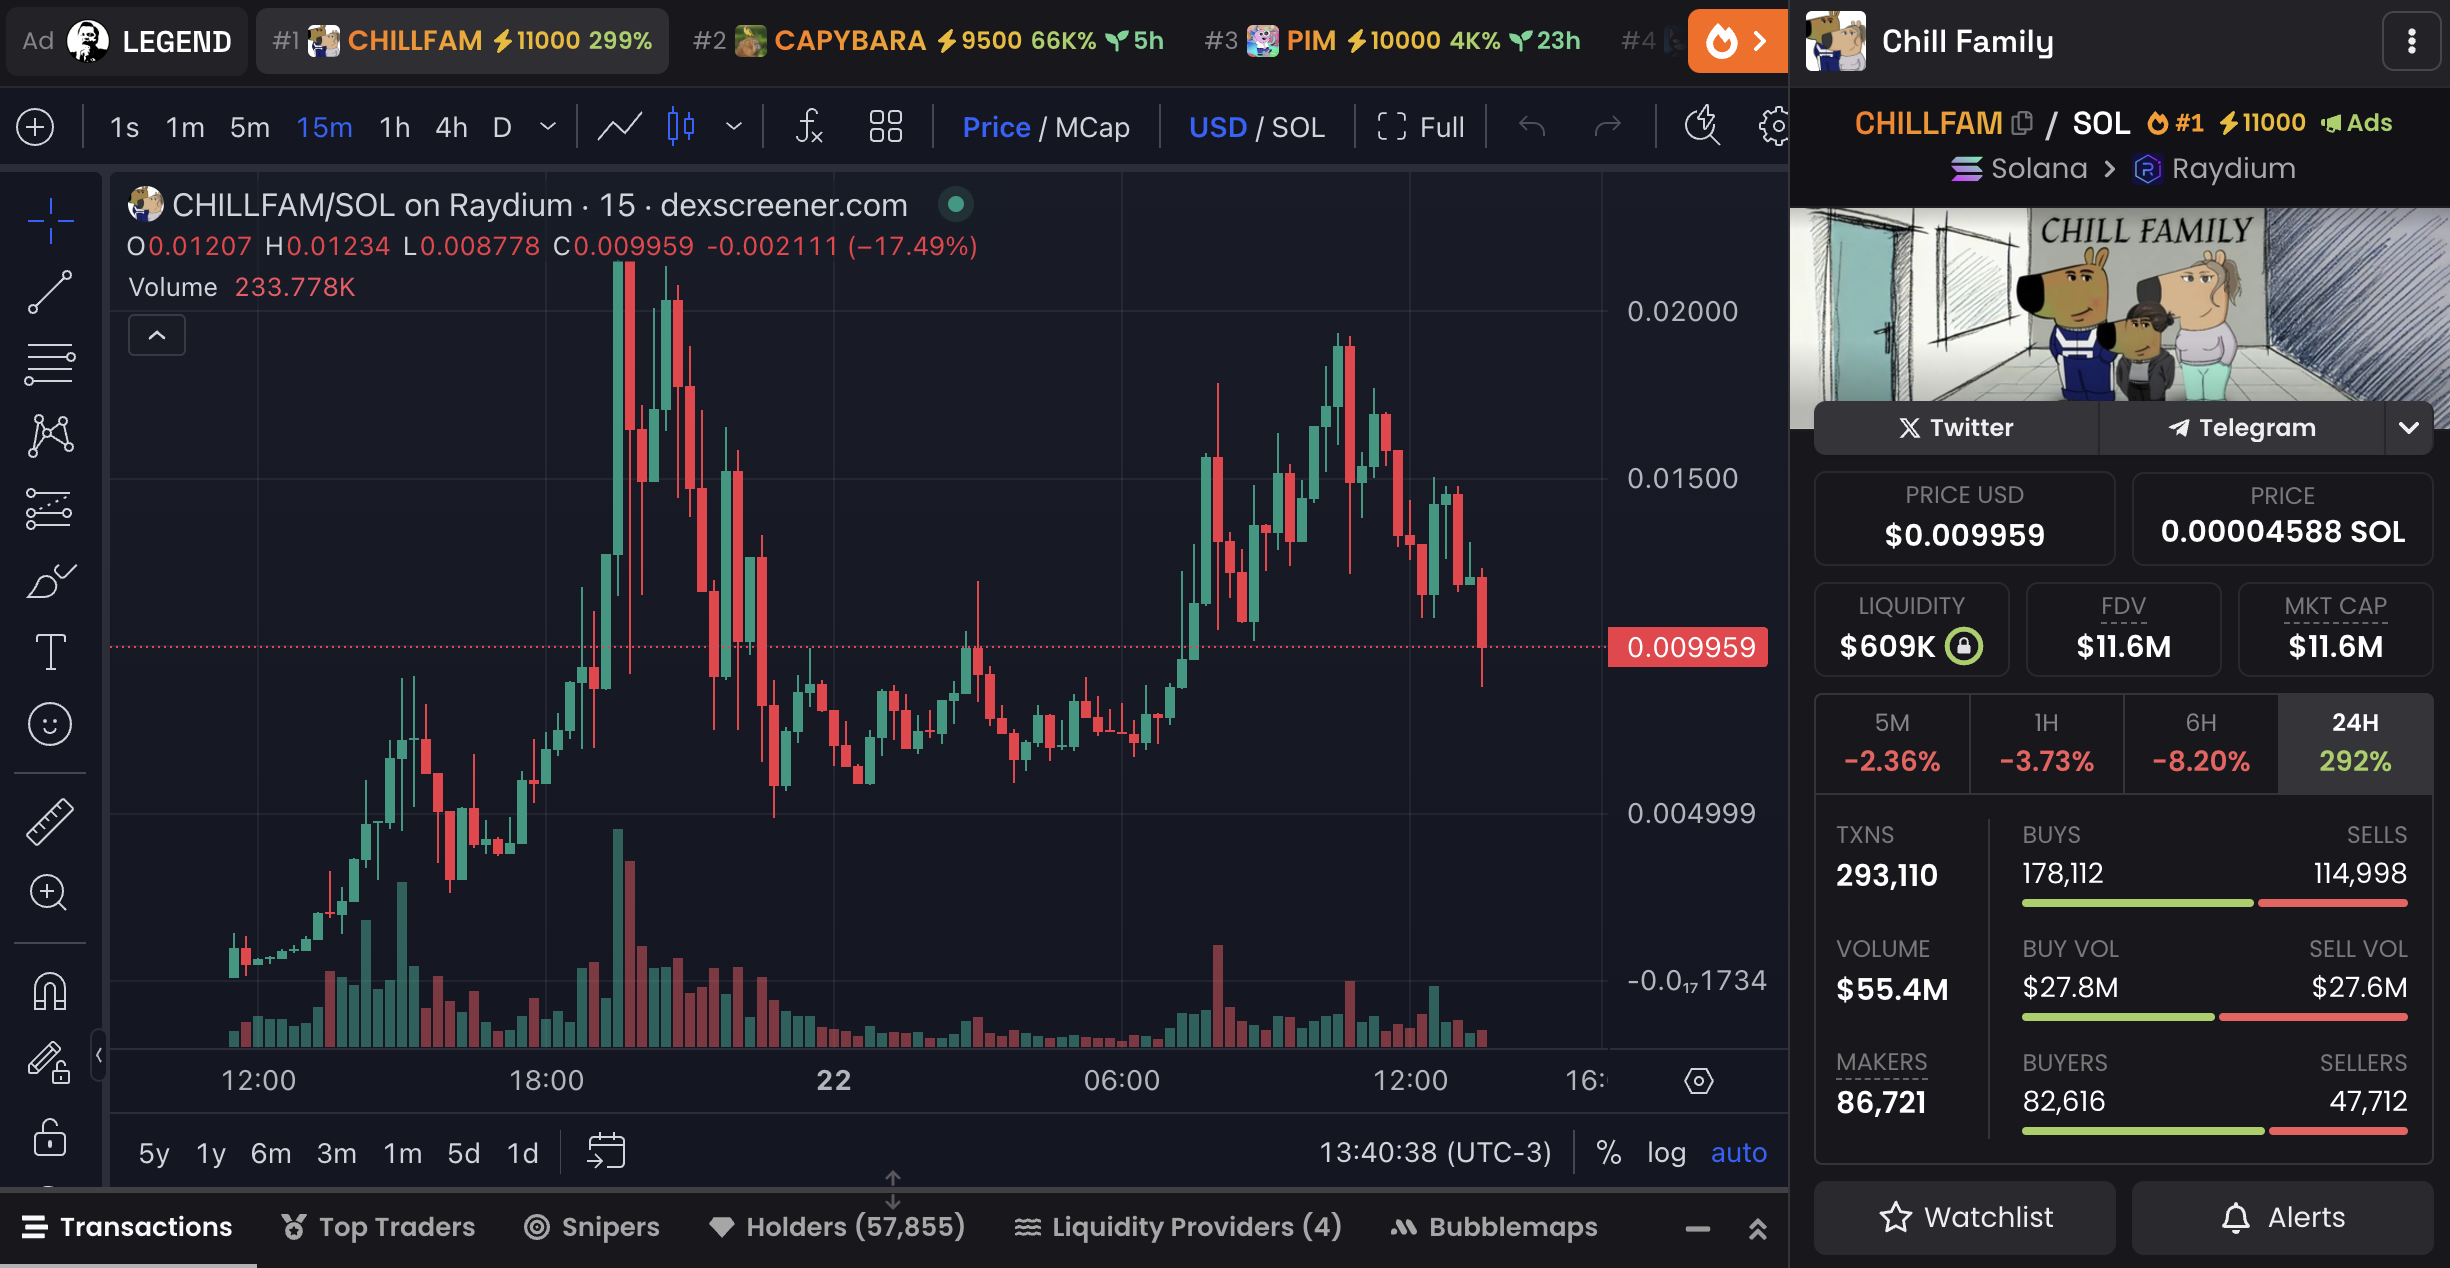
Currently boasting a $10 million market cap, CHILLFAM has surged almost 300% in 24 hours, highlighting strong early interest. If it can maintain this momentum and sustain its $10 million market cap, the coin could potentially aim for $15 million or even $20 million.
CHILLFAM’s RSI is at 43, suggesting that the token is in a slightly bearish to neutral zone. This level indicates that the recent rally may be cooling off, providing a period of consolidation. If buying interest returns, it could reignite bullish momentum and push CHILLFAM toward higher valuations.
Disclaimer
In line with the Trust Project guidelines, this price analysis article is for informational purposes only and should not be considered financial or investment advice. BeInCrypto is committed to accurate, unbiased reporting, but market conditions are subject to change without notice. Always conduct your own research and consult with a professional before making any financial decisions. Please note that our Terms and Conditions, Privacy Policy, and Disclaimers have been updated.
XRP remains one of the crypto market’s current trailblazers rising by 23.21% in the past 24 hours. Over the last two weeks, the prominent altcoin has recorded a 154% price gain establishing itself as the sixth-largest cryptocurrency with a market cap of $89.82 billion. With this current momentum and the crypto bull season still in its early stages, analysts remain highly bullish on XRP’s potential to reach lofty price levels.
Can XRP Repeat 2017 Historical Price Movement?
In an X post on November 22, an analyst with the username CryptoBull stated that XRP could trade at $40 over the next three months if the token mirrors its first prominent price surge from 2017.
Data from CoinMarketCap shows that XRP rose $0.006 to a market peak of $0.33 in early 2017, representing a 5,400% gain. Considering its recent price rally, the altcoin may be gathering momentum to reproduce such price movement in a highly anticipated crypto bull run, especially considering recent happenings.
Most notably, popular anti-crypto Securities and Exchange Commission Chairman Gary Gensler recently announced his intentions to resign on January 20, a move largely behind the current bullish sentiment among XRP investors considering the Commission’s long-lasting regulatory battle with Ripple. In fact, Gensler’s decision to leave the SEC has been described as the “best thing” for Ripple, which holds significant weight for XRP’s future.
Gensler’s resignation coincides with the inauguration of pro-crypto incoming US President-Elect Donald Trump who has promised to introduce a more friendly approach to digital asset regulation in the US. Aside from XRP finally being free from the regulatory scrutiny of the SEC, the potential introduction of a spot ETF under Trump’s pro-crypto regime also contributes to bullish sentiments on the altcoin’s profitability.
According to CryptoBull, if XRP follows its price explosion from early 2017, the token is expected to hit a price target of $1.96 in November, $6.30 in December, and $40 in January.

Price Resistance Levels In XRP’s Dream Surge
While XRP presents much potential for a high price target, CryptoBull predicts the token to face significant resistance at the $1.96 price region. If buying pressure proves sufficient to move past this level, the analyst expects XRP to confront another resistance at $3.84 which represents the token’s current all-time high price.
Considering the current robust bullish sentiments in the market, the altcoin is likely to move past these highlighted resistance levels. However, the token’s Relative Strength Index remains far in the overbought zone (91.73) indicating significant potential for a price pullback.
At the time of writing, XRP continues to trade at $1.78 reflecting a 79.57% gain in the past week. Meanwhile, the token’s daily trading volume is up by 103.57% and valued at $20.29 billion.
Featured image from Trackinsight, chart from Tradingview

Kraken, one of the leading cryptocurrency exchanges, has announced plans to list 19 new tokens, including a range of popular meme coins, and to integrate three additional blockchains.
This development has sparked optimism across the crypto industry, with many anticipating a more favorable environment for token listings under the incoming Trump administration.
Kraken Plans to List 19 Tokens and Integrate 3 Blockchains
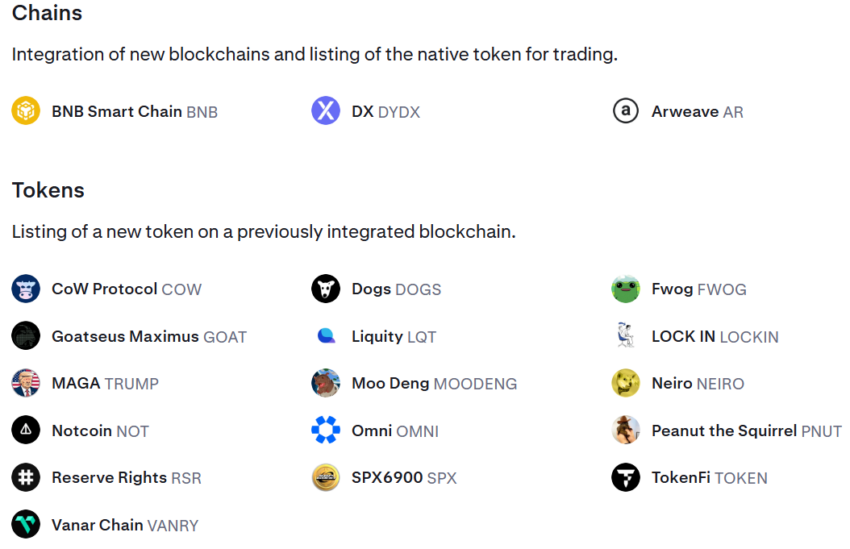
According to its recently published tradeable asset roadmap, Kraken will add the Binance Smart Chain, dYdX, and Arweave blockchains to its platform. Each integration will include support for the native tokens of these networks.
“Kraken lists BNB,” Binance founder Changpeng Zhao stated.
In addition to these three, Kraken plans to list 16 other tokens, primarily meme coins. Some of the notable additions include FWOG, TRUMP, NEIRO, DOGS, GOAT, PNUT, MOODENG, and COW, alongside eight others. These tokens belong to blockchains already integrated into Kraken’s ecosystem.
However, the exchange clarified that listing plans are not guaranteed. Funding and trading for these tokens will only begin after an official announcement through Kraken Pro’s account on X. The company warned that Depositing tokens prematurely could result in losses.
Kraken’s planned token expansion comes at a time when the exchange is navigating legal challenges. The US Securities and Exchange Commission (SEC) has accused Kraken of operating an unregistered securities exchange and offering staking services in violation of federal laws. The exchange has been actively defending itself against these allegations.
Despite regulatory hurdles, crypto industry stakeholders are optimistic that the incoming administration will ease restrictions on token listings. Many believe President-elect Trump’s pro-crypto stance could pave the way for a more supportive regulatory environment. Expectations include a clear regulatory framework, the potential establishment of a Bitcoin reserve, and a departure from the SEC’s regulation-by-enforcement approach.
Already, major US exchanges are capitalizing on the growing market optimism to expand their token listings. Coinbase recently listed PEPE and FLOKI, leveraging the ongoing meme coin trend.
Similarly, Robinhood expanded its offerings by adding tokens that the SEC previously described as securities — XRP, Cardano, and Solana. These moves reflect a broader effort by exchanges to capture market momentum and cater to diverse investor interests.
Disclaimer
In adherence to the Trust Project guidelines, BeInCrypto is committed to unbiased, transparent reporting. This news article aims to provide accurate, timely information. However, readers are advised to verify facts independently and consult with a professional before making any decisions based on this content. Please note that our Terms and Conditions, Privacy Policy, and Disclaimers have been updated.

Bitcoin Price And Satoshimeter: Analyst Says $100,000 Is Far From The Peak

Bitcoin Price To $100,000? Here’s What To Expect If BTC Makes History

Exploring Hottest New Coins: FINE, CHILLGUY, and CHILLFAM

XRP To Hit $40 In 3 Months But On This Condition – Analyst

XRP Price To $28: Wave Analysis Reveals When It Will Reach Double-Digits

Kraken Eyes Token Expansion as Trump Promises Crypto Support

2.52 Million Altcoins Are Ruining Crypto’s Future

Animoca Brands Valuation Tanks 75% In Two Years, Here’s Why

Crypto exchange BingX hacked for $43 million

Are The Big Players Losing Interest?

Hong Kong’s Securities Association Tips Authorities On Crypto Self-Regulation

Coinbase cbBTC Set to go Live on Solana
2.52 Million Altcoins Are Ruining Crypto’s Future
Animoca Brands Valuation Tanks 75% In Two Years, Here’s Why
Crypto exchange BingX hacked for $43 million
Are The Big Players Losing Interest?
Hong Kong’s Securities Association Tips Authorities On Crypto Self-Regulation
Coinbase cbBTC Set to go Live on Solana
-
 Altcoin22 hours ago
Ripple CEO Shares Bullish News With XRP Army As Trump Names Treasury Secretary
-
 Altcoin19 hours ago
Arthur Hayes Shills Another Solana Meme Coin, Price Rallies
-

 Market18 hours ago
Trump Taps Pro-Crypto Scott Bessent for Treasury Secretary Role
-
 Altcoin18 hours ago
Terra Luna Classic Community Discord On Proposal Amid LUNC Price Rally
-
 Market17 hours ago
Artificial Intelligence Coins on the Rise: TFUEL, ZIG, and AKT
-
 Altcoin17 hours ago
Alameda Research Dumping Polygon (POL) Amid Price Spike, What’s Next?
-
 Altcoin15 hours ago
SHIB Lead Shytoshi Kusama Hints At TREAT Token Launch
-
 Market14 hours ago
SEC Secures Record $8.2 Billion in 2024 Financial Remedies