
Market
How Crypto Is Powering De-Dollarization

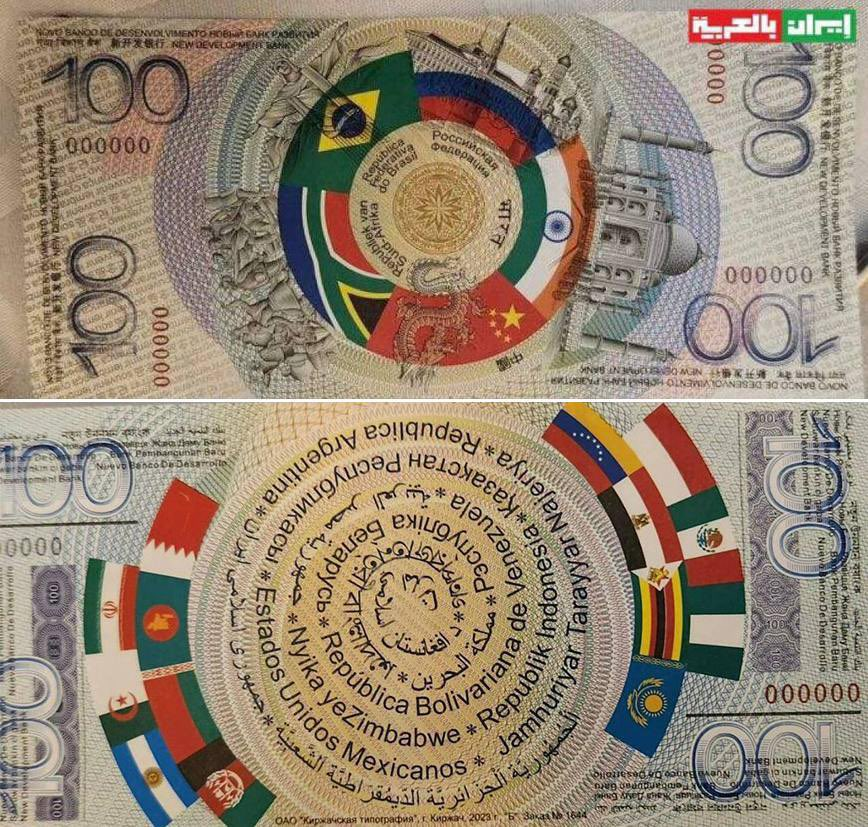
At the sixteenth annual BRICS Summit in Kazan, Russia, several leading members discussed cryptocurrency’s role in de-dollarization. The Presidents of Russia, China, and Iran all stressed the need for new digital platforms.
The core of this de-dollarization effort is BRICS Pay, a payment solution platform based on blockchain technology and CBDCs.
BRICS Summit 2024
The sixteenth annual BRICS Summit has officially kicked off in Kazan, Russia, and one topic has risen to prominence: de-dollarization. At the BRICS Business Forum days prior, Russian President Vladimir Putin discussed using crypto assets and central bank digital currencies (CBDCs) for secure payments. Now, the topic has grown even further:
“There is an urgent need to reform the international financial architecture, and BRICS must play a leading role in promoting a new system that better reflects the profound changes in the international economic balance of power,” said Chinese President Xi Jinping.
Read More: Digital Rupee (e-Rupee): A Comprehensive Guide to India’s CBDC
The core of this reform is the nascent BRICS Pay system. This proposed model will use blockchain technology and CBDCs to facilitate payment options.
The system is not operational yet, but BRICS members have long discussed it as a de-dollarization strategy. A mockup of a possible new currency for this system was also presented at the Summit.
In other words, discussions have moved beyond the hypothetical. The BRICS Business Council’s Annual report explicitly discussed the urgency of finalizing these alternate economic platforms.
Some representatives advocated a system based on CBDCs like the digital yuan. This mirrors El Salvador’s main reason for making Bitcoin legal tender: further economic independence.
Read More: Crypto Regulation: What Are the Benefits and Drawbacks?
As Matthew Sigel, Head of Digital Assets Research at VanEck, reported, CBDCs are not the only assets up for debate. Russian lawmakers introduced the possibility of using Bitcoin and other assets to pay for imports, also bypassing dollar hegemony. Cryptocurrencies are consistently at the forefront of discussion for BRICS’ new economic infrastructure.
Although BRICS has been considered “an informal club” rather than a concrete force, prominent members have joined the de-dollarization plan. According to Iranian state media network IRNA, for example, Iranian President Masoud Pezeshkian proposed “international mobile payment systems,” “a shared e-commerce platform,” and other similar digital solutions.
Between China, Russia, Iran, and numerous other members, the BRICS Summit may gather enough cooperation and approval to move de-dollarization efforts forward. Representatives of the world’s major economies have all joined to discuss blockchain and cryptocurrency solutions.
Disclaimer
In adherence to the Trust Project guidelines, BeInCrypto is committed to unbiased, transparent reporting. This news article aims to provide accurate, timely information. However, readers are advised to verify facts independently and consult with a professional before making any decisions based on this content. Please note that our Terms and Conditions, Privacy Policy, and Disclaimers have been updated.


Reason to trust
![]()
Strict editorial policy that focuses on accuracy, relevance, and impartiality
Created by industry experts and meticulously reviewed
The highest standards in reporting and publishing
Strict editorial policy that focuses on accuracy, relevance, and impartiality
Morbi pretium leo et nisl aliquam mollis. Quisque arcu lorem, ultricies quis pellentesque nec, ullamcorper eu odio.
The PEPE price has taken a sudden bearish turn after breaking out of an Ascending Triangle pattern. In light of this breakout, a crypto analyst has predicted that PEPE could face a massive 20% price crash if it fails to hold above a critical resistance level.
Bears Threaten 20% Crash In PEPE Price
PEPE’s price action has swiftly reversed from bullish to bearish, marked by a negative Change of Character (CHoCH) following its breakout from an Ascending Triangle pattern. Notably, PEPE’s CHoCH is highlighted where the price broke below previous support, indicating a significant structural shift to the bearish zone as buyers lose momentum.
Related Reading
According to pseudonymous TradingView analyst ‘MyCryptoParadise’, bears could seize control of PEPE’s price as it approaches a crucial resistance zone at $0.000008. The analyst has suggested that if the meme coin fails to break above the resistance, it could result in a 20% crash to lower support levels.
The first minor support level at $0.0000065 is highlighted in the green line on the analyst’s price chart. Should bearish momentum persist, PEPE could drop further, trapping late buyers and extending its correction phase. The analyst has pinpointed a much deeper support zone at $0.0000055, serving as a crucial defense against a stronger price breakdown.
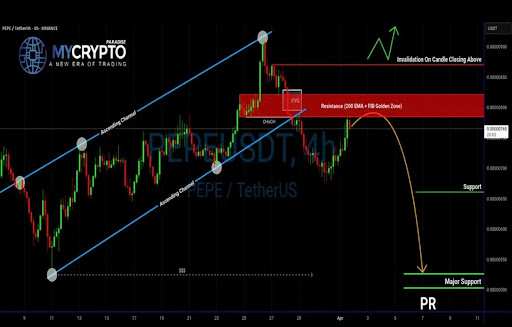
A major factor supporting PEPE’s projected price crash is the alignment of its key resistance level with several bearish elements. The TradingView analyst’s price chart shows that PEPE’s $0.000008 resistance coincides with a 200 Exponential Moving Average (EMA), which acts as a dynamic resistance. The 200 EMA is often a reliable indicator of long-term trend shifts, and its overlap with the resistance adds strength to the bearish outlook.
The resistance also coincides with a Fair Value Gap (FVG), a region where liquidity has been left untested, suggesting that price could be drawn back to fill this gap. Lastly, PEPE’s critical resistance level intersects with a Fibonacci Golden Zone, a key retracement level where price reversals often occur, further signaling the potential for a downturn.
Potential Breakout Scenario
While ‘MyCryptoParadise’ projects a 20% correction for the PEPE price, which is currently trading at $0.00000698, he also shared a possible bullish scenario in which the meme coin surprises traders with an upward breakout. The TradingView analyst has projected that if PEPE manages to close a candle above the $0.000008 resistance, his bearish thesis could be completely invalidated.
Related Reading
In this case, the market should anticipate a continuation of the uptrend, with the next price target potentially reaching $0.0000085 and beyond. However, for bulls to break through this resistance level, strong volume and momentum are required. Given that Pepe’s price is still in the red, this bullish scenario seems like a less likely scenario for now.
Featured image from Adobe Stock, chart from Tradingview.com

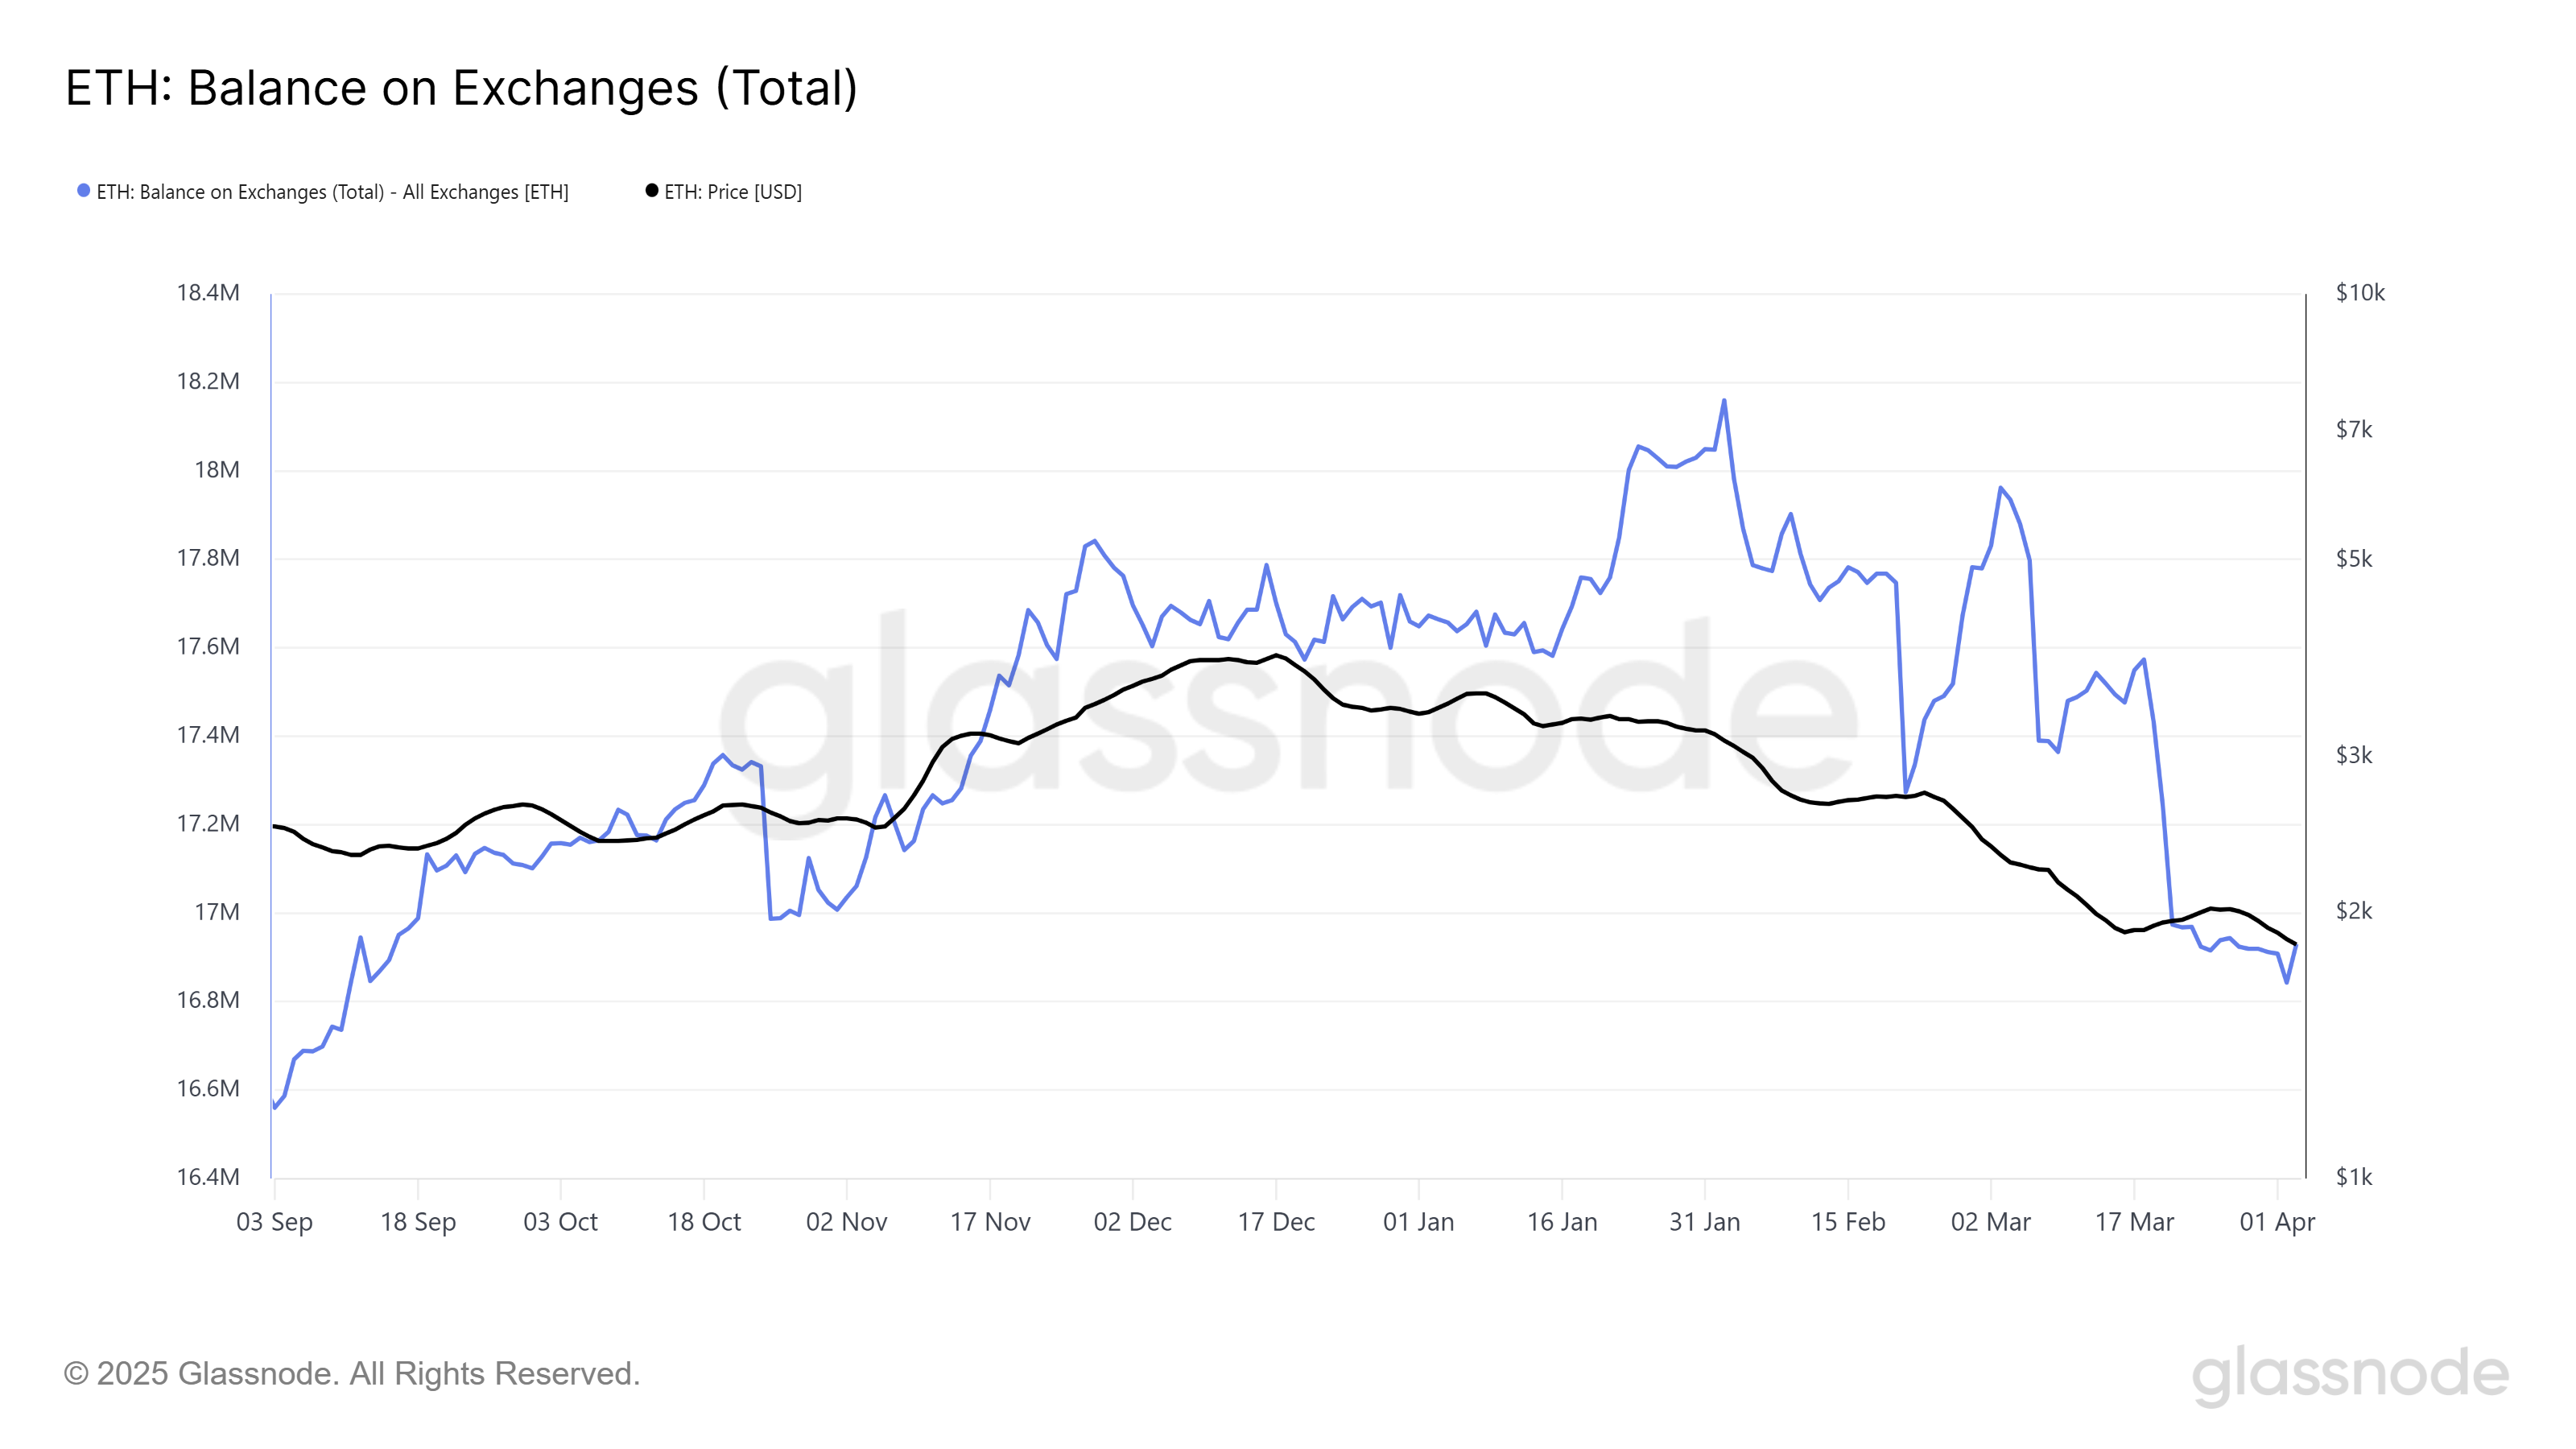
Ethereum has experienced a challenging month and a half, with its price nearing a 17-month low at $1,802 at the time of writing. Despite this ongoing downtrend, which nearly sent ETH into a bear market, key investors have remained optimistic.
As Ethereum approaches these significant levels, many market participants believe that a price rebound could be on the horizon.
Ethereum Investors Capitalize On Low Prices
Ethereum’s supply on exchanges has dropped to a six-month low, indicating that investors are increasingly holding their assets off the market. This drop in exchange supply is often seen as a bullish sign because it suggests that long-term holders (LTHs) are accumulating more ETH at these low price levels, anticipating future price appreciation.
These investors are not willing to sell, demonstrating strong conviction in Ethereum’s long-term value. The decrease in exchange balances also indicates less short-term trading activity. This suggests that many investors are waiting for the price to rebound before making any moves.
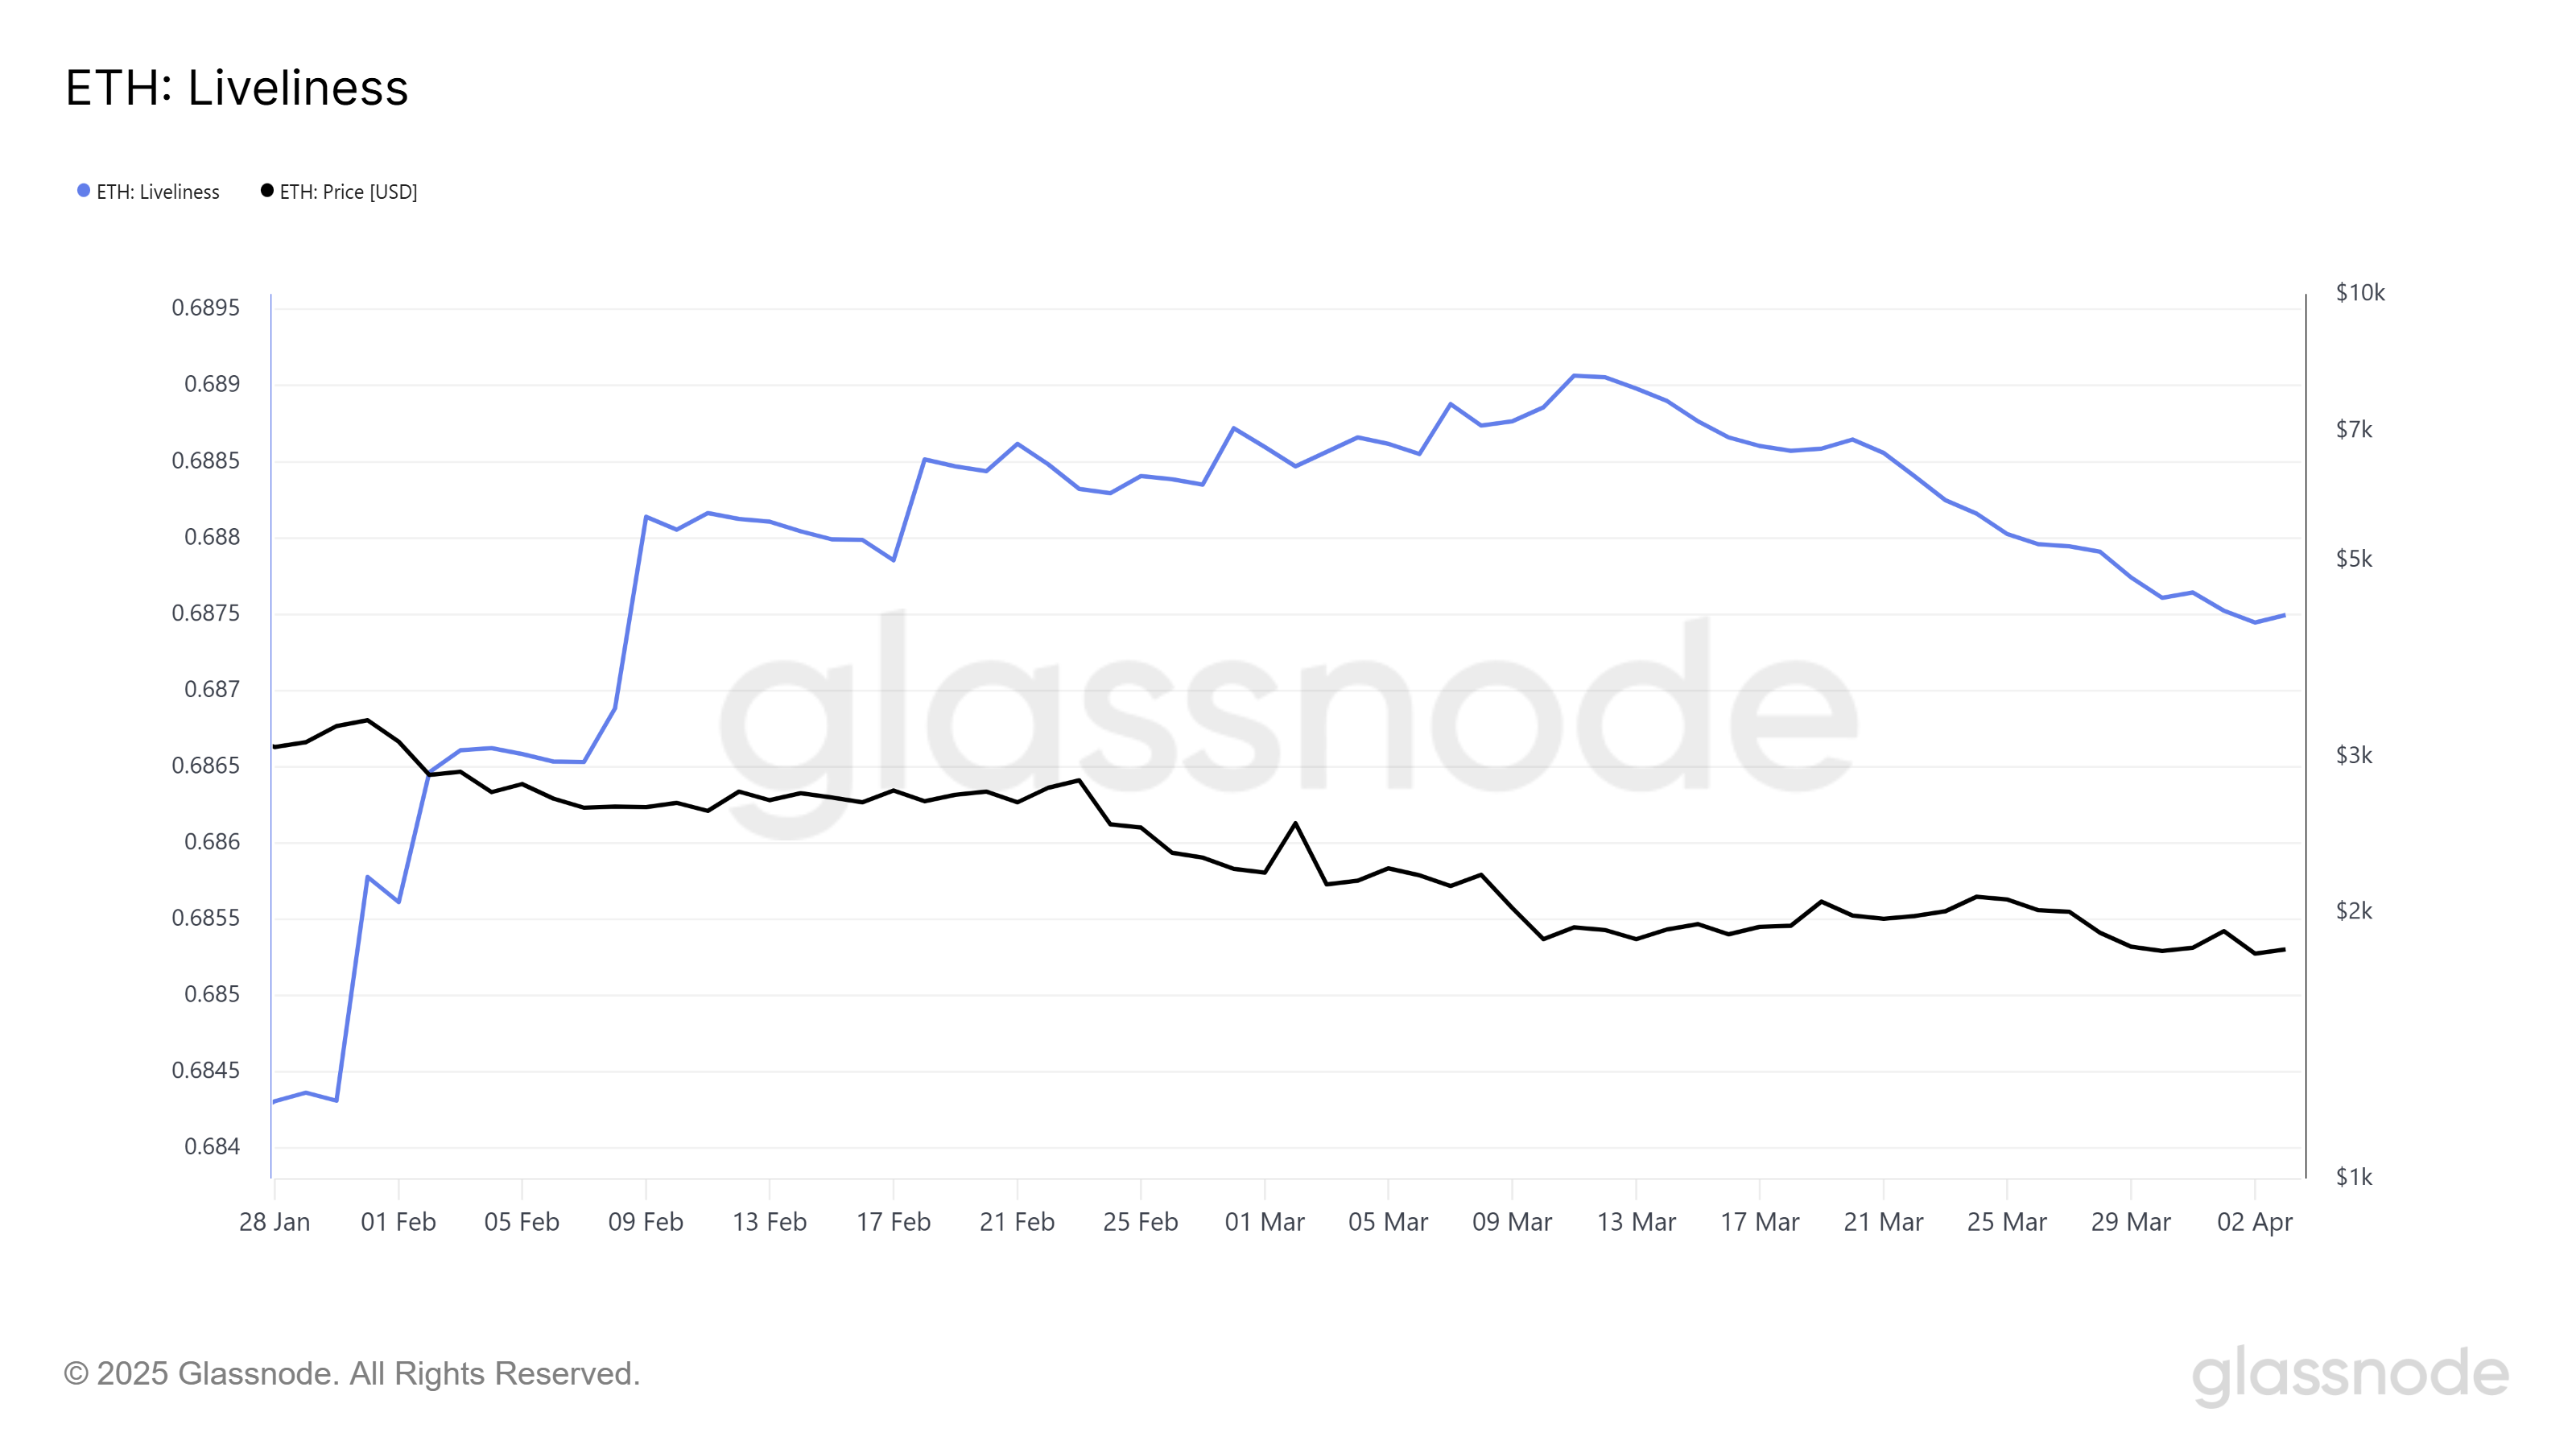
Over the past month, Ethereum’s Liveliness indicator has declined, signaling that the selling pressure is weakening. Liveliness measures the activity of long-term holders, and a decline generally points to accumulation rather than selling.
This drop reflects the growing sentiment among Ethereum’s long-term investors, who are increasing their holdings and expecting the price to recover in the future. The decline in Liveliness suggests that many are confident in Ethereum’s fundamentals and are less concerned about short-term fluctuations.
This accumulation phase suggests that Ethereum’s market sentiment may be shifting. The confidence of LTHs—who hold significant influence over the asset’s price—could lead to a strong upward momentum once the market conditions improve.
ETH Price Needs A Nudge
Ethereum is currently trading at $1,802, just below the resistance level of $1,862. The price has been stuck under this barrier for six weeks, continuing the downtrend that has defined much of the recent price action. However, if Ethereum can break above $1,862, it could signal the end of the downtrend and the start of a price recovery.
Given the current market sentiment and accumulation by key holders, it is possible that Ethereum will continue to gain upward momentum. If Ethereum successfully breaks through the $1,862 resistance, it could move toward the $2,000 mark, regaining some of the losses from the previous weeks.

On the other hand, should the bearish sentiment intensify, Ethereum’s price may dip further toward its 17-month low of $1,745. Failure to secure support at this level could lead to even greater losses. This could extend the recent downtrend and leave many investors exposed to a prolonged bearish market.
Disclaimer
In line with the Trust Project guidelines, this price analysis article is for informational purposes only and should not be considered financial or investment advice. BeInCrypto is committed to accurate, unbiased reporting, but market conditions are subject to change without notice. Always conduct your own research and consult with a professional before making any financial decisions. Please note that our Terms and Conditions, Privacy Policy, and Disclaimers have been updated.

PENDLE has surged by 10% in the past 24 hours, making it the market’s top gainer during this period. The altcoin has even outperformed major cryptocurrencies like Bitcoin (BTC) and Ethereum (ETH).
With buying activity still underway, the PENDLE token is poised to extend its uptrend in the short term.
PENDLE Soars 43% After March Lows
PENDLE cratered to a seven-month low of $1.81 on March 11. As sellers got exhausted, the token’s buyers regained dominance and drove a rally. Trading at $3.24 at press time, PENDLE’s value has since climbed 43%.
The double-digit surge in the altcoin’s price has pushed it above the Leading Spans A and B of its Ichimoku Cloud indicator. They now form dynamic support levels below PENDLE’s price at $2.73 and $2.80, respectively.
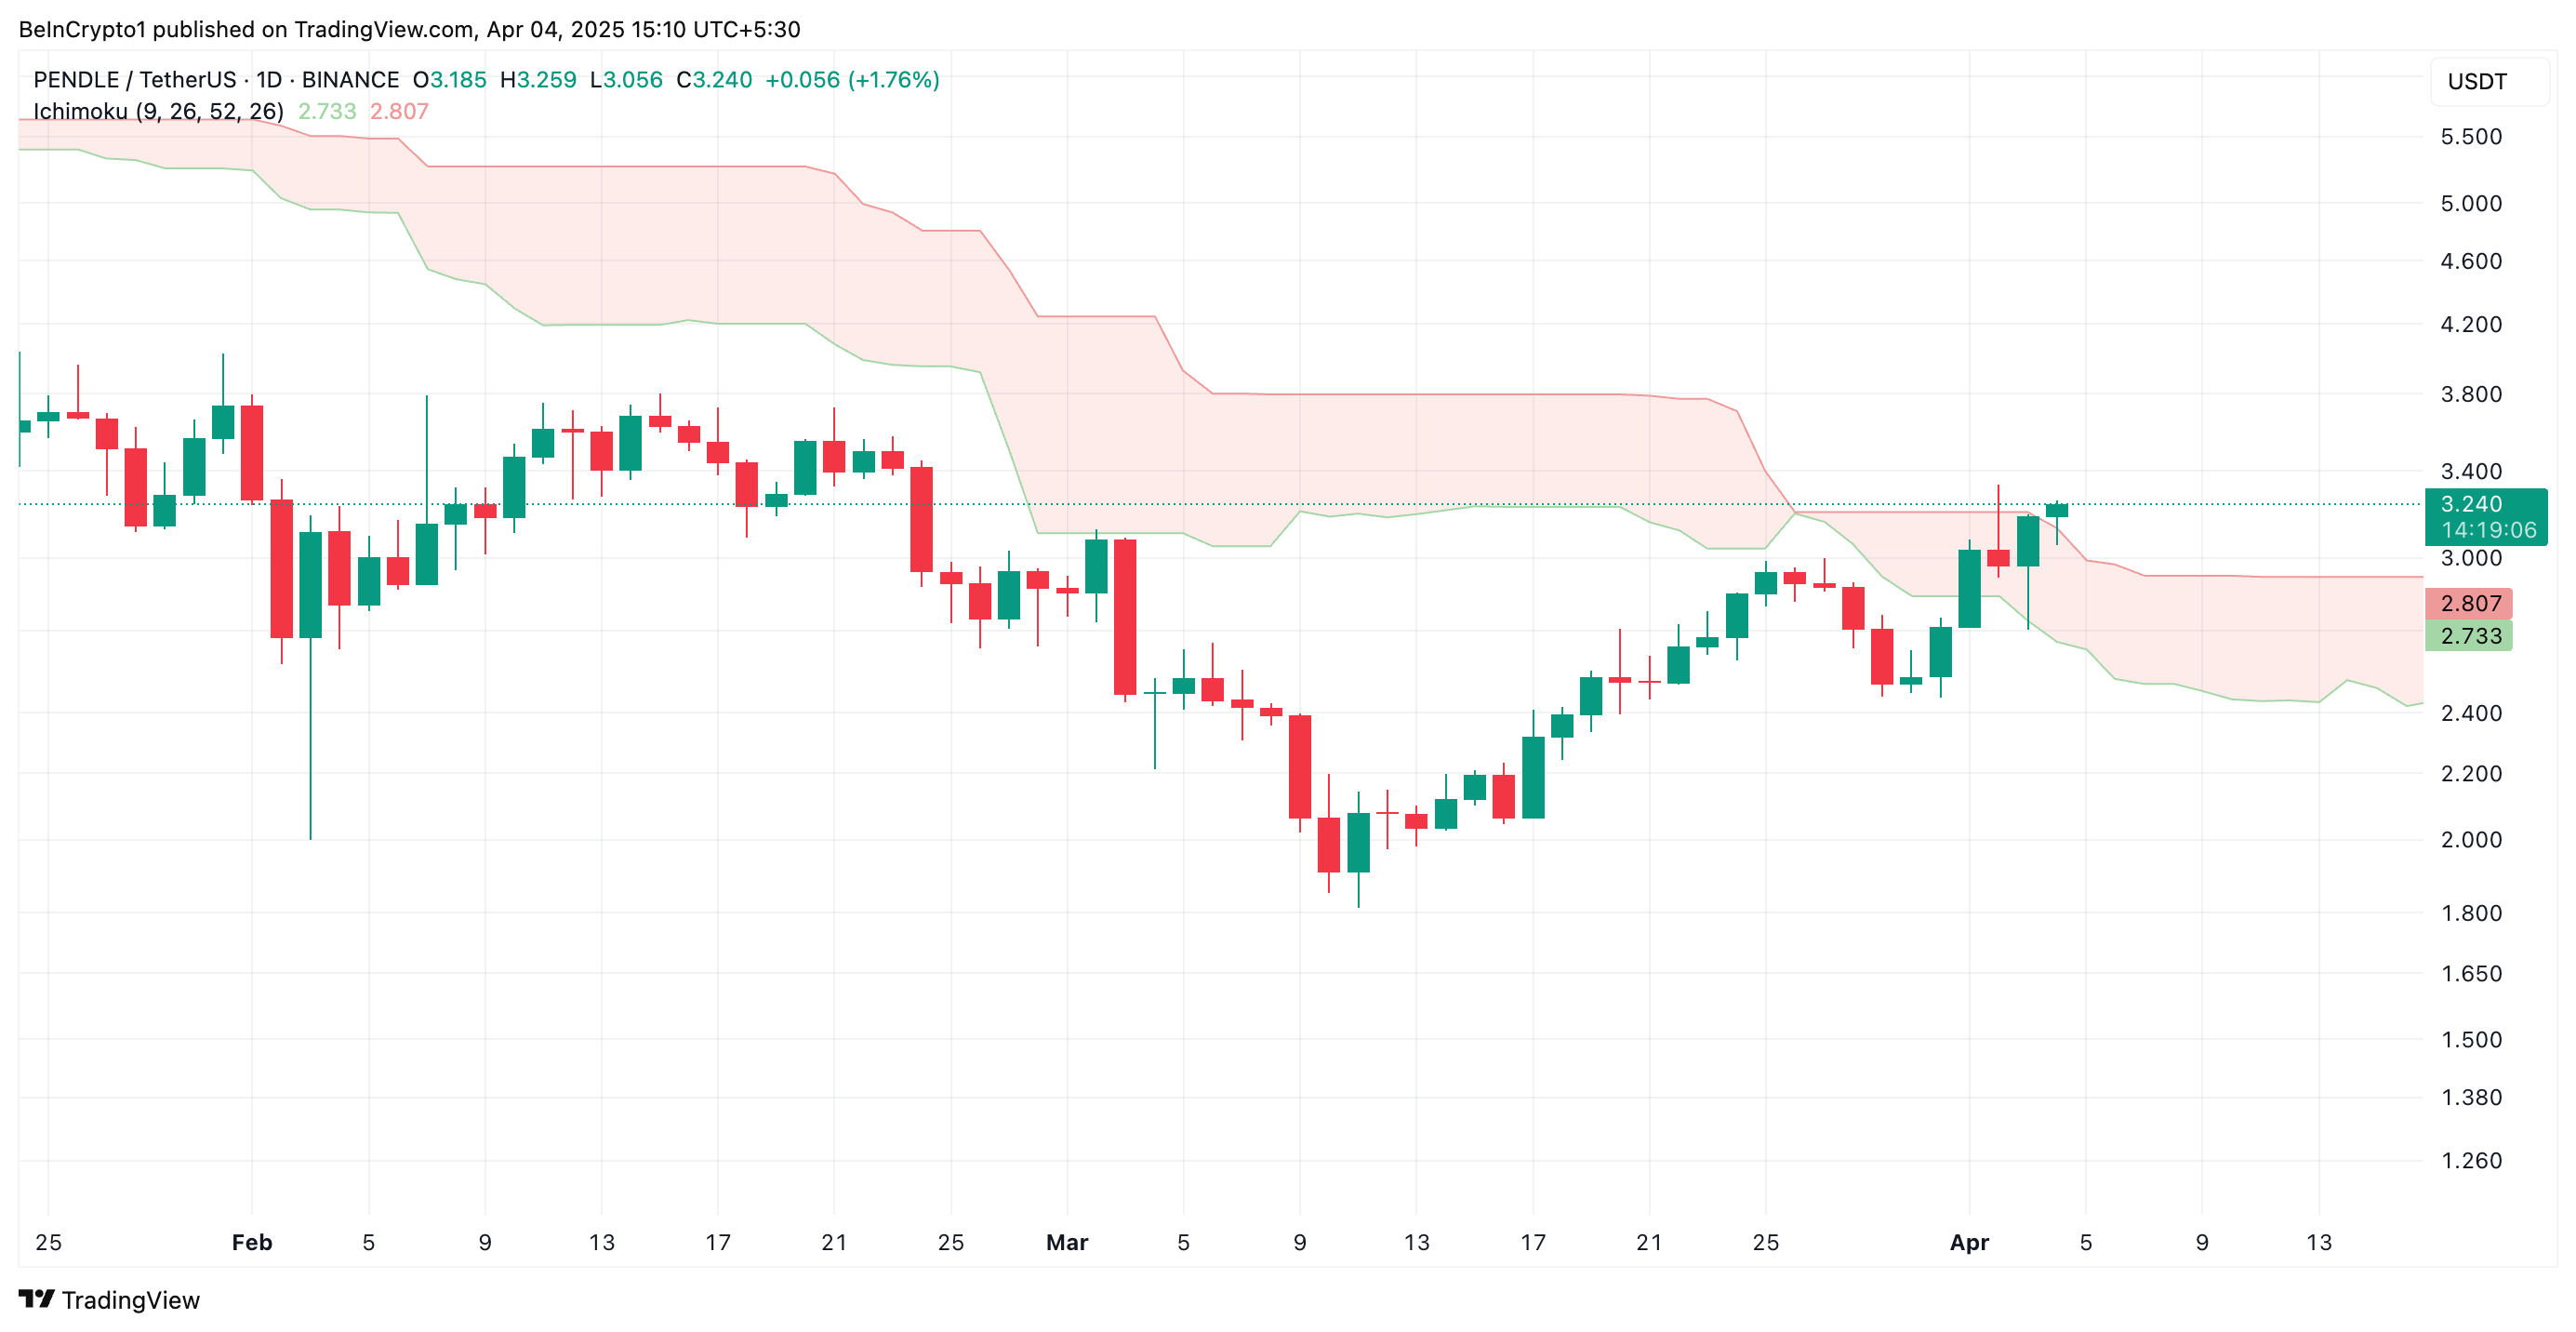
The Ichimoku Cloud tracks the momentum of an asset’s market trends and identifies potential support/resistance levels. When an asset trades above the leading spans A and B of this indicator, its price is in a strong bullish trend. The area above the Cloud is considered a “bullish zone,” indicating that market sentiment is positive, with PENDLE buyers in control.
This pattern suggests that the token’s price could continue to rise, with the Cloud acting as a support level if prices pull back.
In addition, PENDLE currently trades above its Super Trend indicator, confirming the likelihood of extended gains.
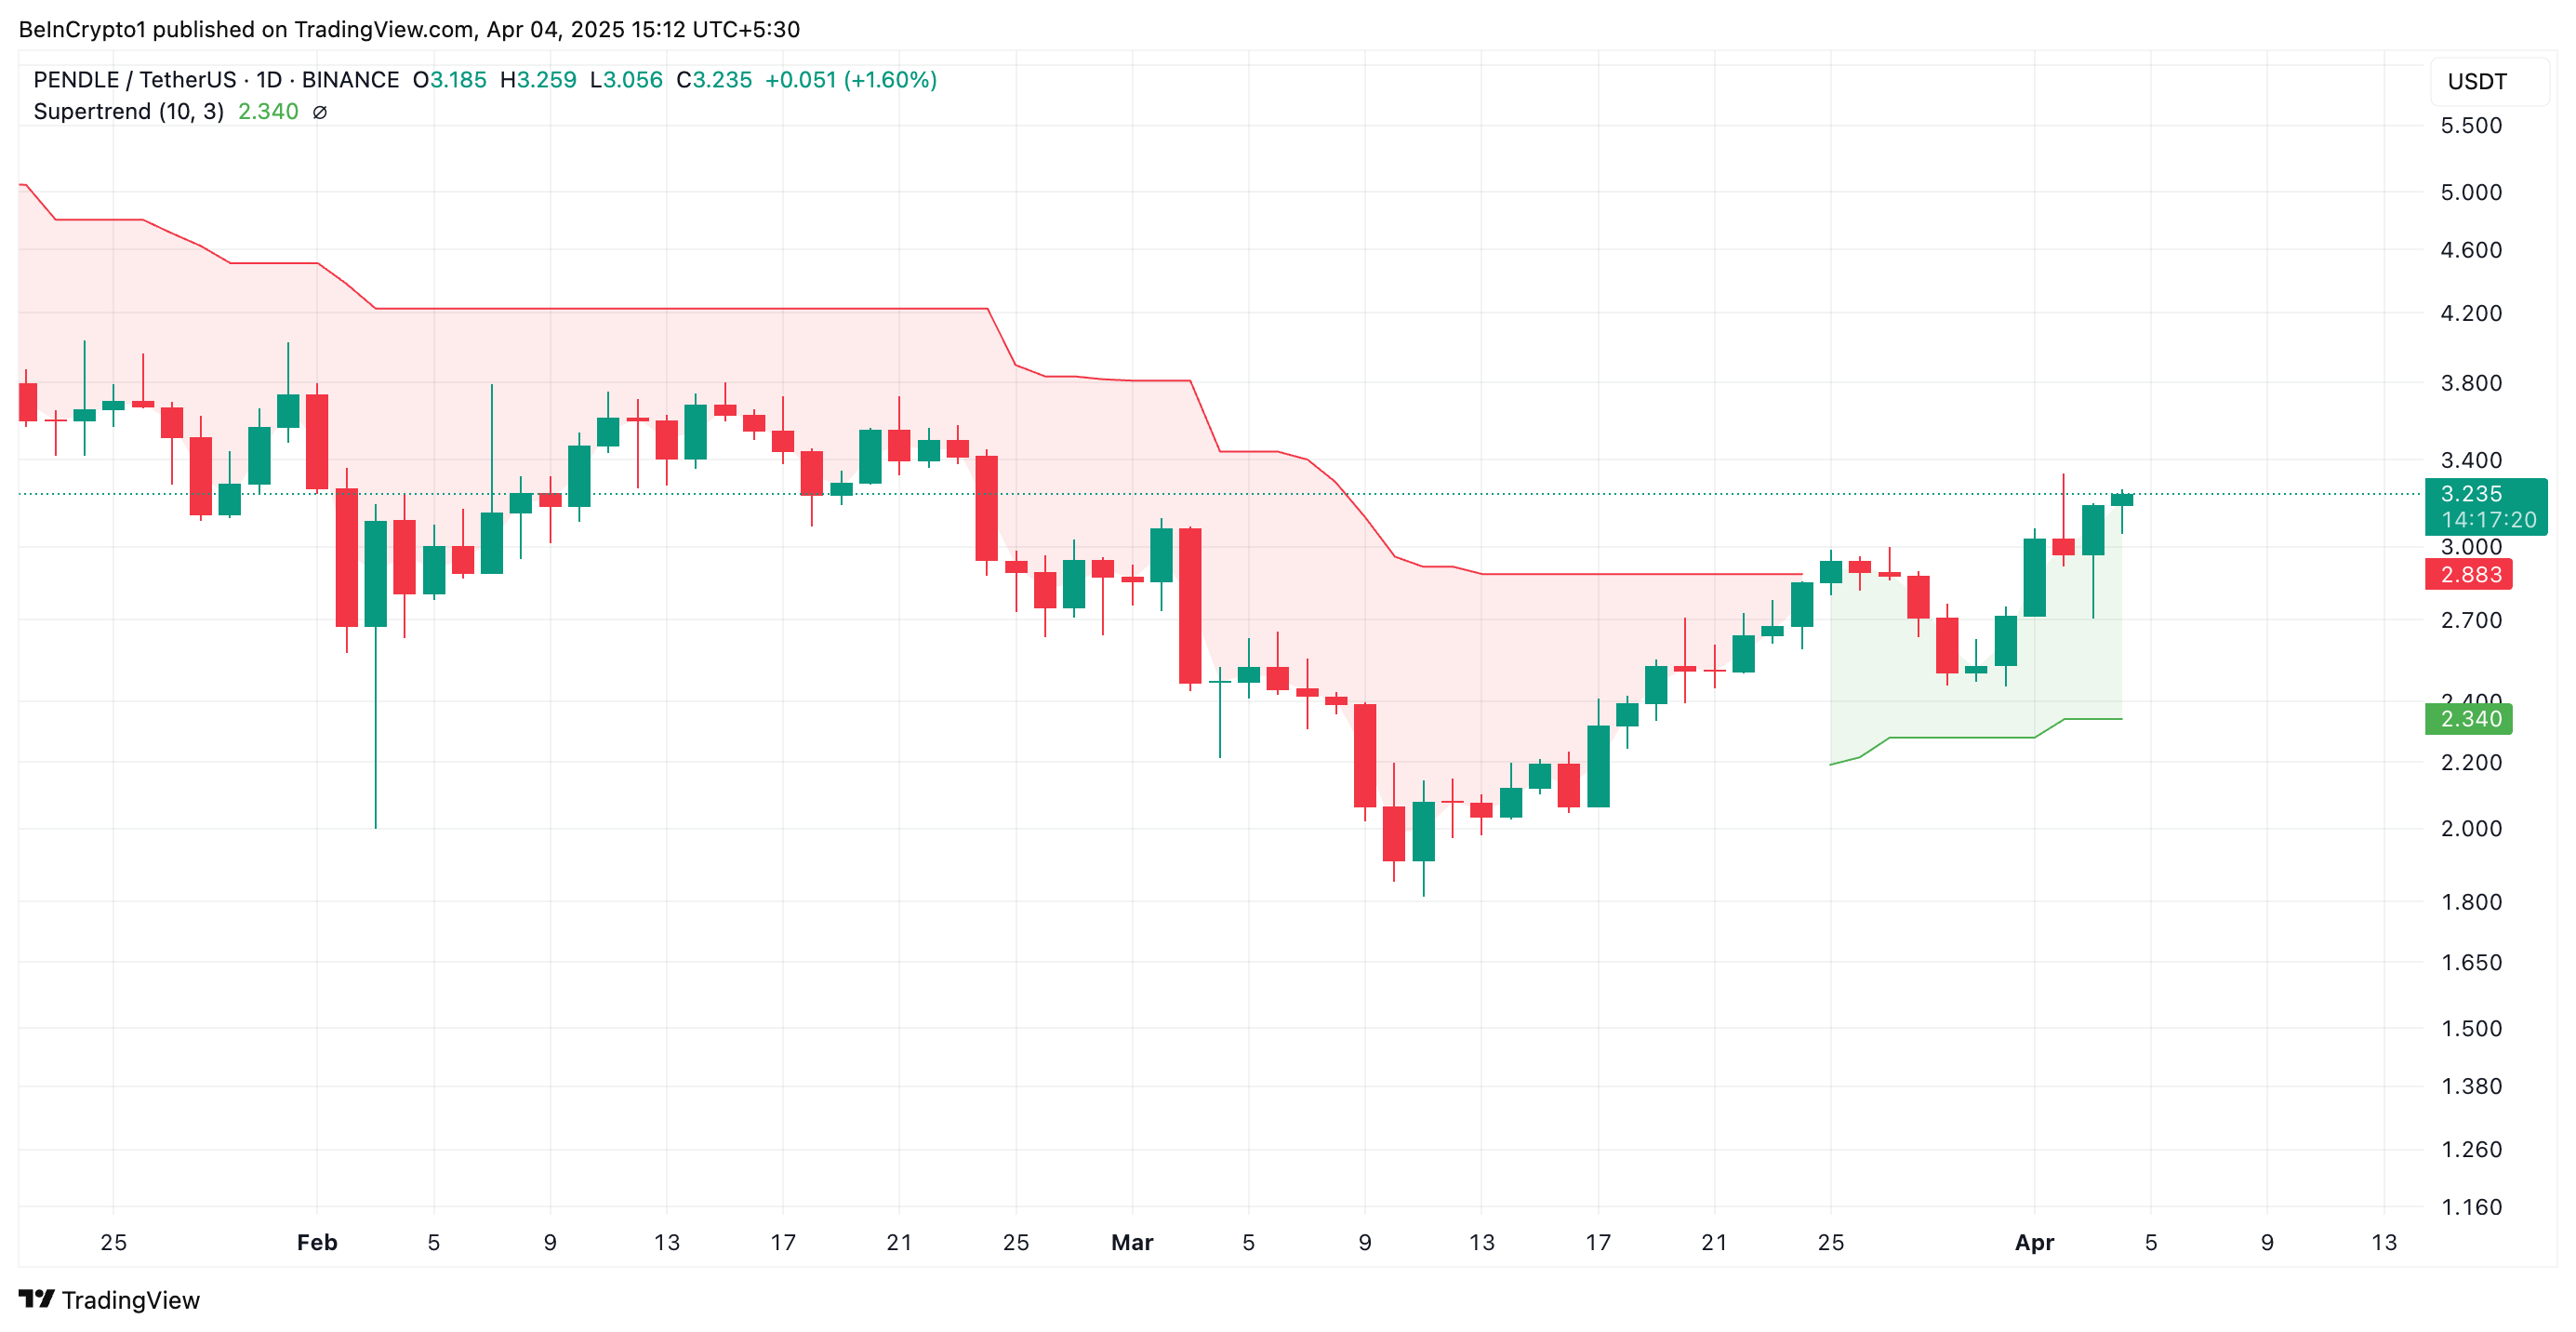
The Super Trend indicator tracks the direction and strength of an asset’s price trend. It is displayed as a line on the price chart, changing color to signify the trend: green for an uptrend and red for a downtrend.
If an asset’s price is above this line, it signals bullish momentum in the market. In this scenario, this line represents a support level that will prevent the price from any significant dips. For PENDLE, this is formed at $2.34.
PENDLE Holds Above Key Trendline
Since its rally began on March 11, PENDLE has traded above an ascending trendline. This pattern forms when a series of higher lows connect, indicating that the price of an asset is consistently rising over time.
It represents a bullish trend, showing that PENDLE demand exceeds supply, with buyers pushing prices higher.
This trendline acts as a support level. With the token’s price bouncing off the trendline, it signals that the asset is in an uptrend and likely to continue. In this scenario, PENDLE could rally to $3.60.
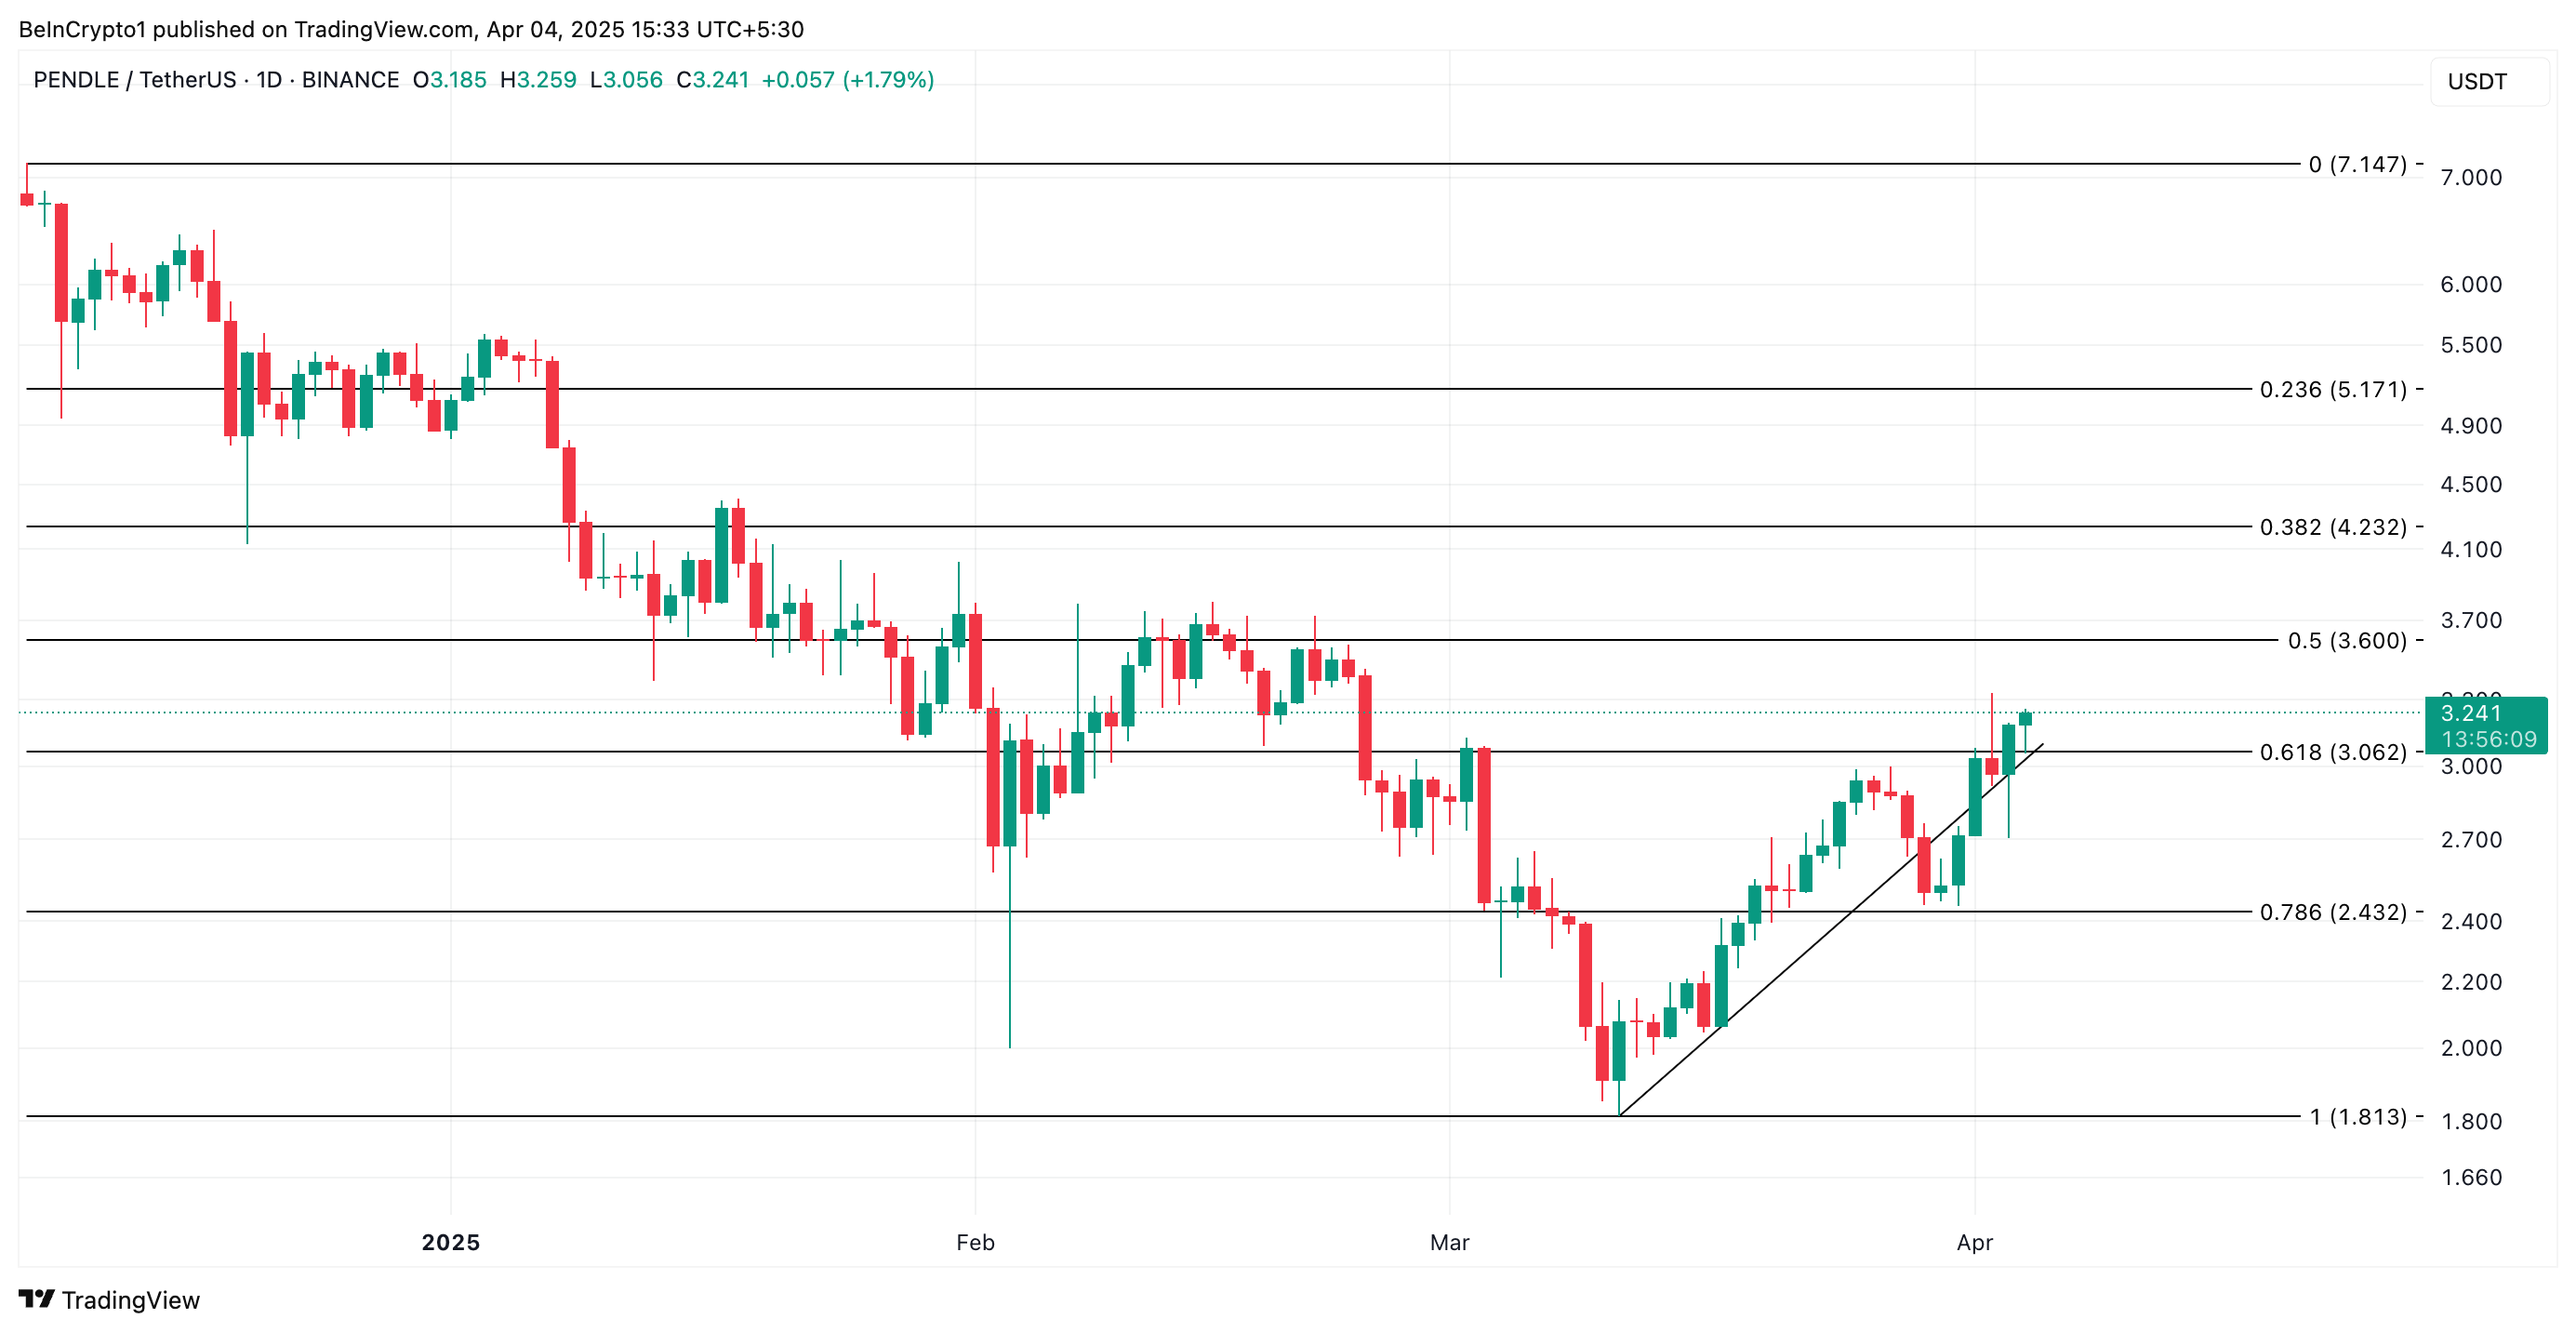
However, if selloffs commence, the PENDLE token could lose some of its recent gains and fall to $3.06.
Disclaimer
In line with the Trust Project guidelines, this price analysis article is for informational purposes only and should not be considered financial or investment advice. BeInCrypto is committed to accurate, unbiased reporting, but market conditions are subject to change without notice. Always conduct your own research and consult with a professional before making any financial decisions. Please note that our Terms and Conditions, Privacy Policy, and Disclaimers have been updated.

Ripple Whales Move $429 Million, What Is Going On?

Pi Network Under Fire As PiDaoSwap Launches NFTs On Binance Chain

PEPE Price Breaks Ascending Triangle To Target Another 20% Crash

Ethereum Holders Buy Heavily as Price Nears October 2023 Levels

Vitalik’s L2 Roadmap, XRP Unlock and More

Ethereum Whales Buy the Dip – Over 130K ETH Added In A Single Day

2.52 Million Altcoins Are Ruining Crypto’s Future

Animoca Brands Valuation Tanks 75% In Two Years, Here’s Why

Crypto exchange BingX hacked for $43 million

Are The Big Players Losing Interest?

Hong Kong’s Securities Association Tips Authorities On Crypto Self-Regulation

Coinbase cbBTC Set to go Live on Solana
2.52 Million Altcoins Are Ruining Crypto’s Future
Animoca Brands Valuation Tanks 75% In Two Years, Here’s Why
Crypto exchange BingX hacked for $43 million
Are The Big Players Losing Interest?
Hong Kong’s Securities Association Tips Authorities On Crypto Self-Regulation
Coinbase cbBTC Set to go Live on Solana
-
 Altcoin24 hours ago
Here’s Why Is Shiba Inu Price Crashing Daily?
-
 Bitcoin21 hours ago
Why ETF Issuers are Buying Bitcoin Despite Recession Fears
-

 Ethereum19 hours ago
Ethereum Faces ‘Hyperinflation Hellscape’—Analyst Reveals Key On-Chain Insights
-

 Market19 hours ago
What to Expect After March’s Struggles
-

 Market18 hours ago
Bitcoin Price Still In Trouble—Why Recovery Remains Elusive
-
 Market23 hours ago
Crypto Market Mirrors Nasdaq and S&P 500 Amid Recession Fears
-
 Altcoin23 hours ago
Expert Reveals XRP Price Could Drop To $1.90 Before Rally To New Highs
-

 Market21 hours ago
Stellar (XLM) Falls 5% as Bearish Signals Strengthen