
Market
How Telegram Airdrops Has Affected Toncoin Network Activity

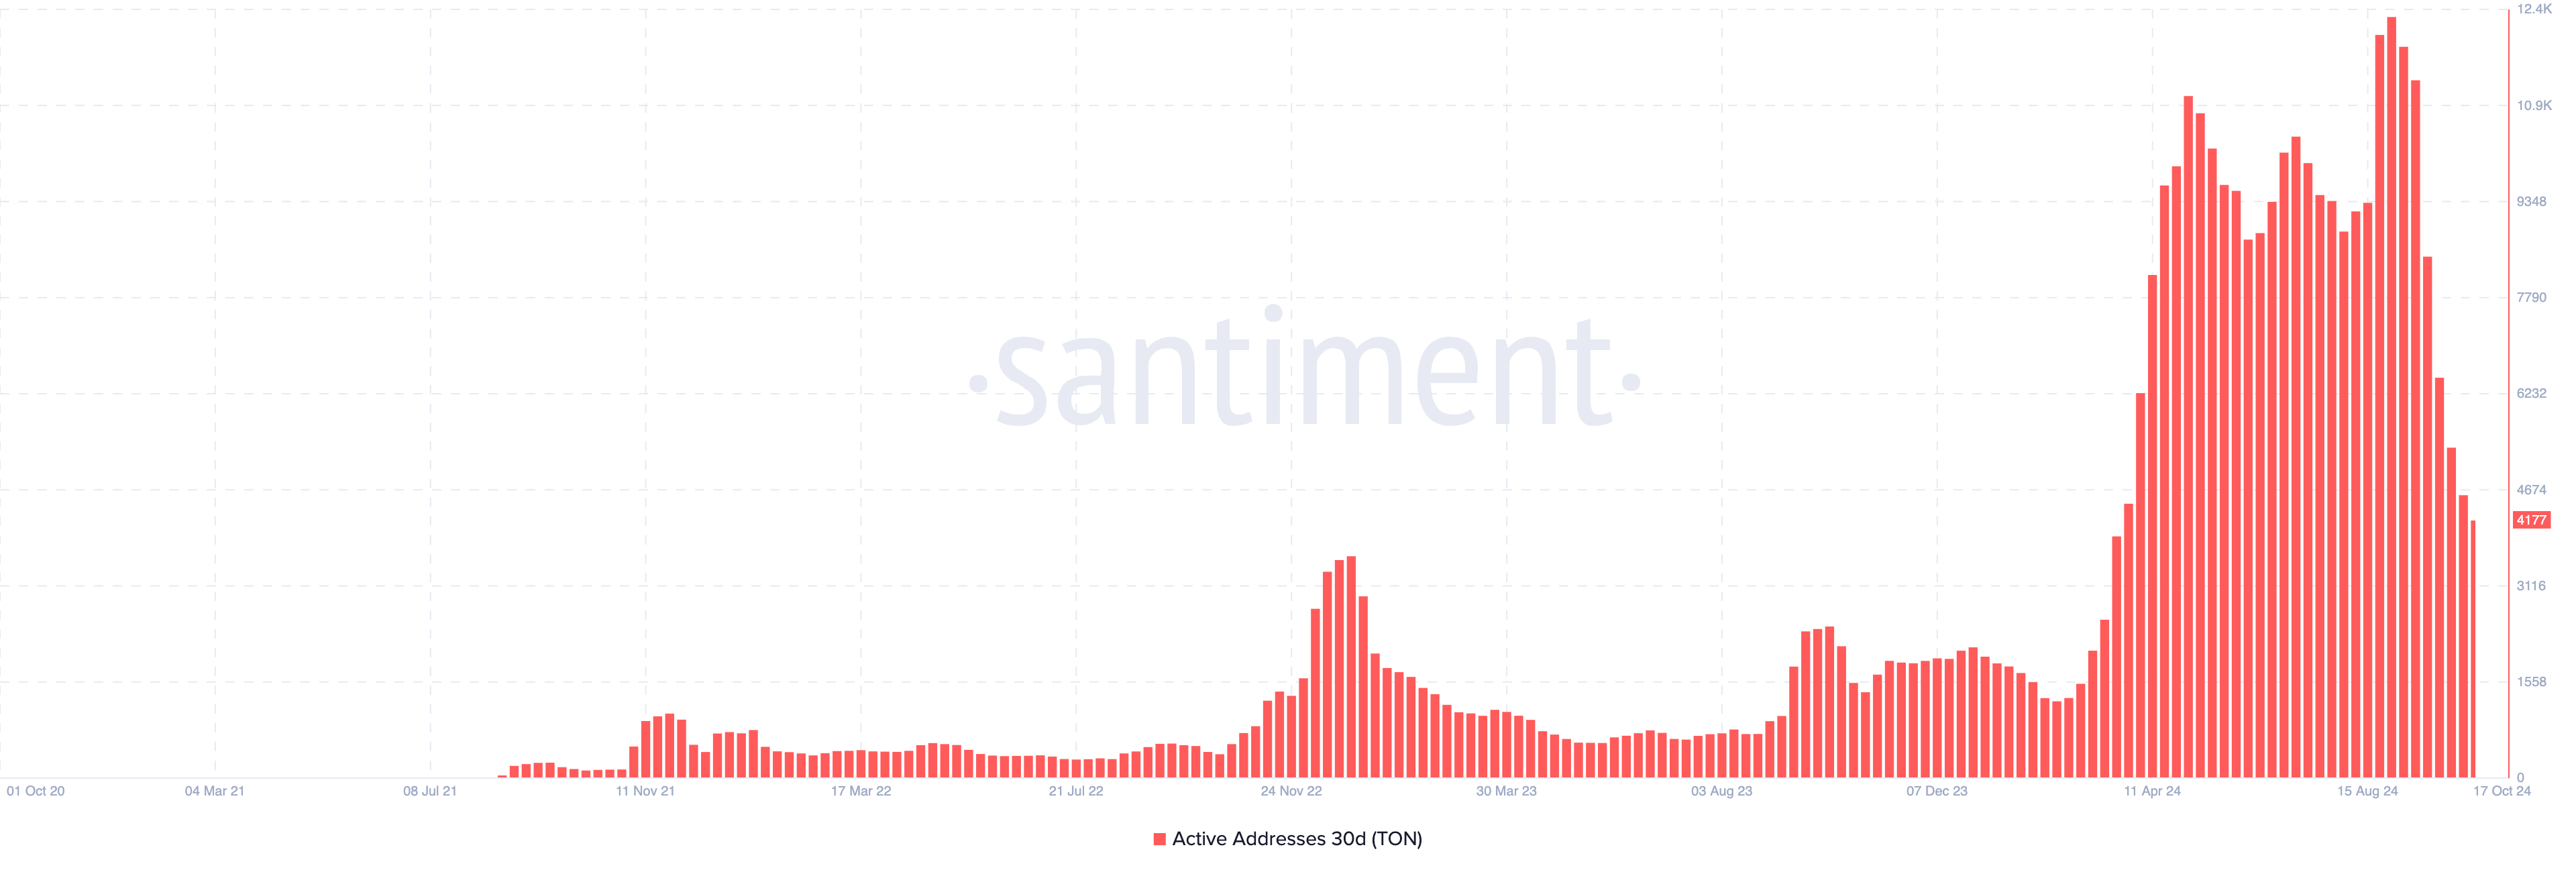
For most of the past few months, Telegram airdrops dominated the crypto market, fueling massive growth in Toncoin (TON) network activity. However, active addresses on the TON blockchain have now dropped to their lowest level since April.
But why has this suddenly dropped? This analysis highlights the causes and the potential impact it could have on Toncoin’s price
Telegram Users’ Disappointment Casts Doubt on Toncoin’s Recovery
Between August and September, Toncoin’s active addresses reached notable heights. That surge could be attributed to the launch of several Telegram airdrops, which market participants thought would return profitable gains.
In August, Telegram-native meme coin DOGS distributed over 40 billion tokens to eligible messaging app users. This was followed by the September launch of the widely adopted tap-to-earn mini-app game Hamster Kombat.
However, user reactions to both events revealed widespread dissatisfaction with the value of the airdropped tokens. Despite the hype before the Token Generation Event (TGE), many recipients expressed disappointment with the value of the tokens distributed.
Read more: What Are Telegram Mini Apps? A Guide for Crypto Beginners
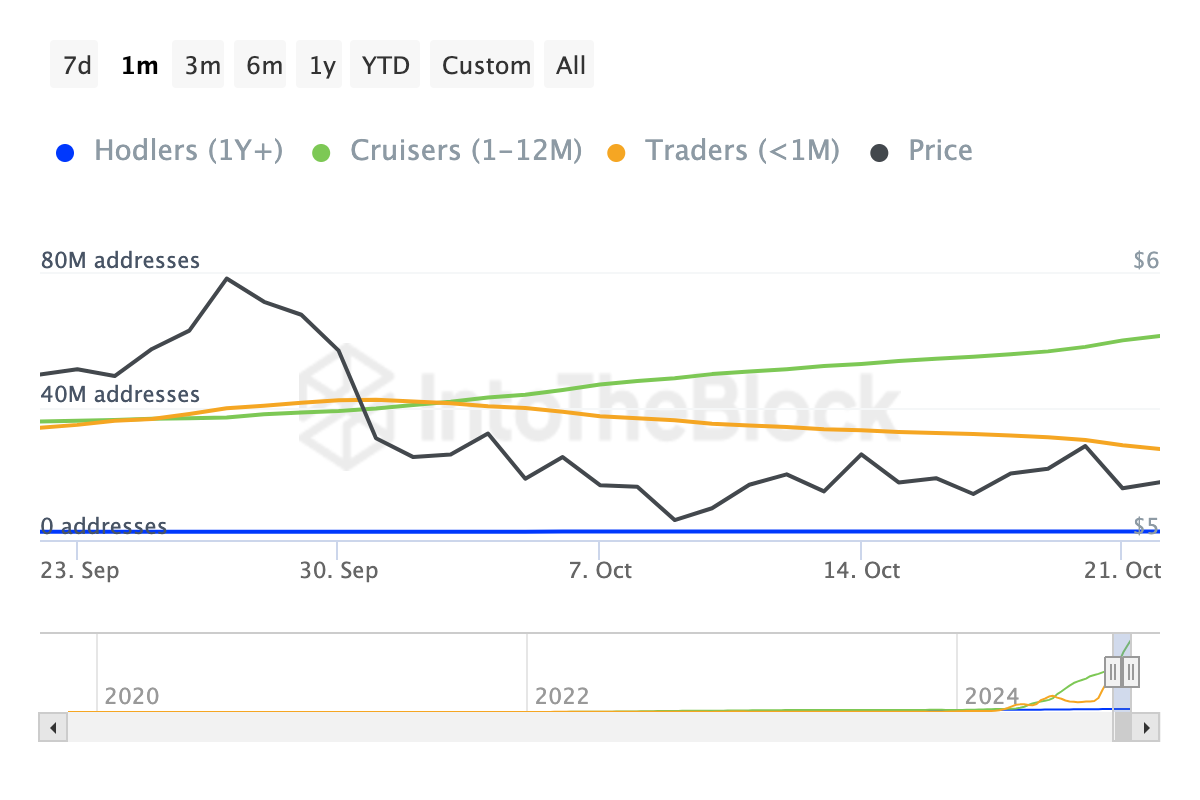
This sentiment likely contributed to the decline in engagement with Toncoin. Besides that, data from IntoTheBlock revealed a decline in the number of short-term holders. In the lead-up to the August and September airdrops, TON experienced a massive increase in the number of short-term holders.
This development fueled speculation that the TON’s price could return to $7. However, the shifting sentiment might have put that prediction to rest, as a shortage of demand might negatively affect the cryptocurrency’s value.
TON Price Prediction: Selling Pressure Could Drive It Down to $4
Currently, Toncoin’s price is $5.18, and the daily chart shows that the Chaikin Money Flow (CMF) has been in the negative zone since September 28.
The CMF is a technical indicator used to measure the buying and selling pressure of a security. Its primary function is to help distinguish between periods of accumulation (when investors are actively buying) and distribution (when investors are selling or reducing their positions).
When the CMF is above the zero line, it suggests that there is net accumulation, meaning the asset is experiencing more buying than selling pressure. This can be interpreted as a bullish signal, indicating that investors are confident in the security’s prospects.
Conversely, when the indicator is below the zero line, it signals net distribution, implying increased selling pressure and a potential bearish outlook for the asset. With the current position, Toncoin’s price could experience a decrease to $4.46.
Read more: 6 Best Toncoin (TON) Wallets in 2024
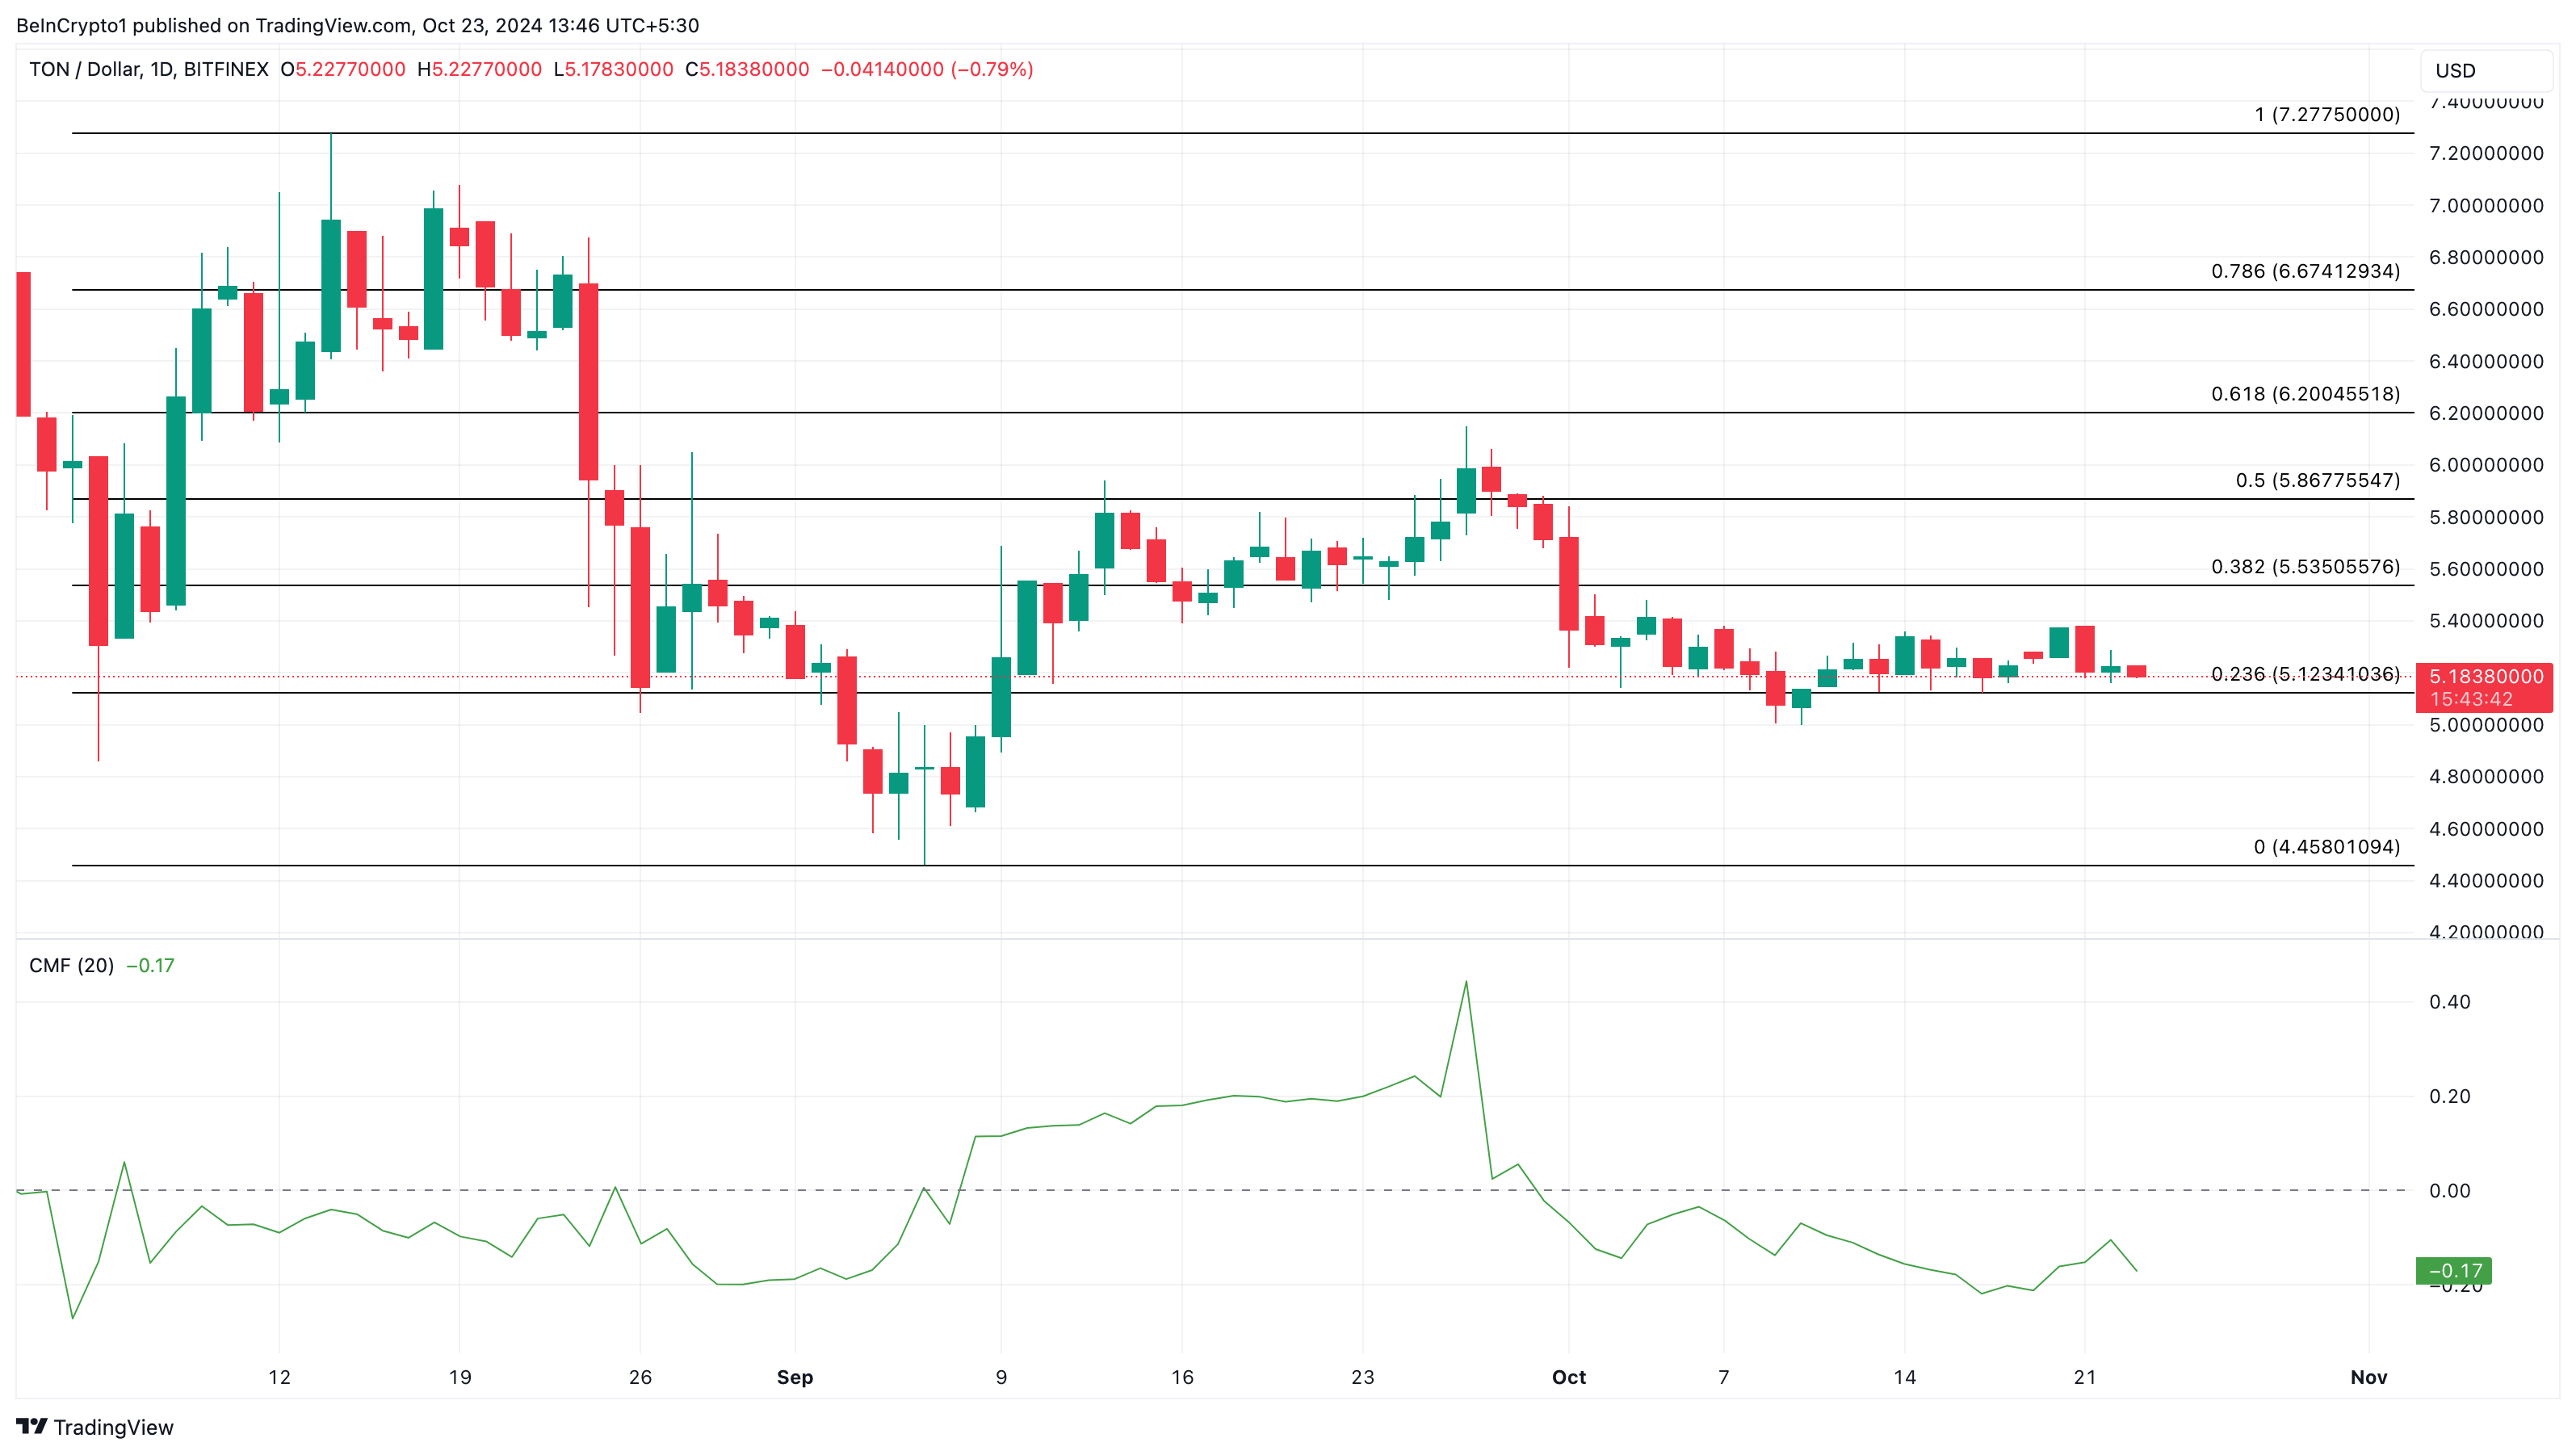
However, if the upcoming Telegram airdrops slated for October bring in good value, this prediction could change. In that scenario, demand for TON might increase as the price could rally to $6.20.
Disclaimer
In line with the Trust Project guidelines, this price analysis article is for informational purposes only and should not be considered financial or investment advice. BeInCrypto is committed to accurate, unbiased reporting, but market conditions are subject to change without notice. Always conduct your own research and consult with a professional before making any financial decisions. Please note that our Terms and Conditions, Privacy Policy, and Disclaimers have been updated.


ZachXBT, a well-known blockchain investigator, recently shared two key “minimum checks” on Telegram to avoid crypto scams.
He emphasized that users must accept full financial responsibility if they take risks in these situations and added that recovering lost funds would be extremely difficult.
Evaluating a Project’s Credibility is Crucial
ZachXBT highlighted two critical scenarios: depositing funds into forked DeFi protocols on newly launched EVM chains and getting scammed by projects with few smart followers on Kaito.
“If you make either of these decisions, it is your own personal choice to risk funds, and I will NOT help you,” ZachXBT stressed.
Many newly launched DeFi protocols on EVM chains are replicas of existing ones. Their teams often do not create original code but instead, fork from established protocols. This process requires minimal technical skills yet introduces significant security risks.
A recent incident highlighted the risks in the DeFi space. The DeFi protocol SIR.trading was reportedly hacked, leading to an estimated loss of $350,000. Despite the project’s documentation promoting it as a “new DeFi protocol for safer leveraged trading,” it acknowledged the risks related to smart contract vulnerabilities.
This case illustrates how new DeFi protocols often become targets for hackers. Additionally, in late March, the DeFi lending protocol Abracadabra suffered a loss of approximately $13 million due to an exploit involving collateralized tokens.
The second situation ZachXBT warned about involves getting “rugged” (falling victim to a rug pull) by projects with few smart followers on Kaito. Kaito is an AI-powered analysis tool that measures real community interest. He advised that checking followers’ numbers and quality is a basic step to avoid falling for projects that use fake engagement or empty marketing hype.
Investor Xero agreed with ZachXBT, stating that Kaito can be a credibility assessment tool.
“Kaito has become an amazing security and reputation tool that I value over others. It can help you identify an impersonator or a new rug project fast. If a 40k+ follower project isn’t connecting with real smart followers, it’s not legit,” Investor Xero commented.
Other Emerging Crypto Scams
In addition to ZachXBT’s warnings, several new scam tactics have recently been flagged.
Investor Jerome warned about a scheme that exploits browsers’ automatic download function to trick users into downloading malicious software.
Another method involves scammers creating and sending small transactions. They would be often as little as 0.001 tokens—using fake wallet addresses that closely resemble legitimate ones. Their goal is to deceive users into copying and pasting the fraudulent address when making future transactions.
Additionally, Microsoft has identified StilachiRAT, a new remote access trojan specifically designed to target cryptocurrency wallets and login credentials.
According to a Chainalysis report, from 2021 to 2024, decentralized finance (DeFi) platforms have been the primary targets of crypto hacks.
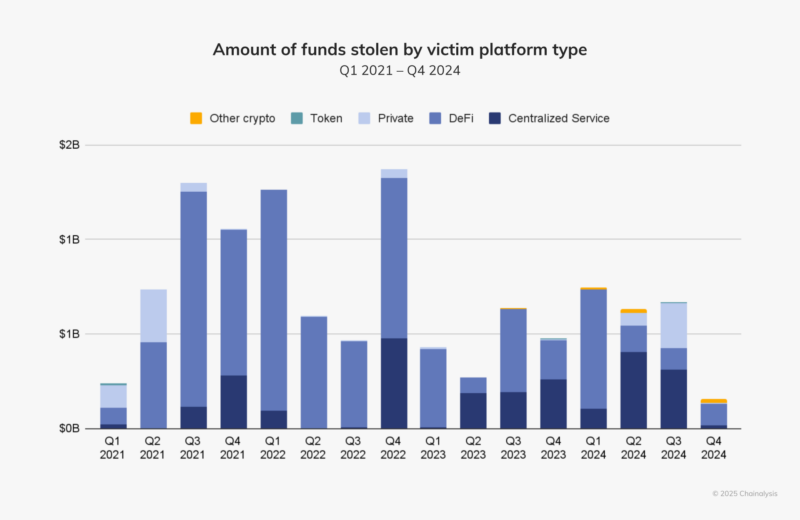
The report explains that DeFi platforms may be more vulnerable because developers prioritize rapid growth and launch over security measures. This lack of security focus makes them prime targets for hackers.
Disclaimer
In adherence to the Trust Project guidelines, BeInCrypto is committed to unbiased, transparent reporting. This news article aims to provide accurate, timely information. However, readers are advised to verify facts independently and consult with a professional before making any decisions based on this content. Please note that our Terms and Conditions, Privacy Policy, and Disclaimers have been updated.

Dogecoin has faced a series of setbacks recently, including a failed breakout attempt that led to a decline in its price. This downward movement was further exacerbated by a recent comment from Elon Musk, which cast doubt on Dogecoin’s future.
However, despite these challenges, the altcoin is showing some signs of recovery, largely driven by long-term holders (LTHs) who accumulate more DOGE at current low prices.
Dogecoin Is Facing Mixed Signals
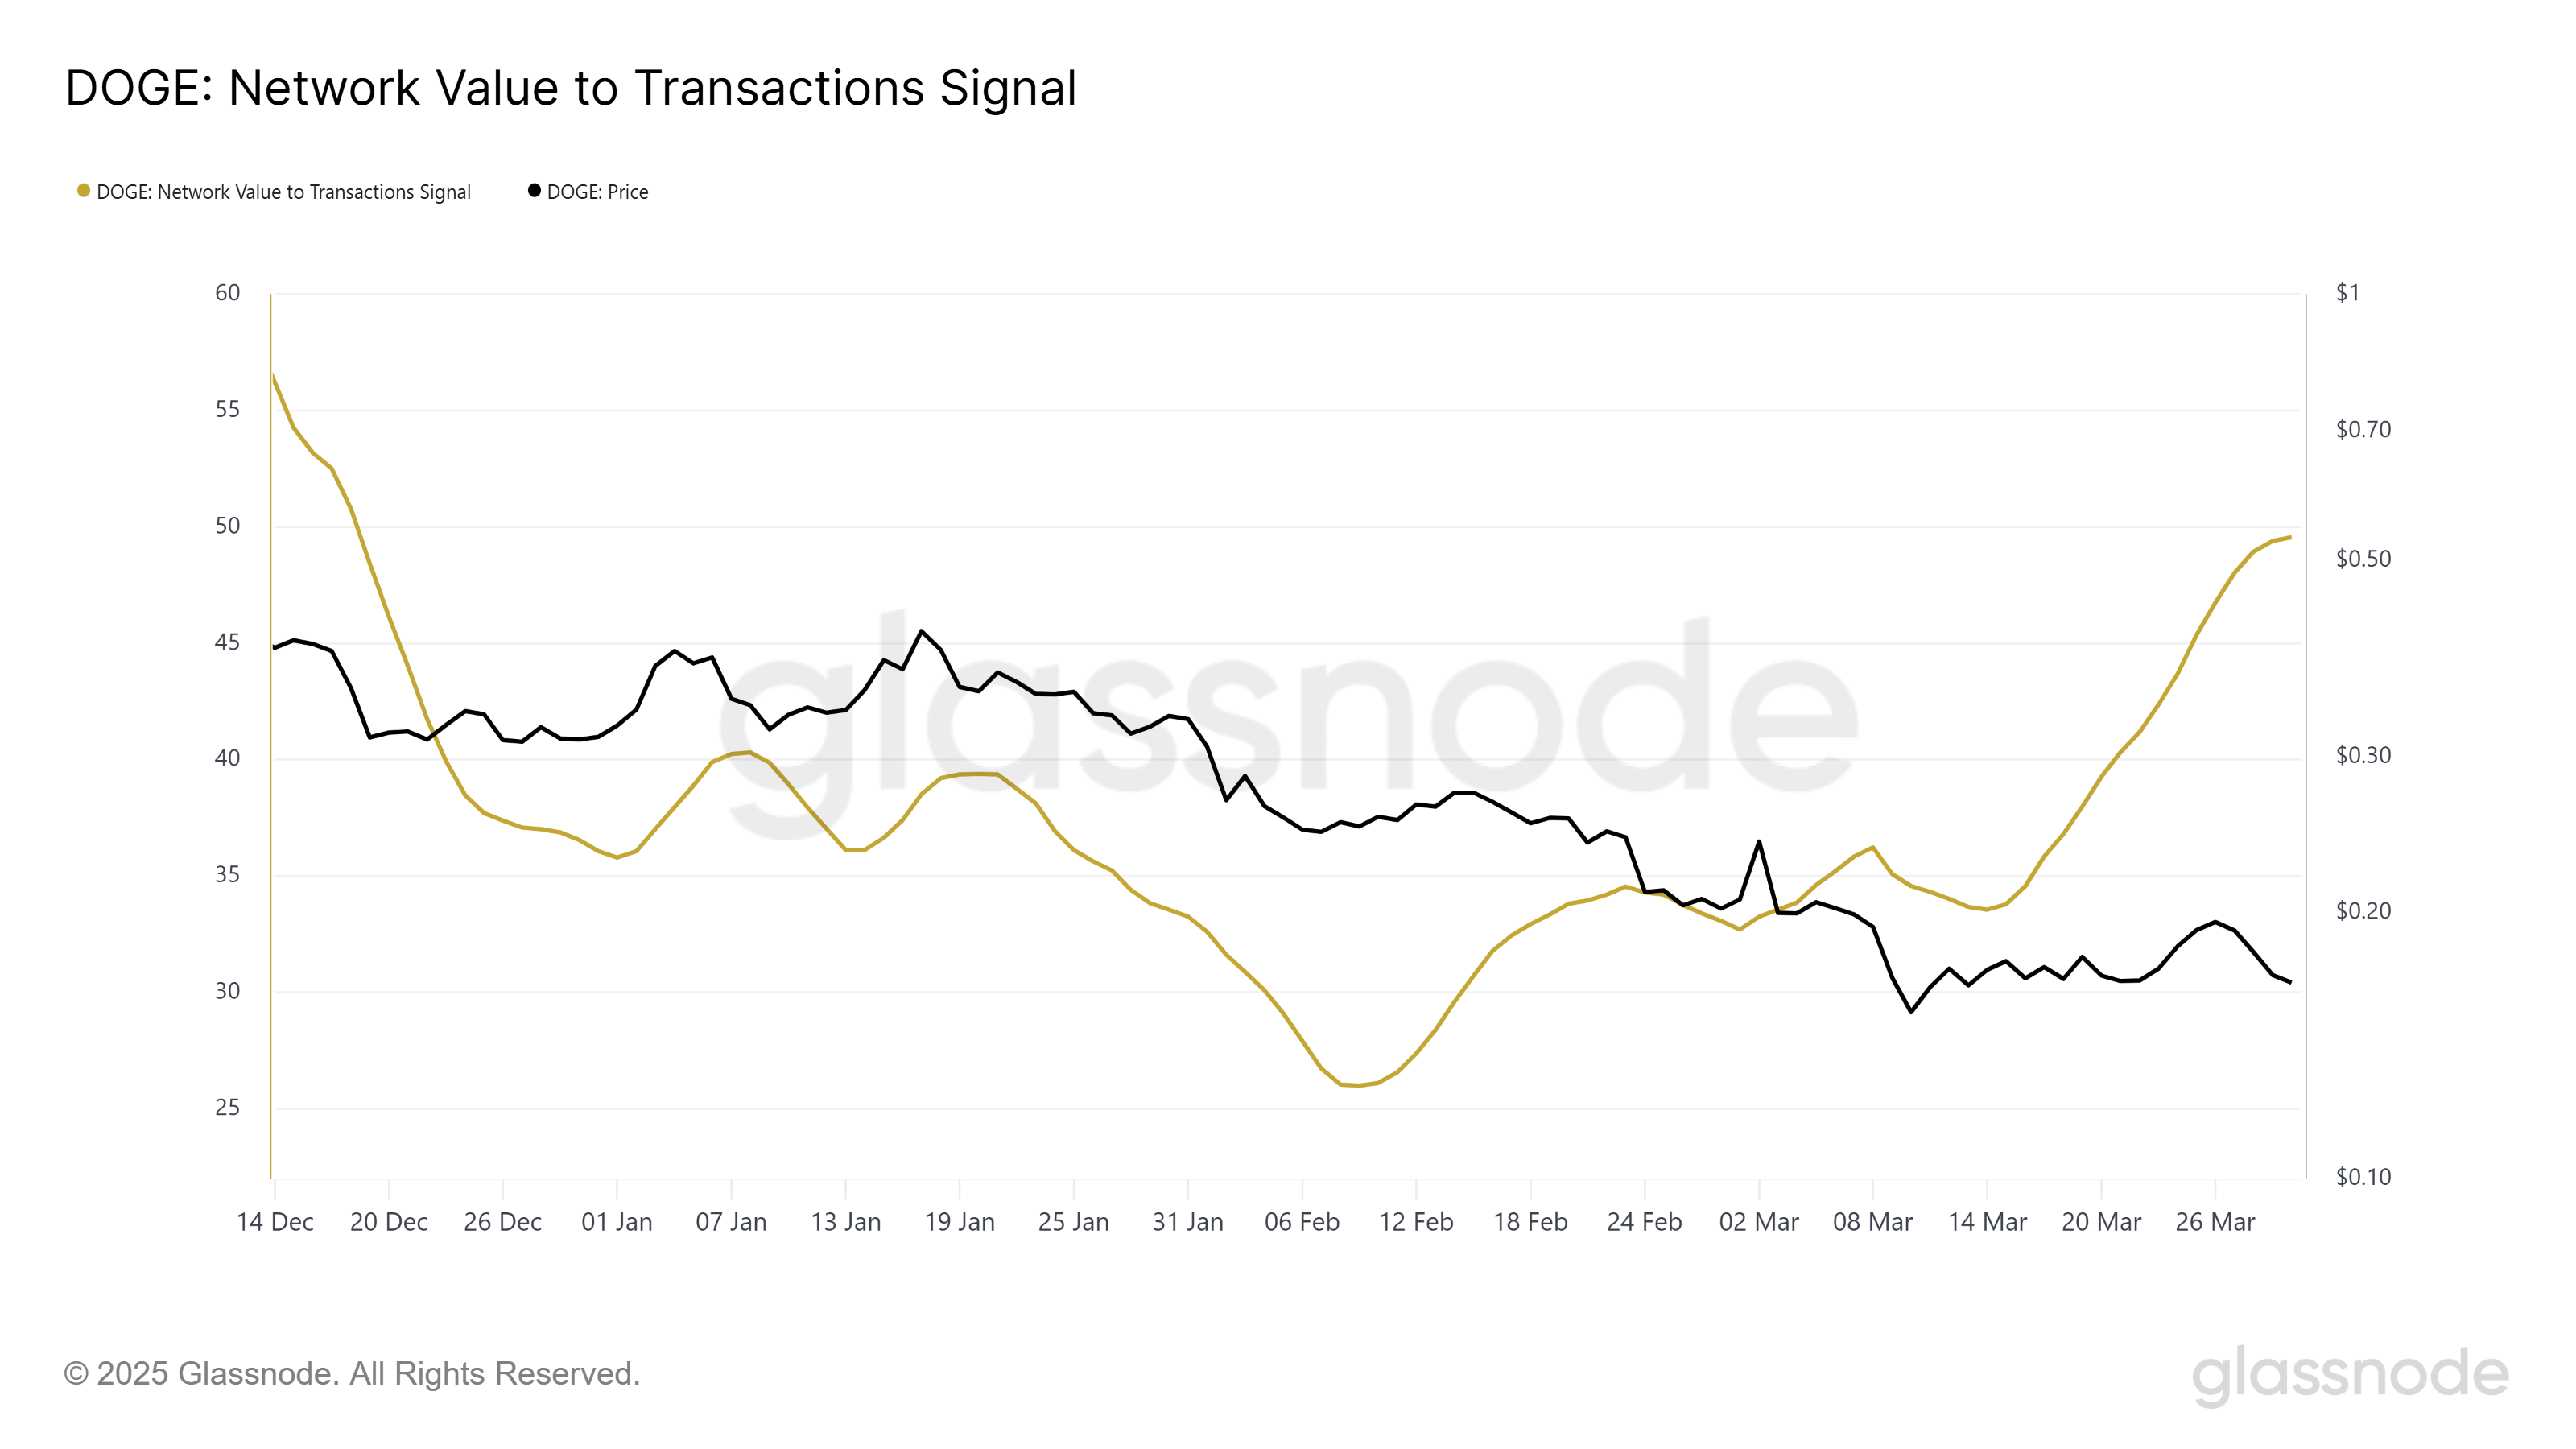
Dogecoin’s Network Value to Transaction (NVT) ratio has spiked significantly, reaching a three-month high. This suggests that the network’s value does not match the number of transactions, pointing to a possible lack of investor confidence.
Elon Musk’s recent comment regarding DOGE further fueled the discourse surrounding the cryptocurrency. He clarified that the US government does not intend to use Dogecoin in any form, which led to some negative sentiment. This statement dampened expectations for the coin, although it hasn’t completely derailed its market standing.
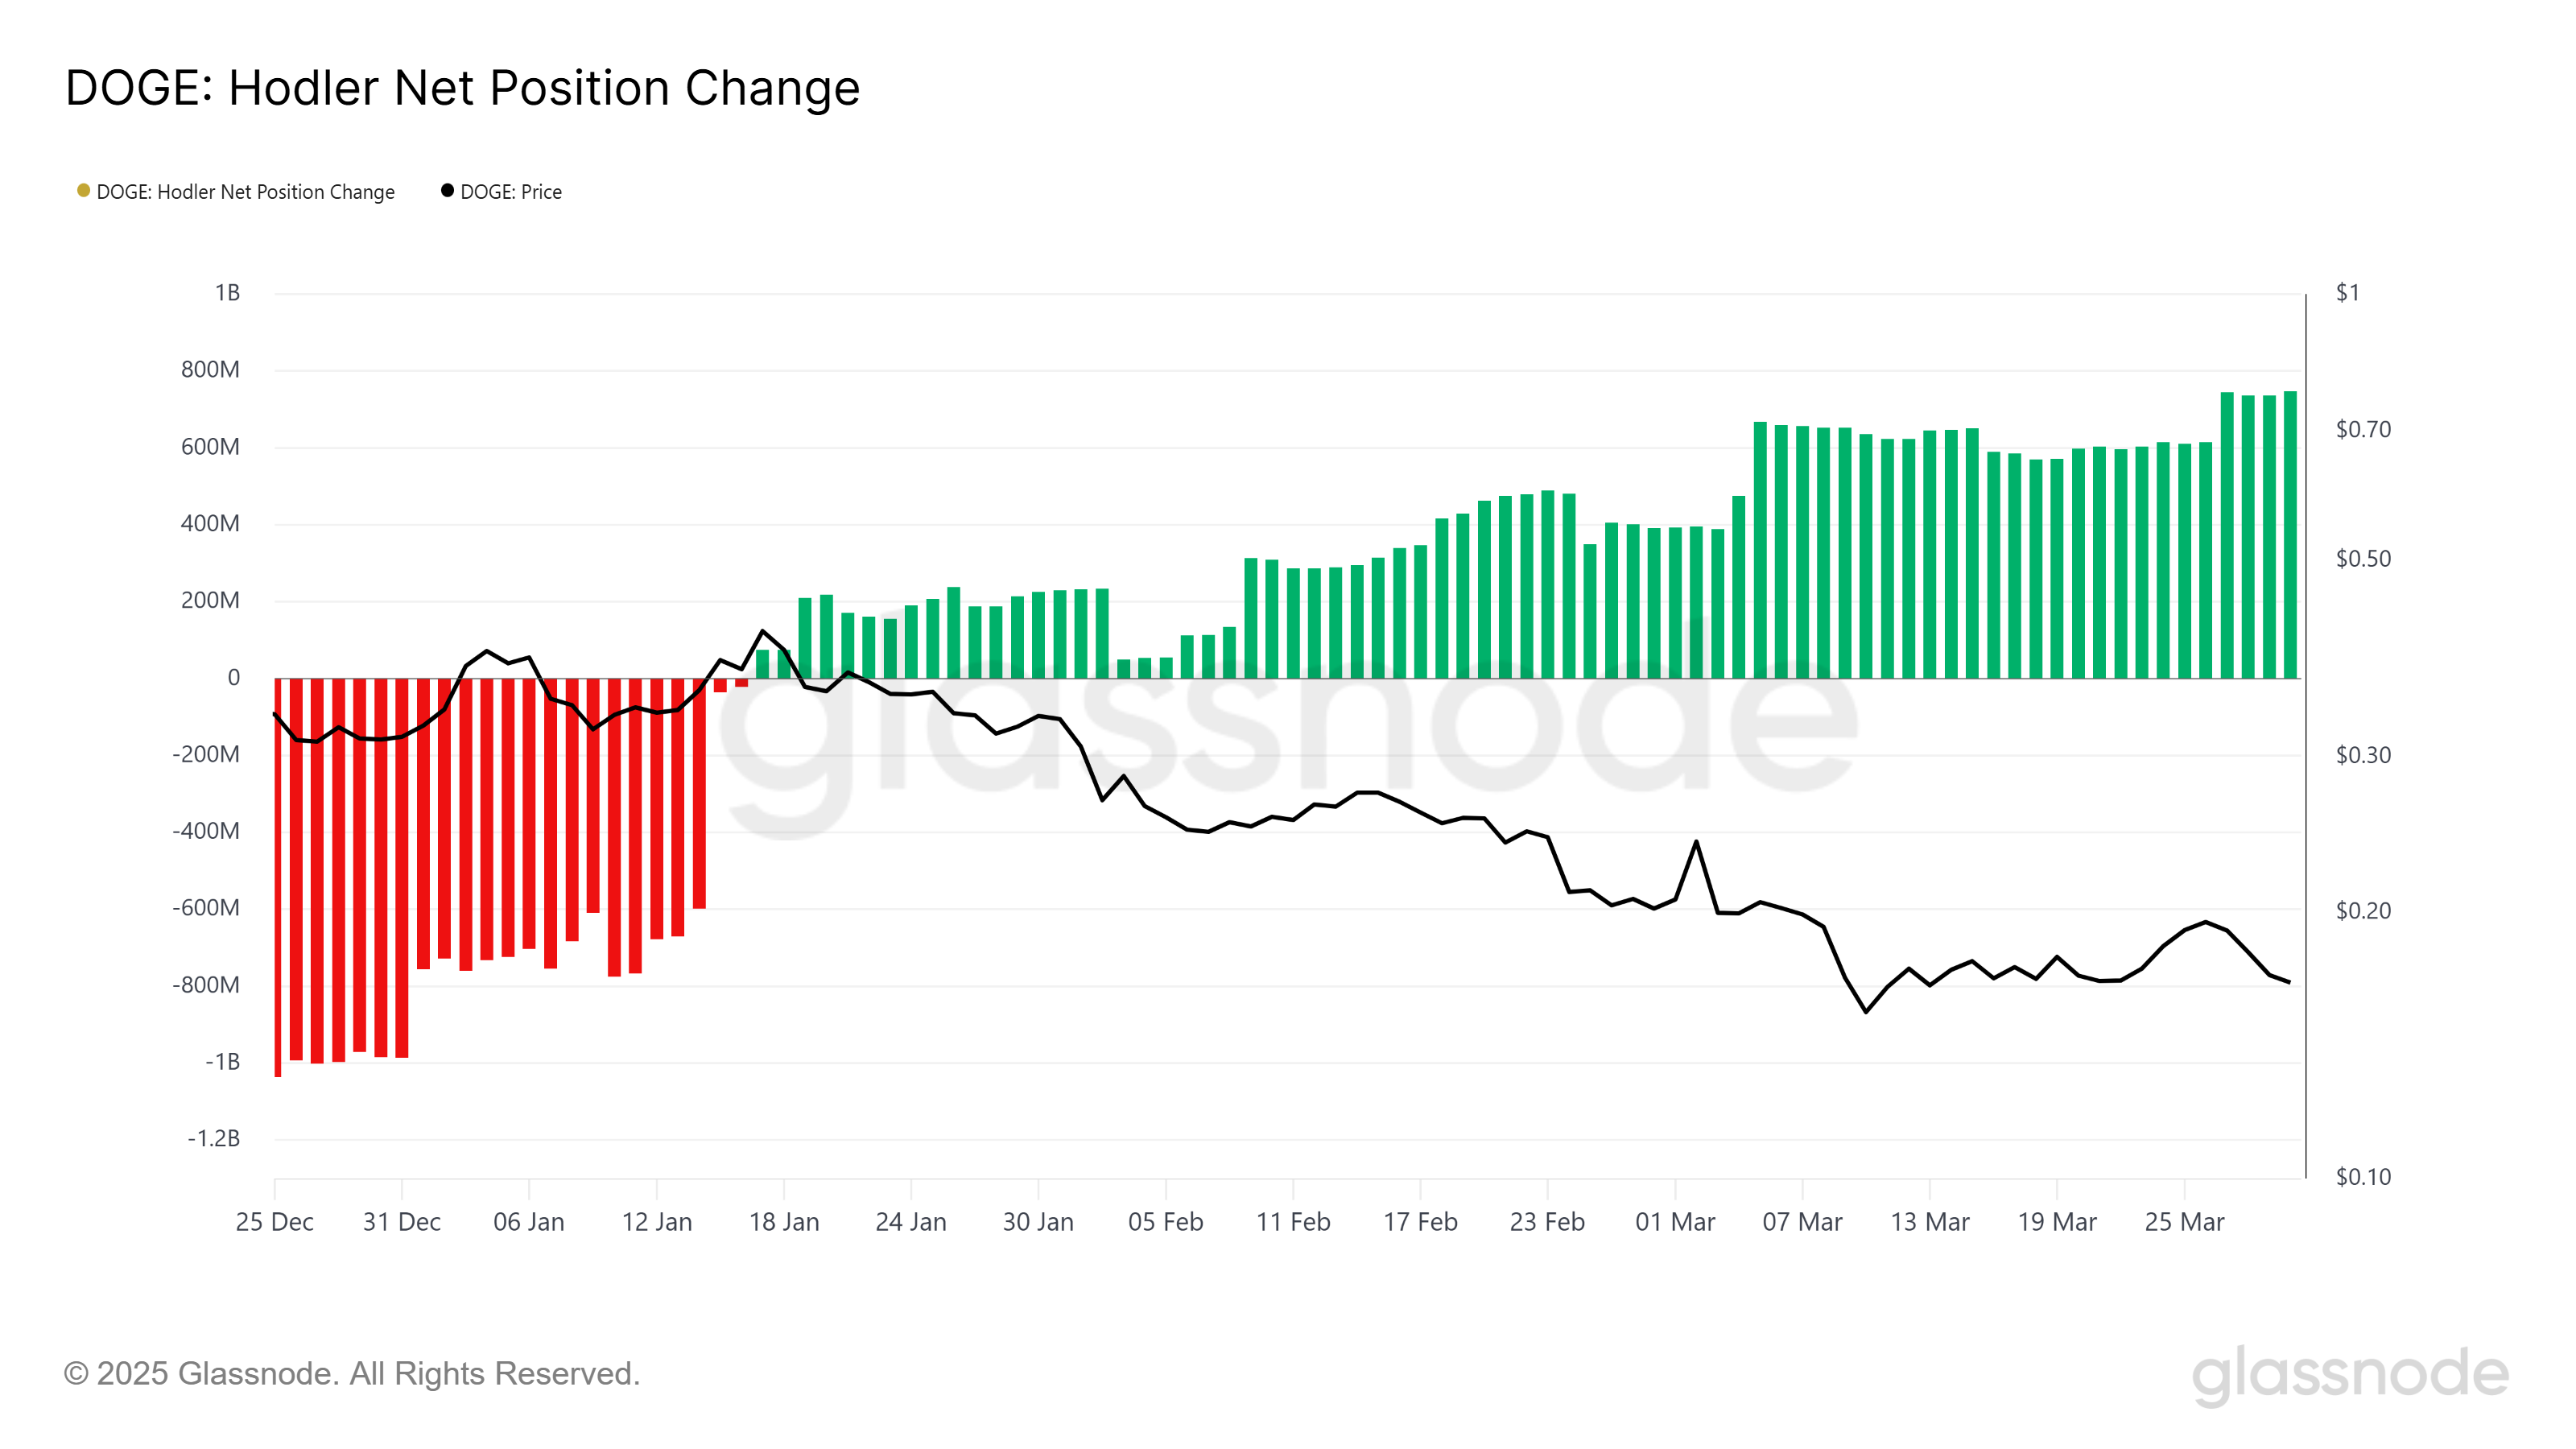
The macro momentum of Dogecoin shows signs of stabilizing, as evidenced by the recent spike in the HODLer Net Position Change. LTHs have been actively accumulating DOGE during the recent dip, which indicates strong conviction among these holders.
This accumulation provides a level of support, potentially helping the coin recover and preventing further price declines. The increased position change suggests that LTHs are confident in the long-term viability of Dogecoin despite recent market turbulence and Musk’s controversial comment.
This continued accumulation by LTHs could lead to a floor forming under Dogecoin’s price, providing a buffer against further bearish pressures. As the market stabilizes and sentiment shifts, these holders could become a driving force that will trigger the next upward movement.
DOGE Price Stumbles, But Can It Recover?
Dogecoin is currently trading at $0.163, with the price just below the support level of $0.164. Over the last five days, the coin has experienced a 16% decline following a failed attempt to break through the $0.198 resistance level. This failure to breach key resistance levels indicates that DOGE may not experience immediate price gains without external catalysts.
Given the current market conditions, it’s likely that Dogecoin will not experience significant declines in the near future. The coin may reclaim $0.164 as support and continue consolidating just below the $0.198 resistance. However, this consolidation could persist until stronger market cues emerge to push the price higher.

The only scenario in which this bullish-neutral outlook would be invalidated is if Musk’s comment causes further damage to DOGE’s price. In that case, the meme coin could dip to $0.147, extending its recent losses. A sustained downturn would signal more negative sentiment in the market and potentially halt Dogecoin’s recovery.
Disclaimer
In line with the Trust Project guidelines, this price analysis article is for informational purposes only and should not be considered financial or investment advice. BeInCrypto is committed to accurate, unbiased reporting, but market conditions are subject to change without notice. Always conduct your own research and consult with a professional before making any financial decisions. Please note that our Terms and Conditions, Privacy Policy, and Disclaimers have been updated.

Bitcoin’s recent price action has shown some concerning signs. The crypto king has failed to break through key resistance levels, leaving it vulnerable to further declines.
As Bitcoin inches closer to testing the $80,000 support level, the potential for a Death Cross looms, increasing bearish sentiment in the market.
Bitcoin Investors Are Skeptical
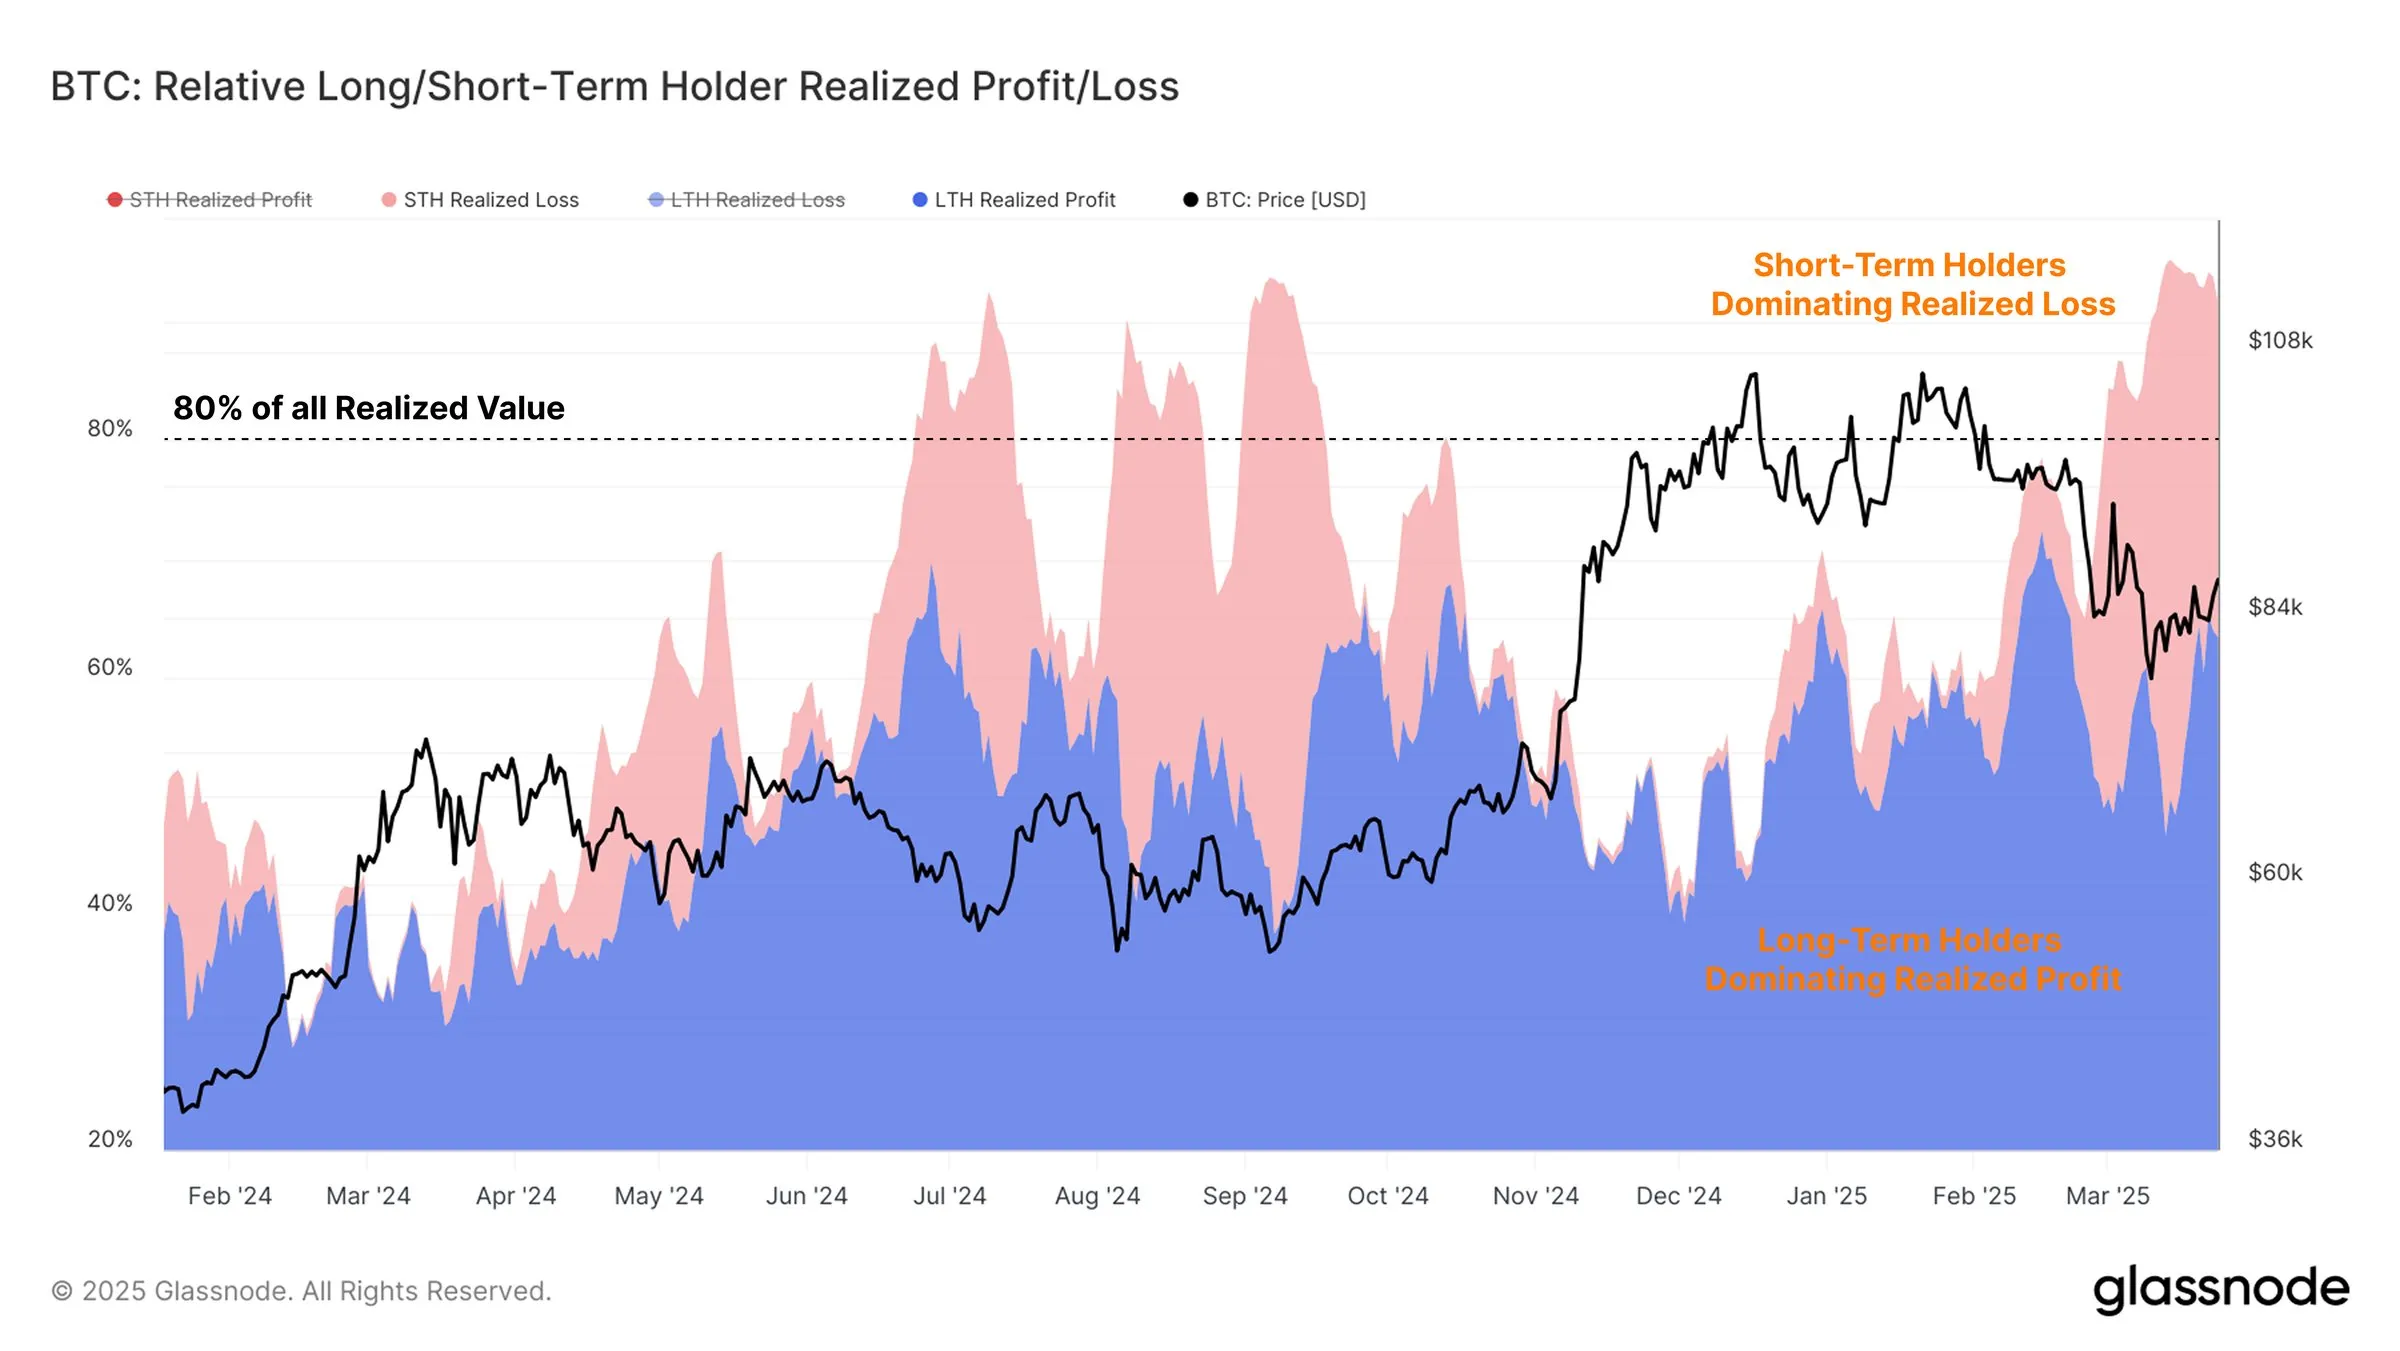
Short-Term Holders (STHs), who buy at higher prices, are primarily responsible for the ongoing losses. These investors have been actively noting losses in response to Bitcoin’s volatile market conditions, reflecting the unpredictable environment that has made it difficult for new investors to navigate.
Meanwhile, Long-Term Holders (LTHs) continue to realize profits, benefiting from their extended market presence. However, the current market conditions show stagnation in new capital inflows, with LTH profits offset by STH losses. This creates weaker demand and resistance, signaling a potential slowdown in price momentum.
Maintaining bullishness in the market typically requires consistent capital inflows, but the market now seems to be lacking that crucial support. The overall sentiment reflects a neutral stance, with both profit-taking and loss-realization balancing out.
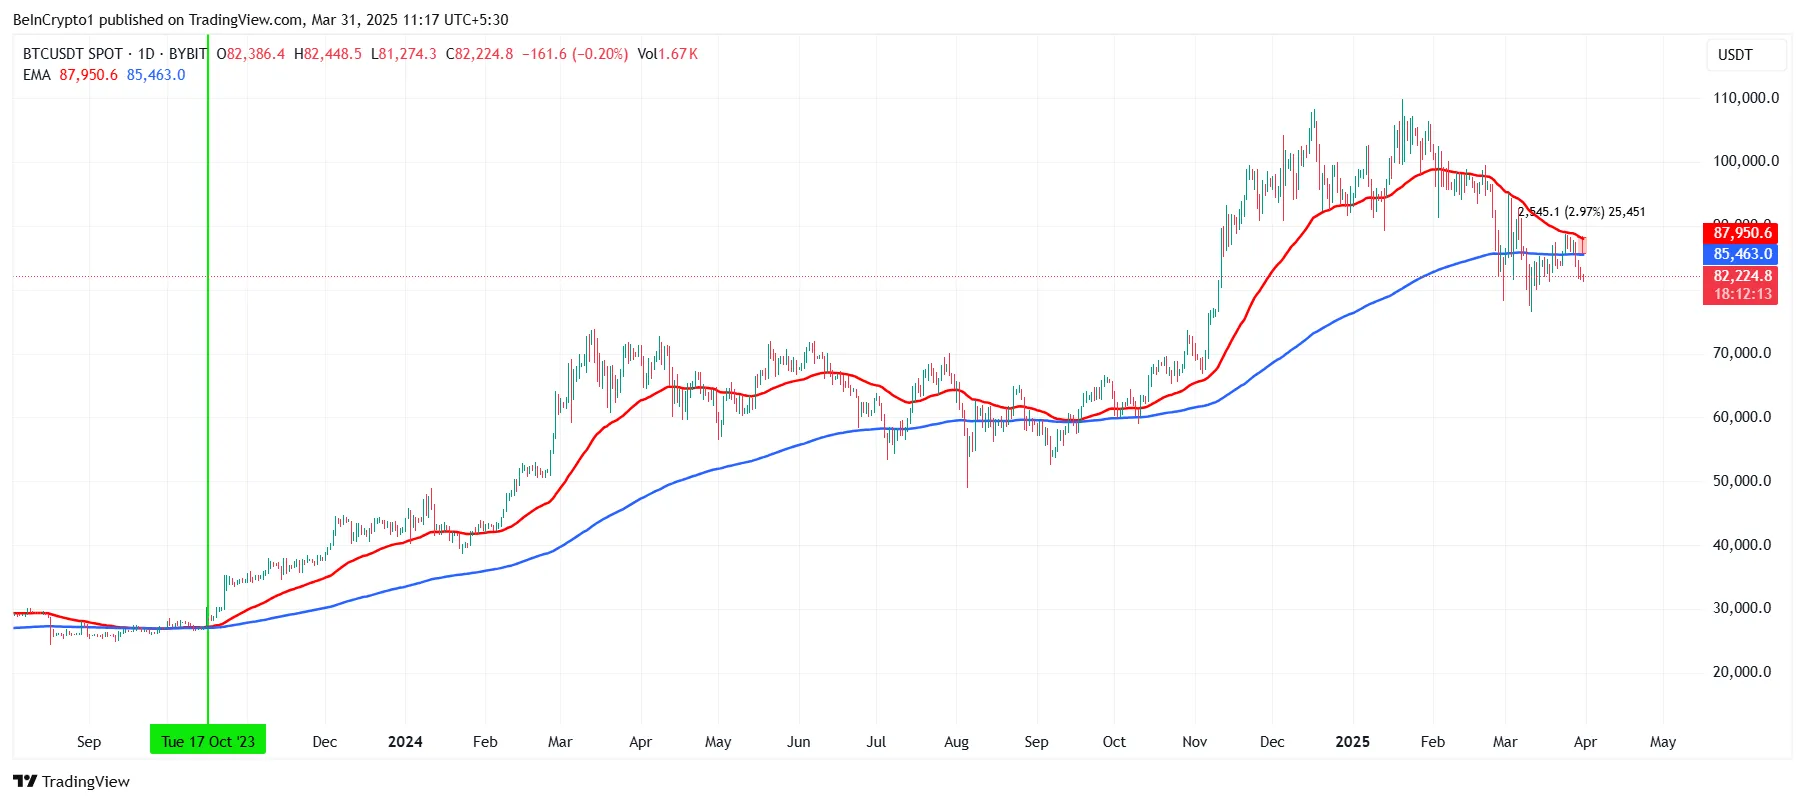
The crypto king’s macro momentum is showing additional signs of bearish pressure, particularly with the Exponential Moving Averages (EMAs). The 200-day EMA is less than 3% away from crossing the 50-day EMA, which would result in a Death Cross. This technical pattern has historically signaled significant corrections in price, marking a potential end to Bitcoin’s 18-month-long Golden Cross.
As the EMAs approach this critical point, traders and investors are closely watching for any signs of a correction. The fear of a Death Cross brings further concern to Bitcoin’s price stability. If the 50-day EMA crosses below the 200-day EMA, it could trigger more sell-offs, intensifying the bearish sentiment in the market.
Is BTC Price Primed For Further Decline?
Bitcoin is currently trading at $82,248, nearing the key psychological support level of $80,000. Despite attempts at a breakout, Bitcoin has failed to move beyond the two-month-long broadening descending wedge pattern. This pattern suggests that Bitcoin could be on the brink of further decline.
If the downward momentum persists, Bitcoin is likely to fall through the $80,000 support level and approach $76,741. This scenario would reinforce the bearish outlook, especially considering the technical indicators and the lack of strong buying support. A breakdown below these levels could signal a deeper correction, with the potential for further declines.
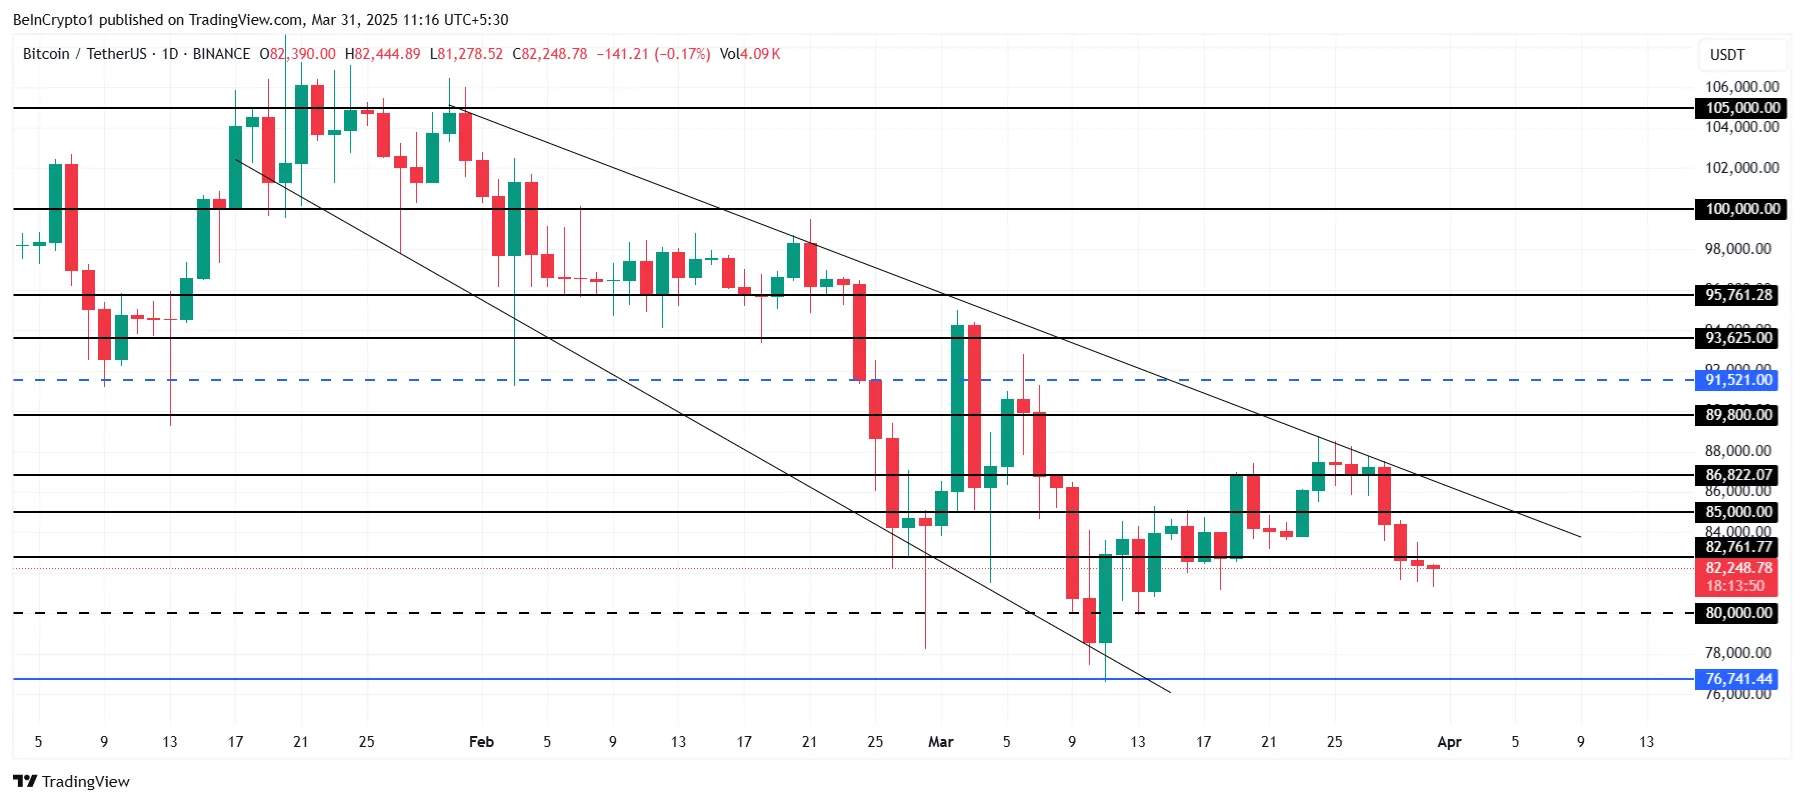
However, this short-term bearish thesis can be invalidated if Bitcoin’s price manages to reclaim $82,761 as support. If Bitcoin breaks through the $85,000 barrier, it could break out of the current pattern, signaling a potential reversal. A strong rally above $86,822 would suggest a resumption of the bullish trend, invalidating the bearish momentum that currently dominates the market.
Disclaimer
In line with the Trust Project guidelines, this price analysis article is for informational purposes only and should not be considered financial or investment advice. BeInCrypto is committed to accurate, unbiased reporting, but market conditions are subject to change without notice. Always conduct your own research and consult with a professional before making any financial decisions. Please note that our Terms and Conditions, Privacy Policy, and Disclaimers have been updated.

Don’t Fall for These Common Crypto Scams

US Macroeconomic Indicators This Week: NFP, JOLTS, & More

This Is How Dogecoin Price Reacted To Elon Musk’s Comment
Ethereum Is ‘Completely Dead’ As An Investment: Hedge Fund
Bitcoin Price Nears $80,000; Fuels Death Cross Potential

Dogecoin (DOGE) Bulls In Trouble—Can They Prevent a Drop Below $0.15?

2.52 Million Altcoins Are Ruining Crypto’s Future

Animoca Brands Valuation Tanks 75% In Two Years, Here’s Why

Crypto exchange BingX hacked for $43 million

Are The Big Players Losing Interest?

Hong Kong’s Securities Association Tips Authorities On Crypto Self-Regulation

Coinbase cbBTC Set to go Live on Solana
2.52 Million Altcoins Are Ruining Crypto’s Future
Animoca Brands Valuation Tanks 75% In Two Years, Here’s Why
Crypto exchange BingX hacked for $43 million
Are The Big Players Losing Interest?
Hong Kong’s Securities Association Tips Authorities On Crypto Self-Regulation
Coinbase cbBTC Set to go Live on Solana
-

 Ethereum22 hours ago
Ethereum Analyst Eyes $1,200-$1,300 Level As Potential Acquisition Zone – Details
-

 Ethereum21 hours ago
Whales Accumulate 470,000 Ethereum In One Week – Bullish Momentum Ahead?
-

 Ethereum23 hours ago
Ethereum May Have Hit Cycle Bottom, But Pricing Bands Signal Strong Resistance At $2,300
-

 Bitcoin22 hours ago
Gold Keeps Outperforming Bitcoin Amid Trump’s Trade War Chaos
-

 Market20 hours ago
3 Token Unlocks for April: Parcl, deBridge, Scroll
-
 Regulation18 hours ago
Japan Set To Classify Cryptocurrencies As Financial Products, Here’s All
-

 Market17 hours ago
Top 3 Made in USA Coins to Watch This Week
-

 Ethereum24 hours ago
Ethereum MVRV Ratio Nears 160-Day MA Crossover – Accumulation Trend Ahead?