
Market
Why Solana Price May Climb Above $200
Layer 1 (L1) blockchain Solana (SOL) has witnessed a notable surge in user activity over the past month. The chain’s daily active address and transaction count have skyrocketed by double digits in the past 30 days.
This uptick in network demand may directly fuel SOL’s rally above the $200 price mark for the first time since April. This analysis delves into the factors that may make that happen.
Solana Users Increase in Number
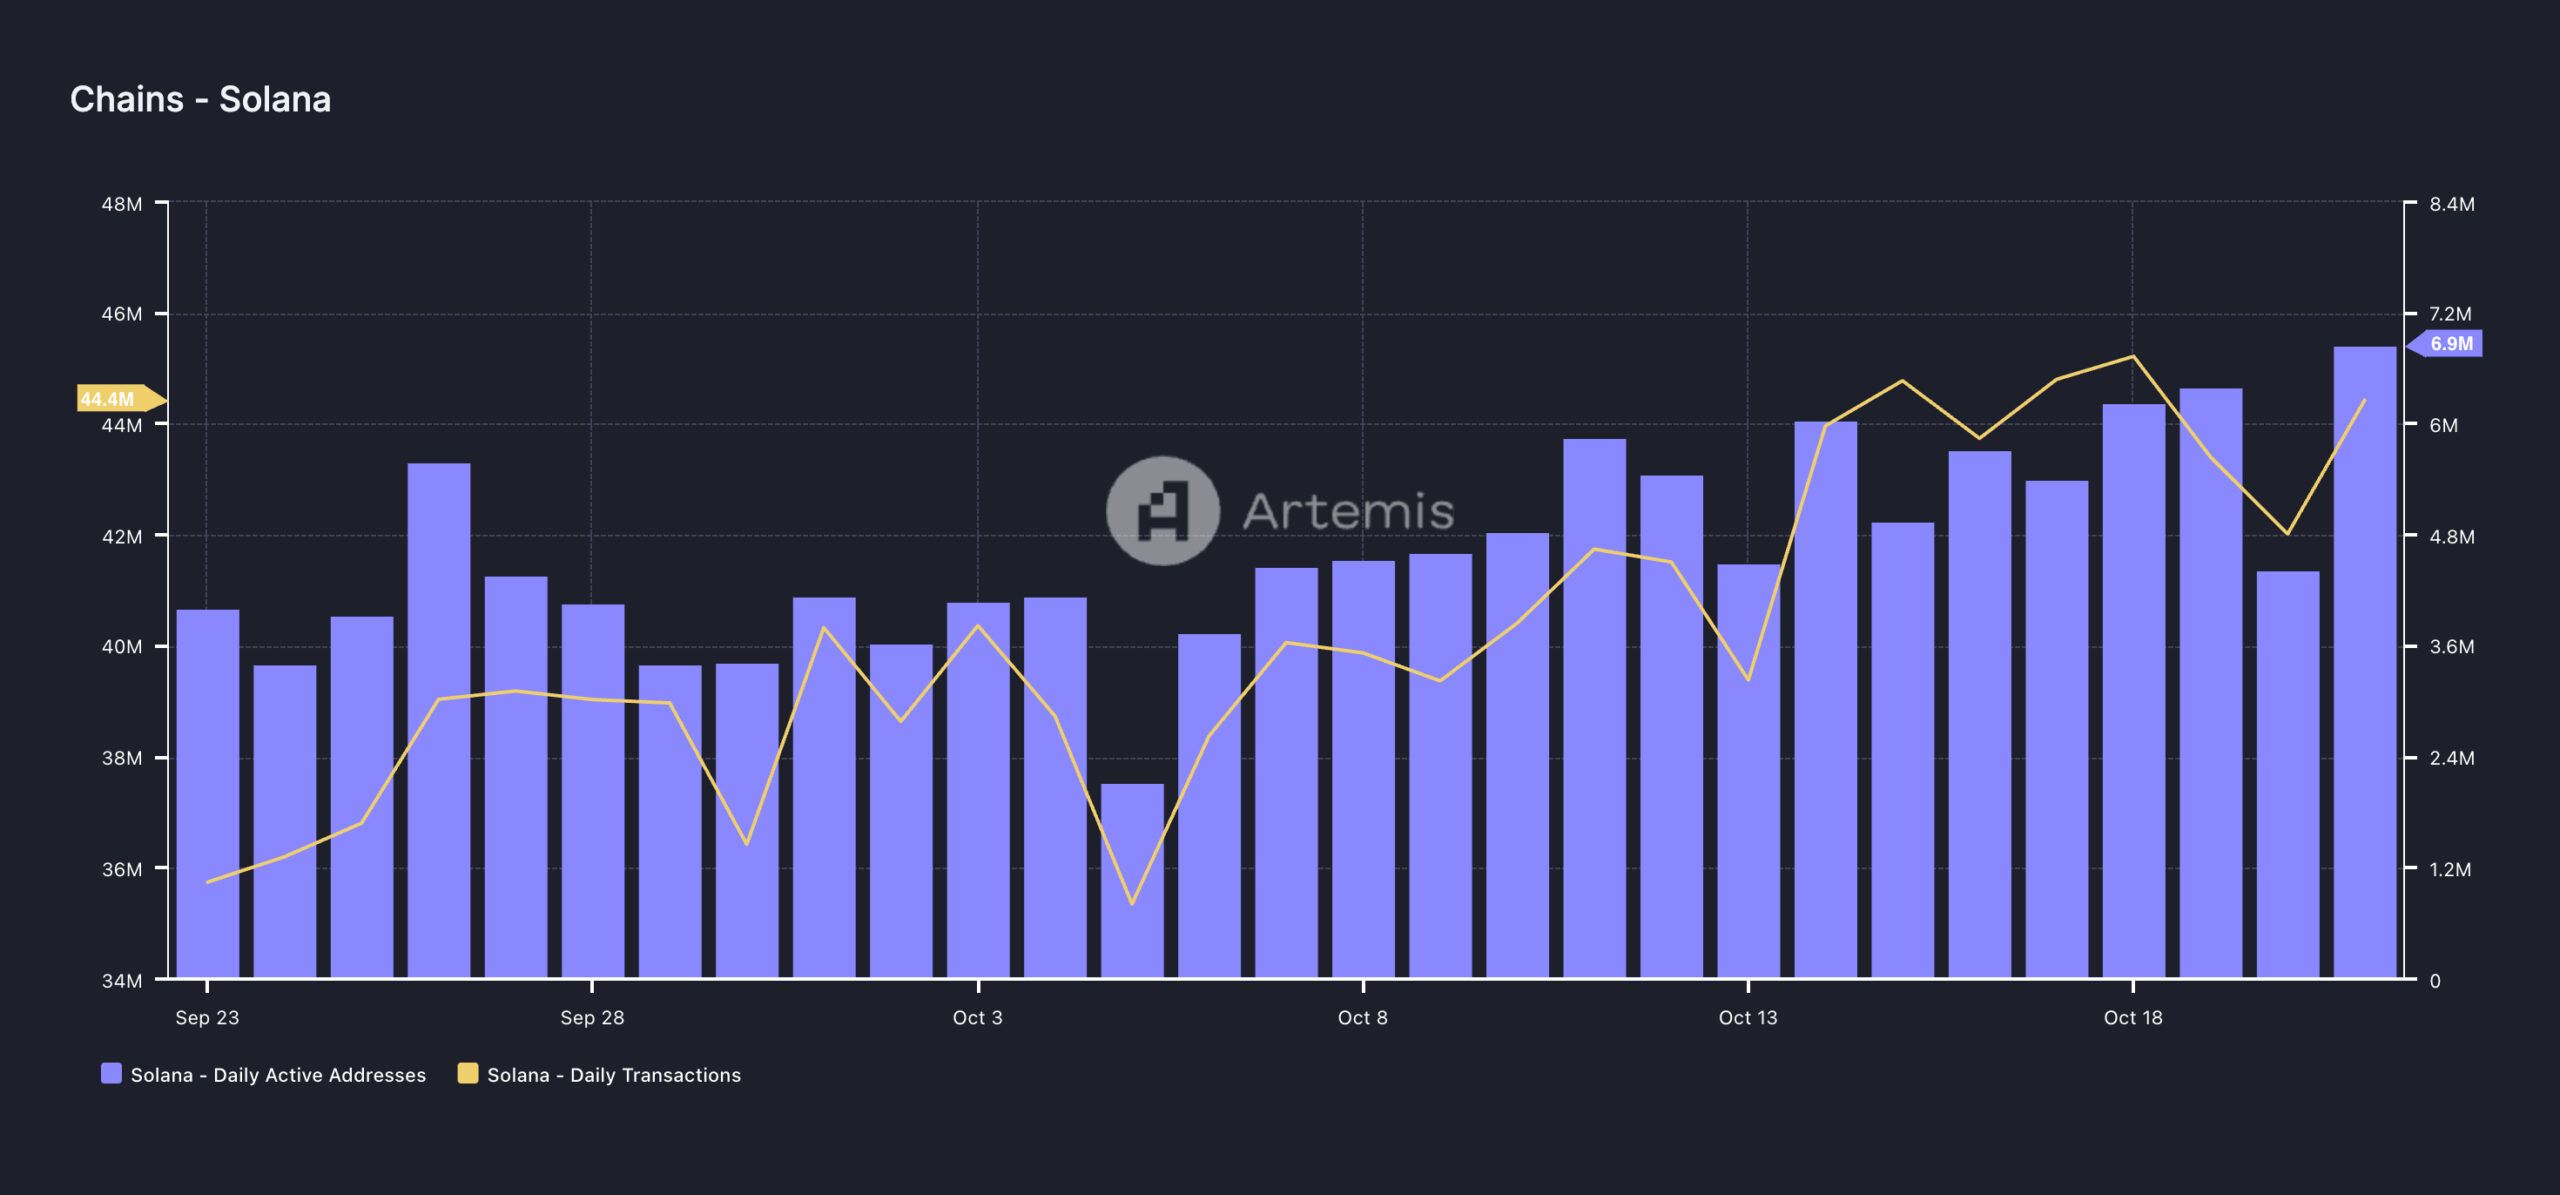
Over the past 30 days, demand for the Solana network has surged, as evidenced by an increase in daily active addresses. According to data from Artemis, 7 million unique addresses have completed at least one transaction on Solana during this period, marking a remarkable 70% increase.
This rise in active addresses has naturally led to a corresponding uptick in daily transaction volume on the network. Over the same 30-day period, Solana has processed 44 million transactions, representing a 24% increase in daily transaction count on the L1.
Read more: 13 Best Solana (SOL) Wallets To Consider in October 2024
Notably, the influx of users to Solana has helped its decentralized finance (DeFi) grow. Solana has outpaced Ethereum and other major networks like Base, Arbitrum, and Polygon in daily decentralized exchange (DEX) volume in the past week. During this period, Solana’s DEX volume exceeded $13 billion, significantly surpassing Ethereum’s $8 billion.
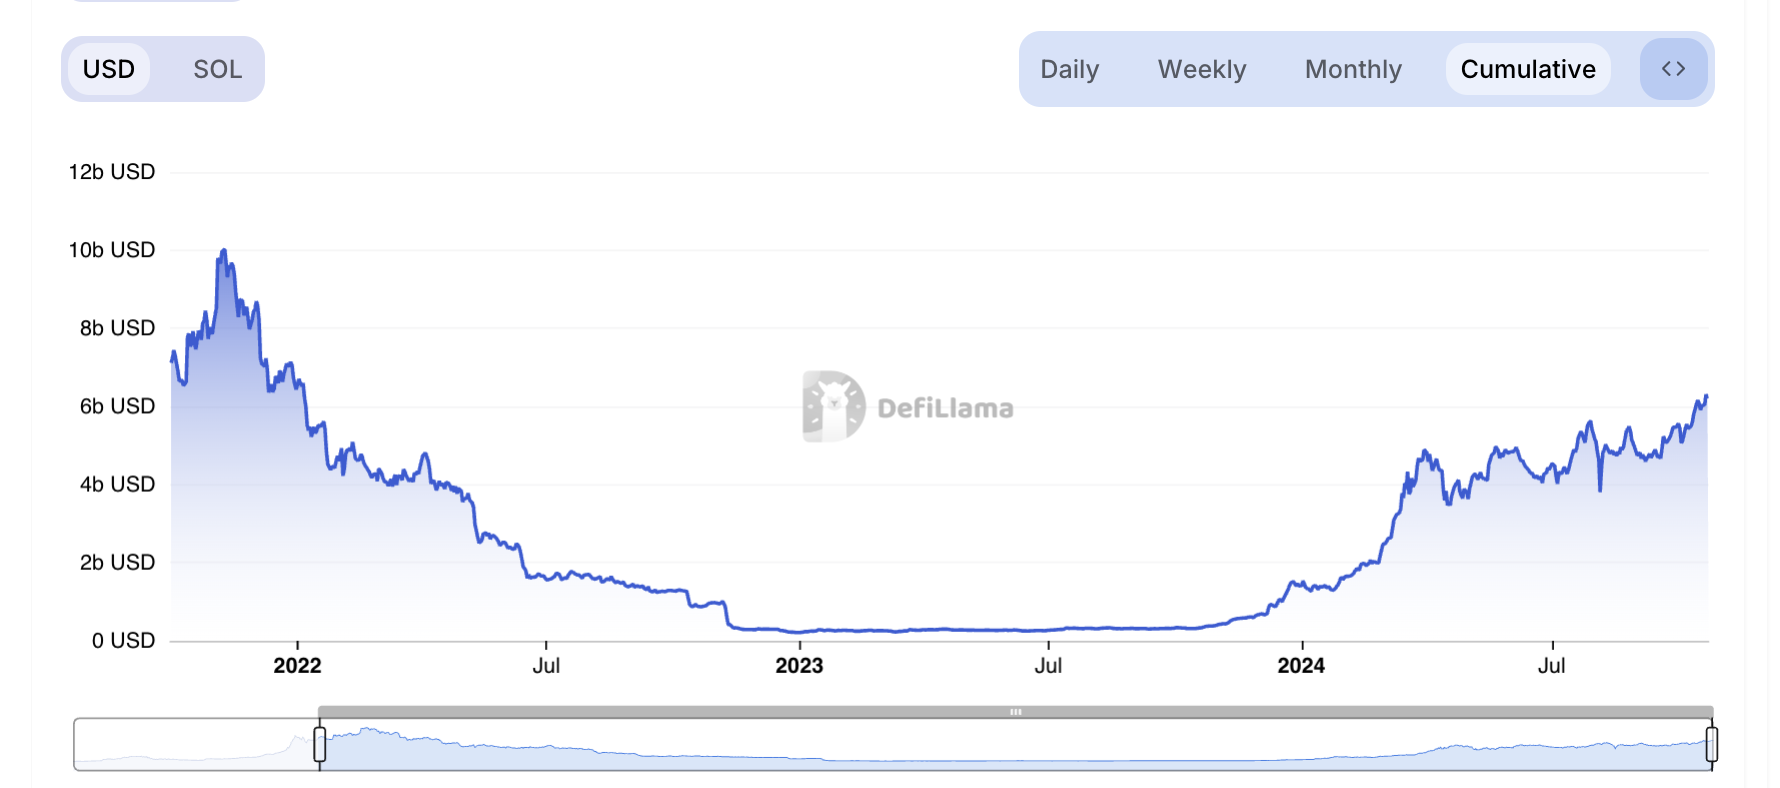
Additionally, Solana’s total value locked (TVL) is currently at $6.22 billion, the highest it has been since January 2022.
SOL Price Prediction: High Network Usage is the Key
As more users engage with a blockchain network, the utility of its native asset (SOL in this case) increases. High usage indicates that more transactions are occurring, often requiring more of the network’s token to pay transaction fees. This boosts demand for the asset, driving up its price.
If Solana continues to experience increased network activity, driving demand for SOL, its price—currently at $166.15—could break past the resistance level of $172.53.
A successful breach of this resistance would set the altcoin on course to reach $194.12. Should buying momentum continue to increase, Solana’s price could reclaim $210.18, a level it last touched in March.
Read more: How to Buy Solana (SOL) and Everything You Need To Know
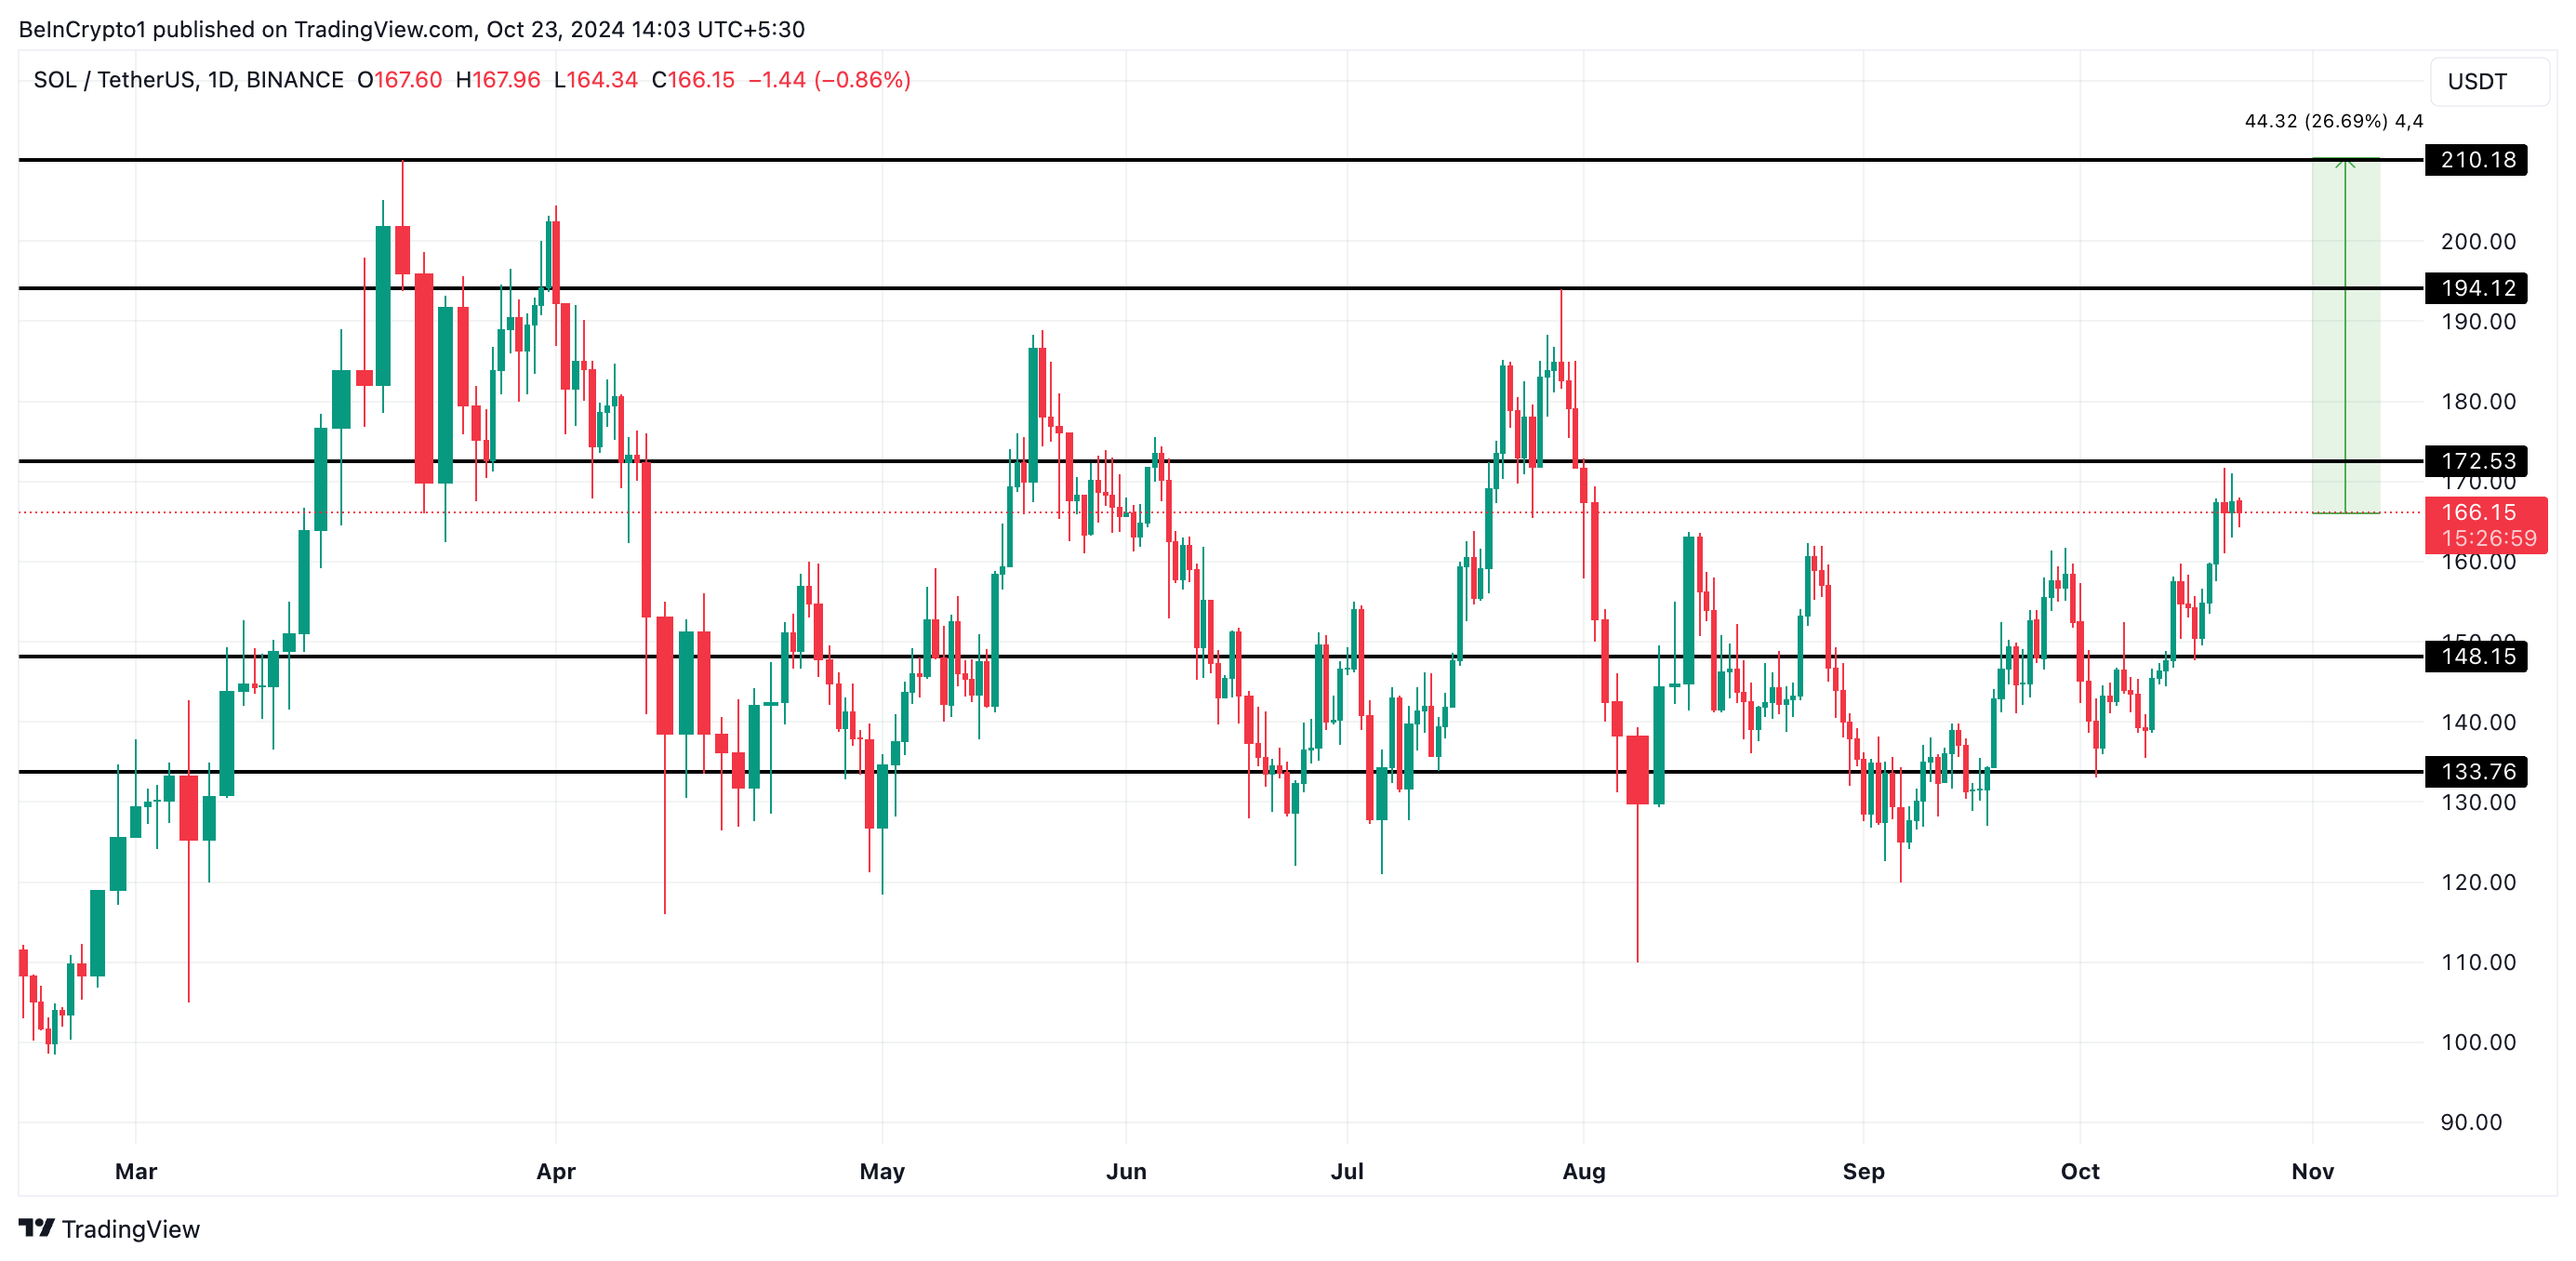
However, if user activity on Solana declines and demand for SOL weakens, the price may test support at $148.15. Failure to hold this level could push the coin down further to $133.76, invalidating the bullish outlook.
Disclaimer
In line with the Trust Project guidelines, this price analysis article is for informational purposes only and should not be considered financial or investment advice. BeInCrypto is committed to accurate, unbiased reporting, but market conditions are subject to change without notice. Always conduct your own research and consult with a professional before making any financial decisions. Please note that our Terms and Conditions, Privacy Policy, and Disclaimers have been updated.


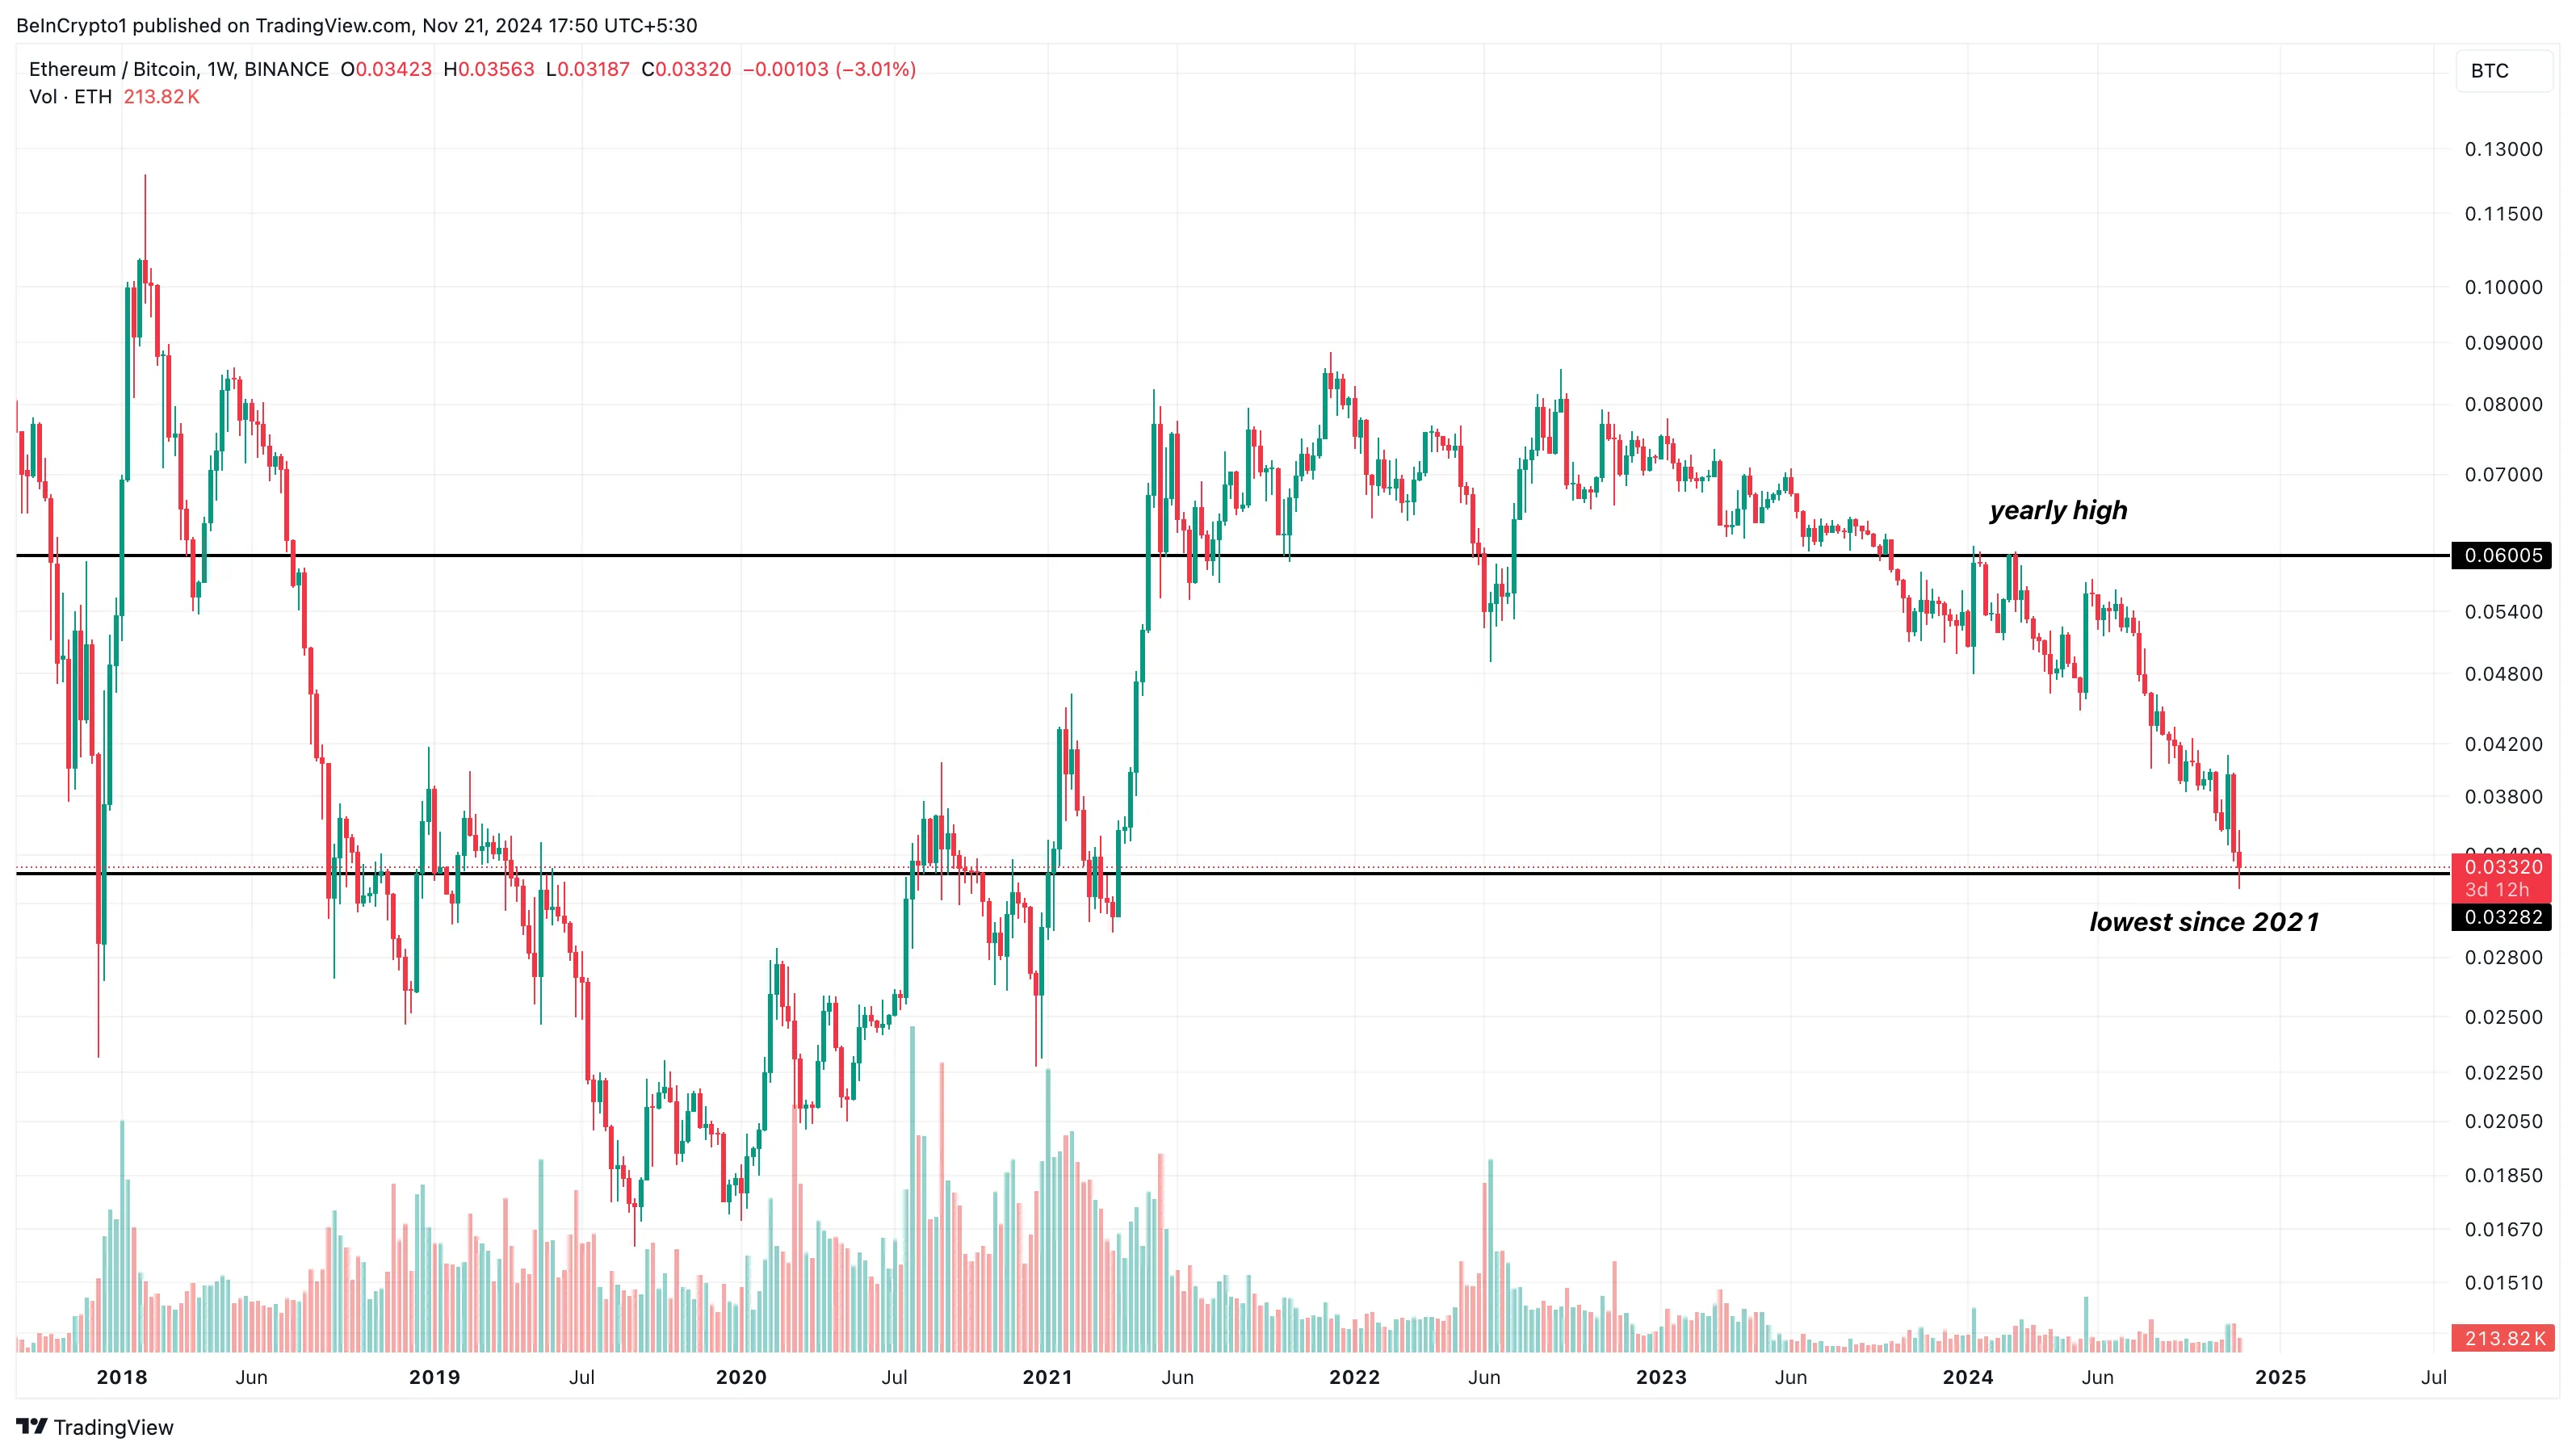
The ETH/BTC ratio, a metric measuring Ethereum’s price performance compared to Bitcoin, has reached its lowest point since March 2021. This development comes amid BTC’s brief rise to $98,000.
While the flagship cryptocurrency has increased by 7.45% in the last seven days, ETH has hovered around the same region, with investors raising concerns about the altcoin’s future.
Ethereum Continues to Lag Behind Bitcoin
In February, the ETH/BTC ratio climbed to a yearly high of 0.060. During that time, speculation spread that Ethereum’s price would begin to outperform Bitcoin and validate the altcoin season. However, that has not happened, as Bitcoin’s price has continued to make new highs
Ethereum, on the other hand, is yet to retest to reclaim its all-time high despite reaching $4,000 earlier in the year. This disparity in performance could be linked to several factors. For instance, both cryptocurrencies saw approval for exchange-traded funds (ETFs) this year.
However, while Bitcoin has seen billions of dollars in inflows, ETH has been inconsistent in attracting capital. Hence, the institutional inflow has driven BTC toward $100,000, ensuring that the ETH/BTC ratio drops to $0.033 — the lowest level in 42 months.
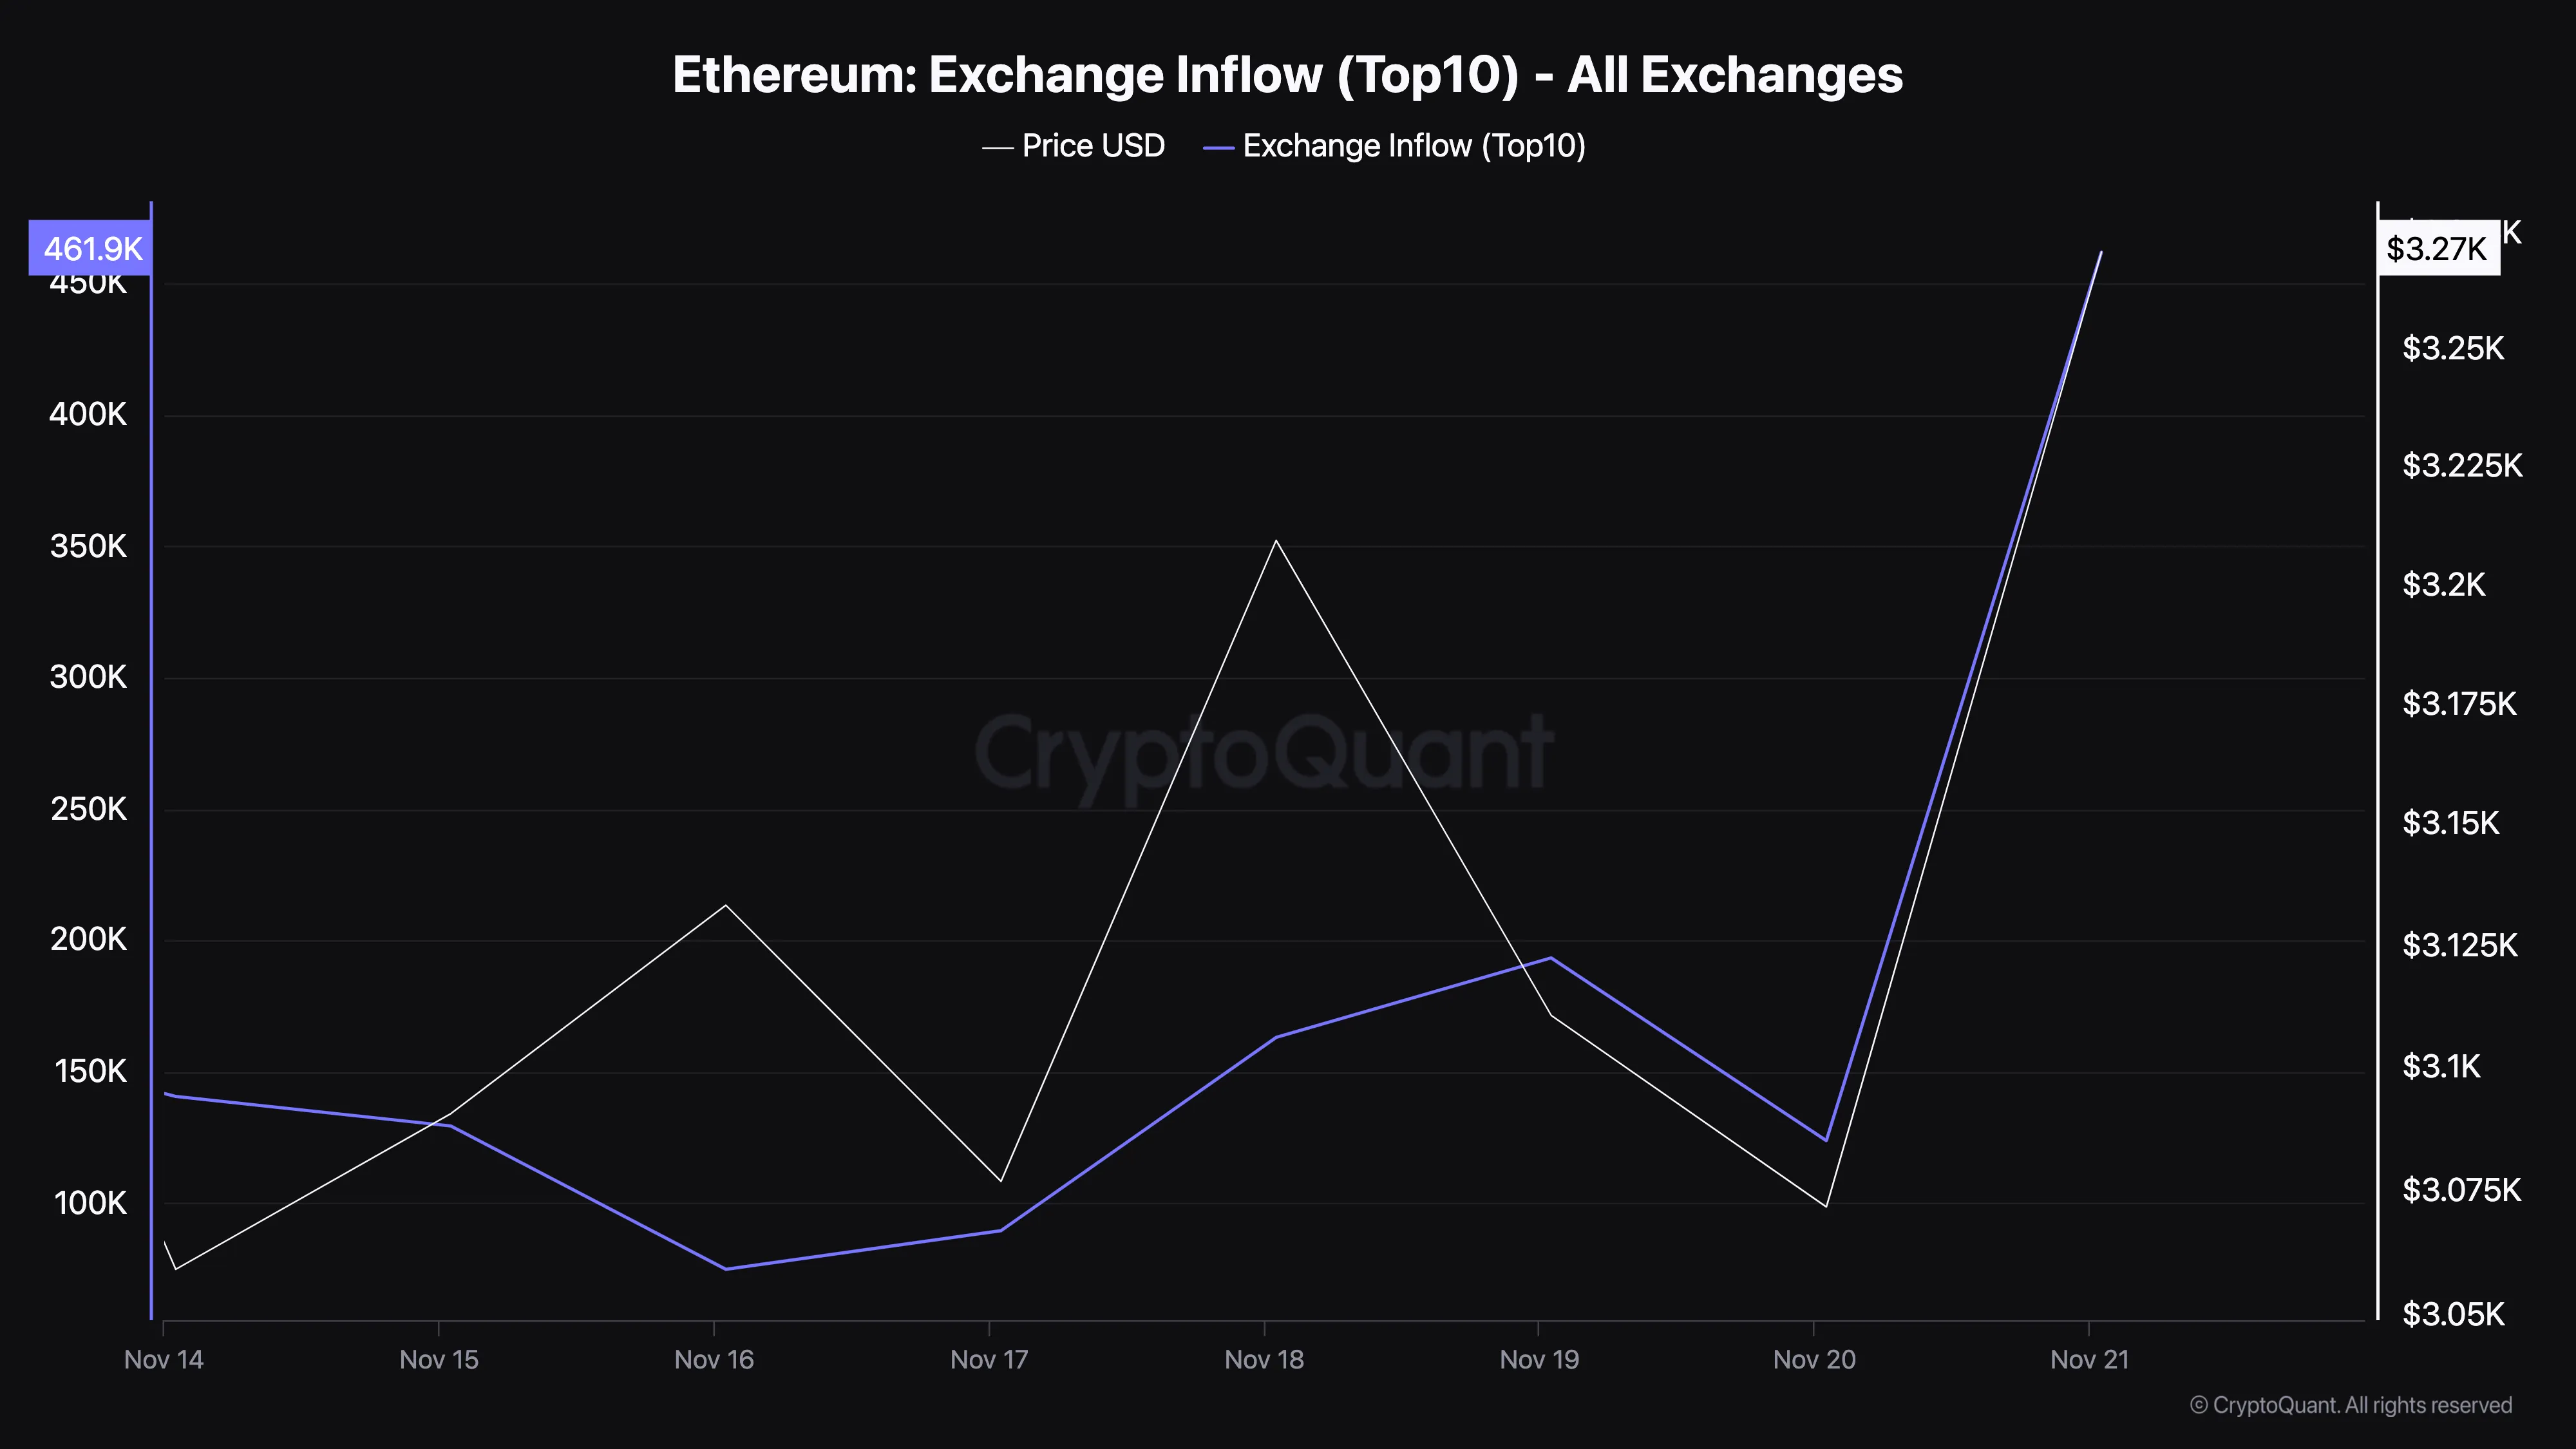
Further, the disparity in Ethereum’s performance can largely be attributed to sustained selling pressure. For instance, CryptoQuant data reveals that exchange inflows into the top 10 exchanges have climbed to 461,901 ETH, valued at approximately $1.50 billion as of this writing.
This surge in exchange inflow reflects large deposits by investors, indicating a heightened willingness to sell. Such movements typically increase the supply of ETH on exchanges, raising the likelihood of a price drop.
In contrast, a low exchange inflow generally indicates that investors are holding onto their assets, which is not the current scenario for ETH.
ETH Price Prediction: Crypto Could Retrace
As of this writing, ETH trades at $3,317, which is a higher close than yesterday’s. Despite that, the altcoin is still below the Parabolic Stop And Reverse (SAR) indicator. The Parabolic SAR generates a series of dots that track the price movement, positioning above the price during a downtrend and below the price during an uptrend.
A “flip” in the dots — shifting from one side to the other — often signals a potential trend reversal. As seen below, the indicator is above ETH’s price, suggesting that the cryptocurrency could reverse its recent gains.
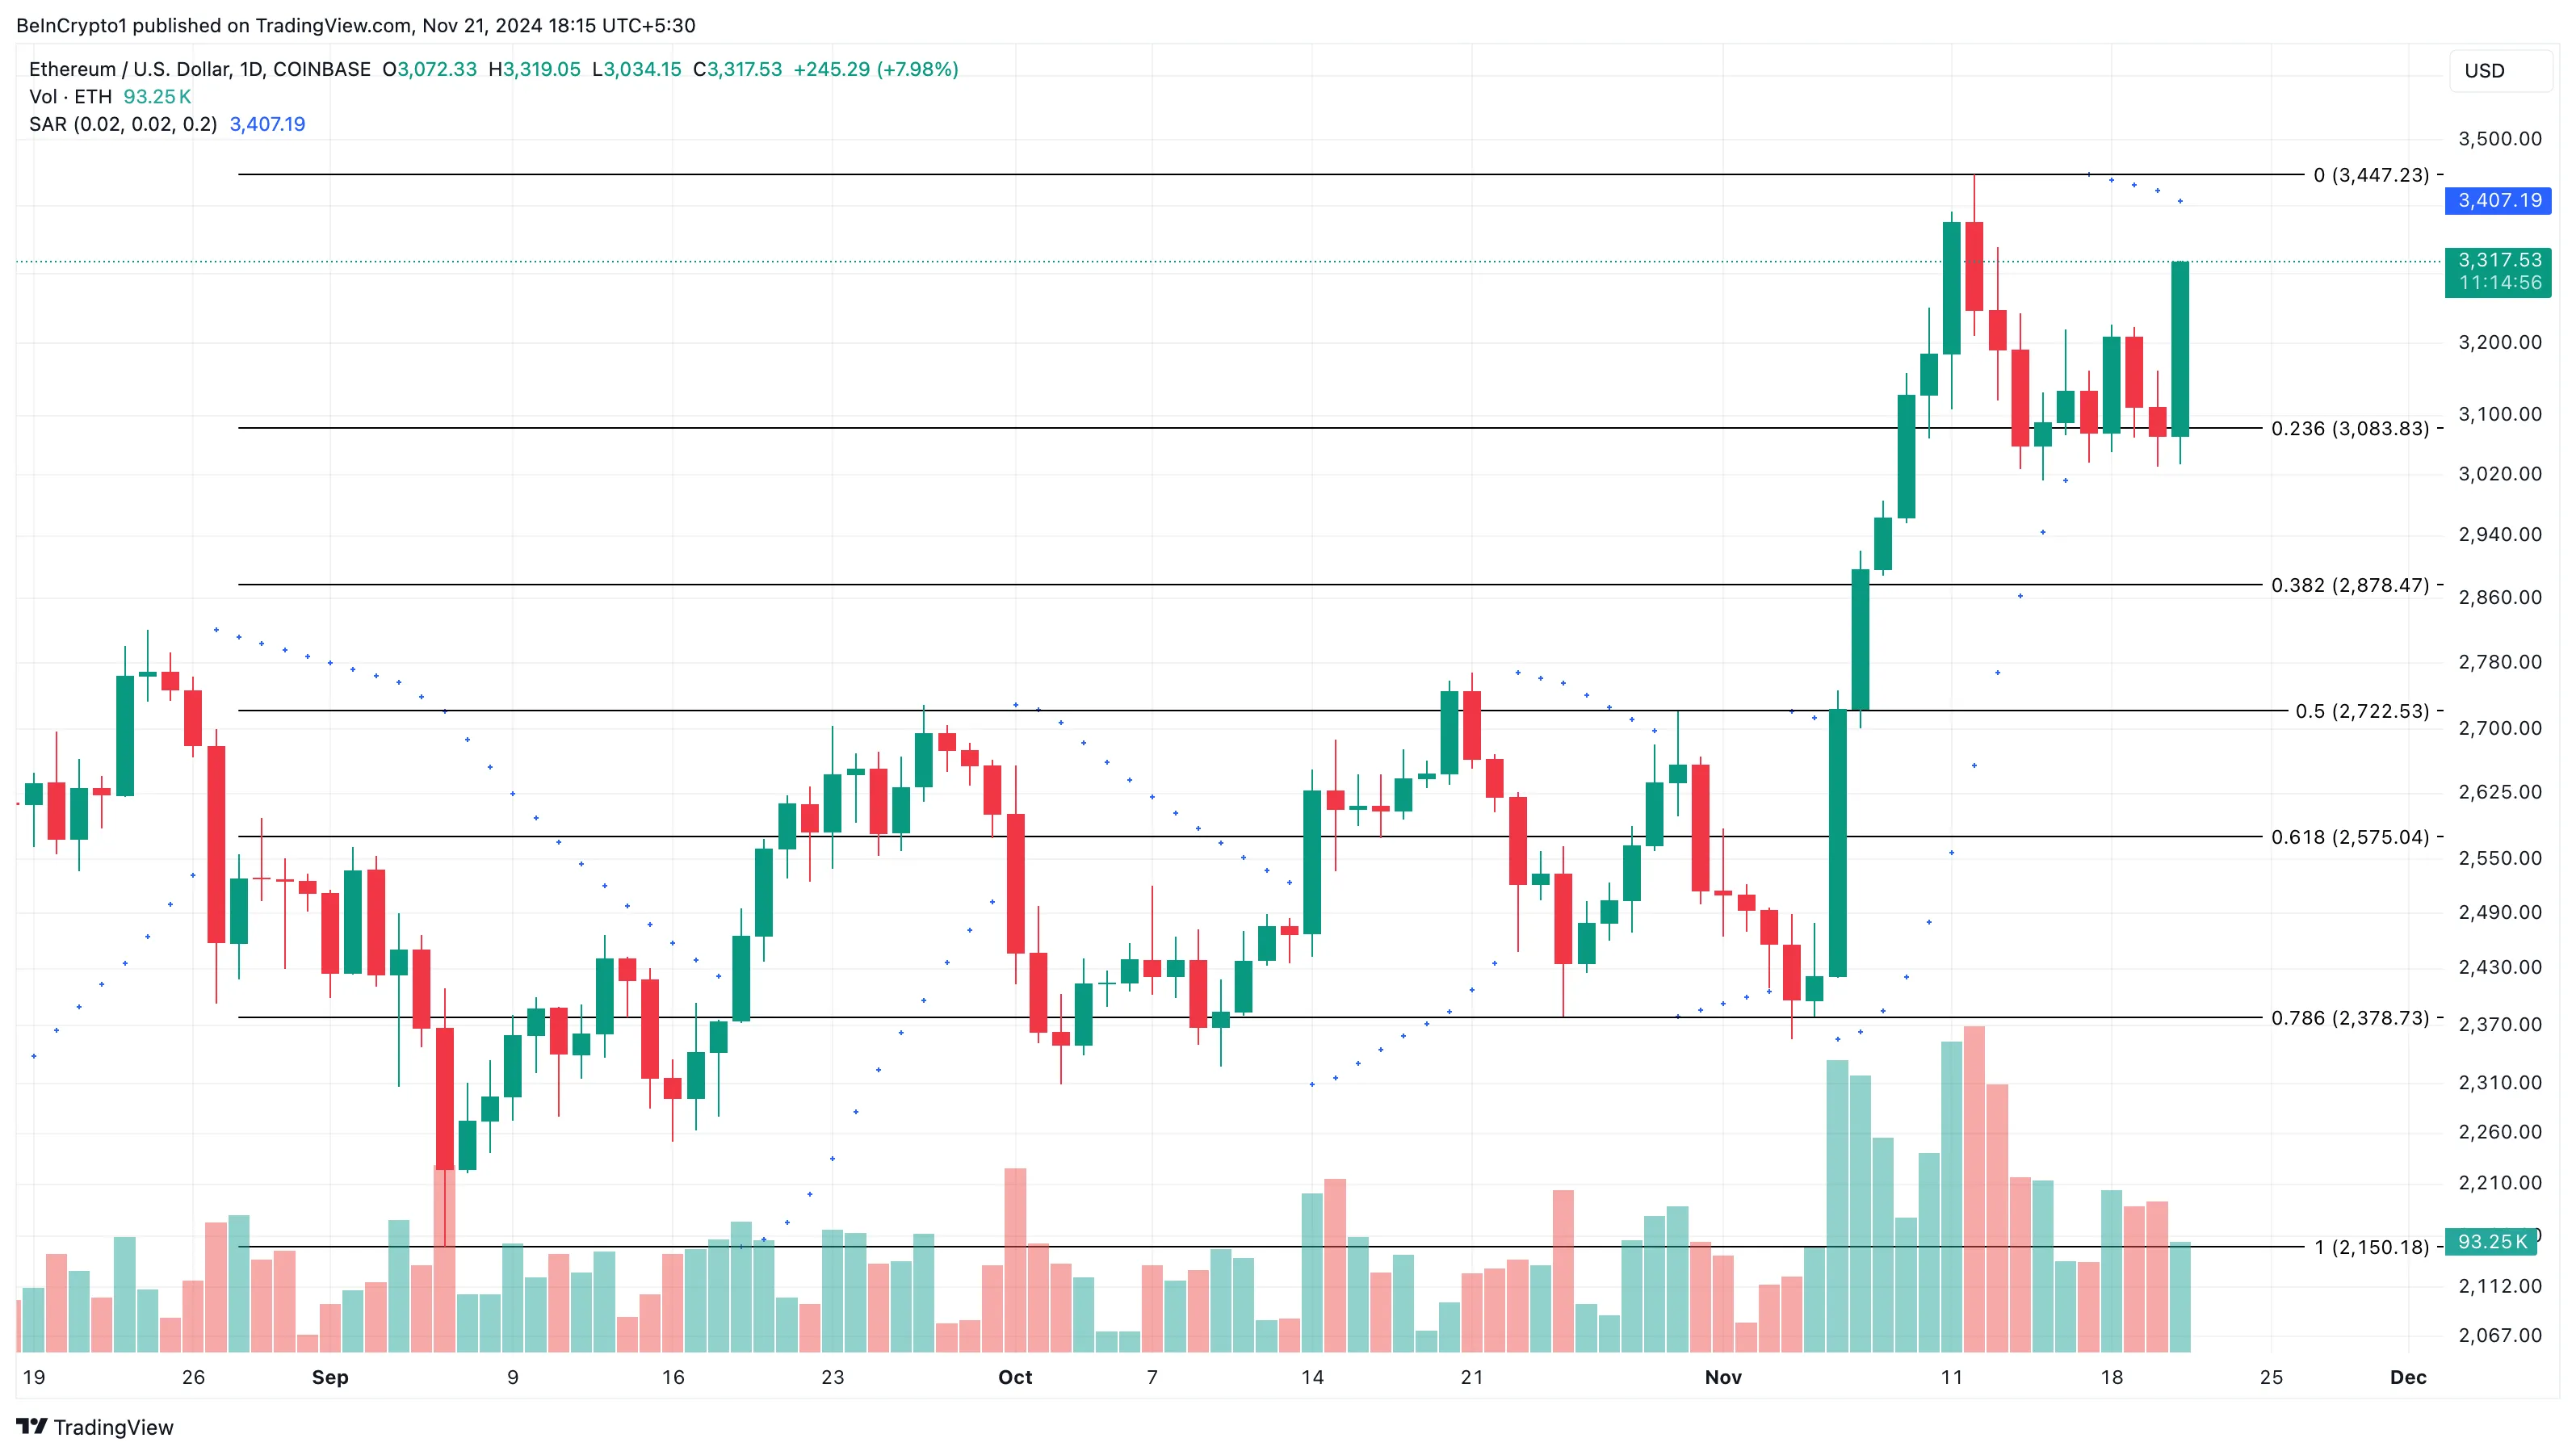
If this is the case and the ETH/BTC ratio declines, Ethereum’s price could decline to $3,083. However, if buying pressure increases, that might not happen. Instead, the value could surge above $3,500 and toward 4,000.
Disclaimer
In line with the Trust Project guidelines, this price analysis article is for informational purposes only and should not be considered financial or investment advice. BeInCrypto is committed to accurate, unbiased reporting, but market conditions are subject to change without notice. Always conduct your own research and consult with a professional before making any financial decisions. Please note that our Terms and Conditions, Privacy Policy, and Disclaimers have been updated.
Bitcoin Cash (BCH) price has risen more than 10% in the last 24 hours, surpassing the $10 billion market cap and signaling renewed bullish momentum. The recent surge has brought BCH closer to key resistance levels, indicating the potential for further gains if the uptrend strengthens.
However, indicators like the RSI and ADX show that while the trend is improving, it is not yet fully strong. Whether BCH can sustain its upward momentum or face a pullback will depend on how it navigates critical resistance and support levels in the coming days.
BCH Current Uptrend Is Getting Stronger
BCH currently has an ADX of 19.31, up from 12 just a day ago. This increase indicates that the strength of the trend is gradually gaining momentum after being weak.
However, since the ADX is still below 25, it suggests that the uptrend has not yet reached a strong or sustained level of trend strength.
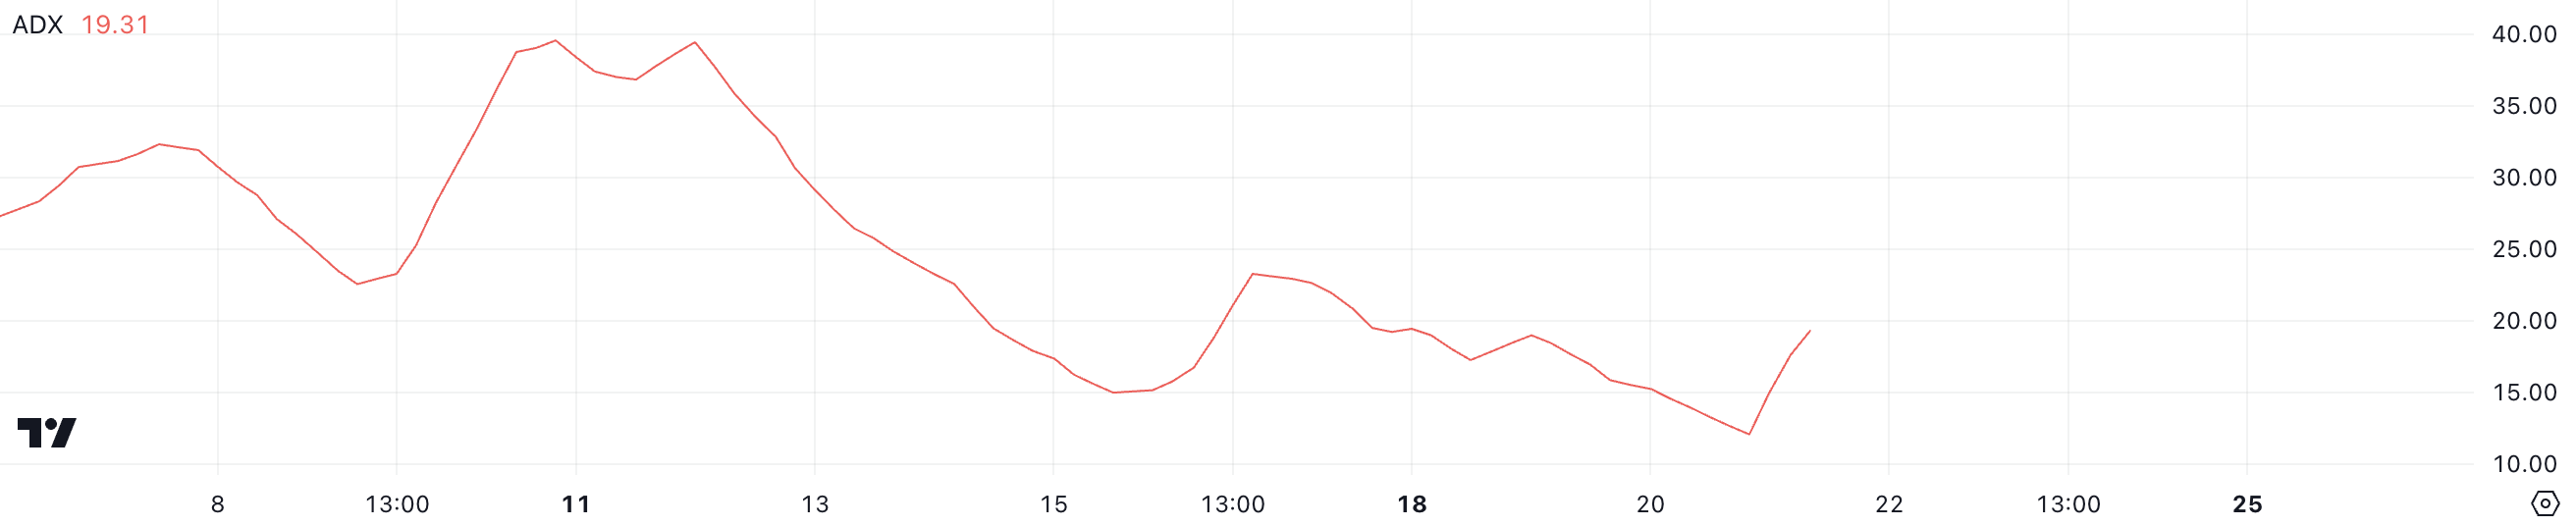
The ADX measures the strength of a trend, with values above 25 indicating a strong trend and below 20 indicating a weak or uncertain trend. While Bitcoin Cash is currently in an uptrend, the ADX at 19.31 suggests that the trend is still in its early stages of strengthening.
If the ADX continues to rise above 25, it could confirm a stronger uptrend, but for now, Bitcoin Cash price movement remains cautious, with room for further development.
Bitcoin Cash Is Not In The Overbought Zone Anymore
Bitcoin Cash has an RSI of 64.5, down from over 70 just a day ago. This decline suggests that while the asset is still experiencing bullish momentum, the intensity of buying pressure has started to decrease.
The drop below 70 takes BCH out of the overbought zone, indicating a more balanced market sentiment.
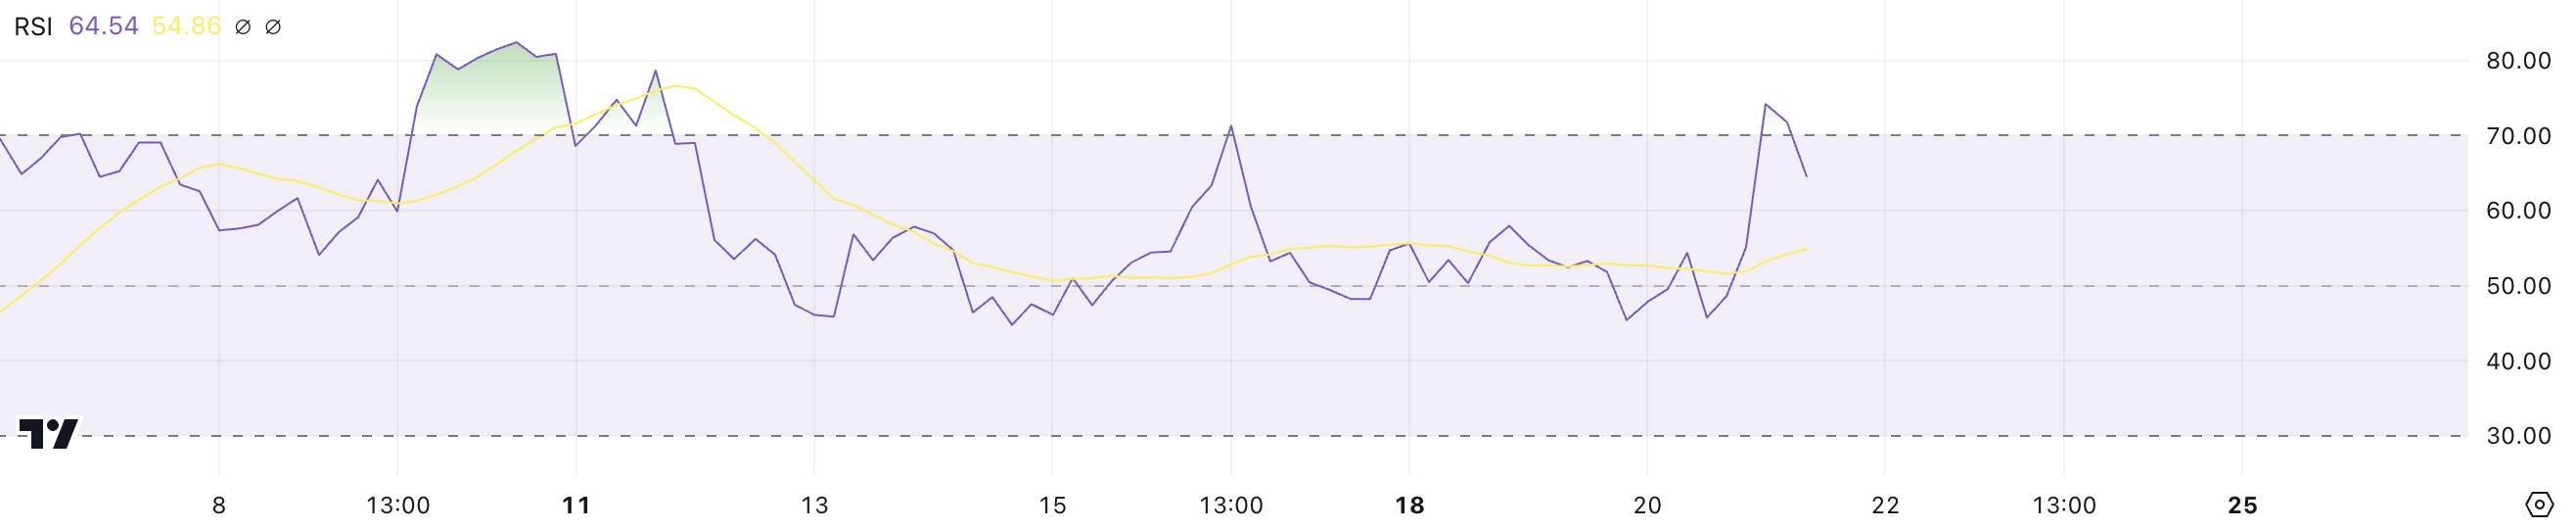
The RSI measures the speed and magnitude of price changes, with values above 70 indicating overbought conditions and below 30 signaling oversold levels. At 64.5, BCH remains in bullish territory, which supports the ongoing uptrend.
However, the slight decline in RSI could mean the pace of gains is moderating, potentially leading to BCH price consolidation before any further upward movement.
BCH Price Prediction: Will a New Surge Occur Soon?
If BCH maintains its current uptrend and gains additional momentum, it could continue its rise after climbing more than 10% in the last 24 hours.
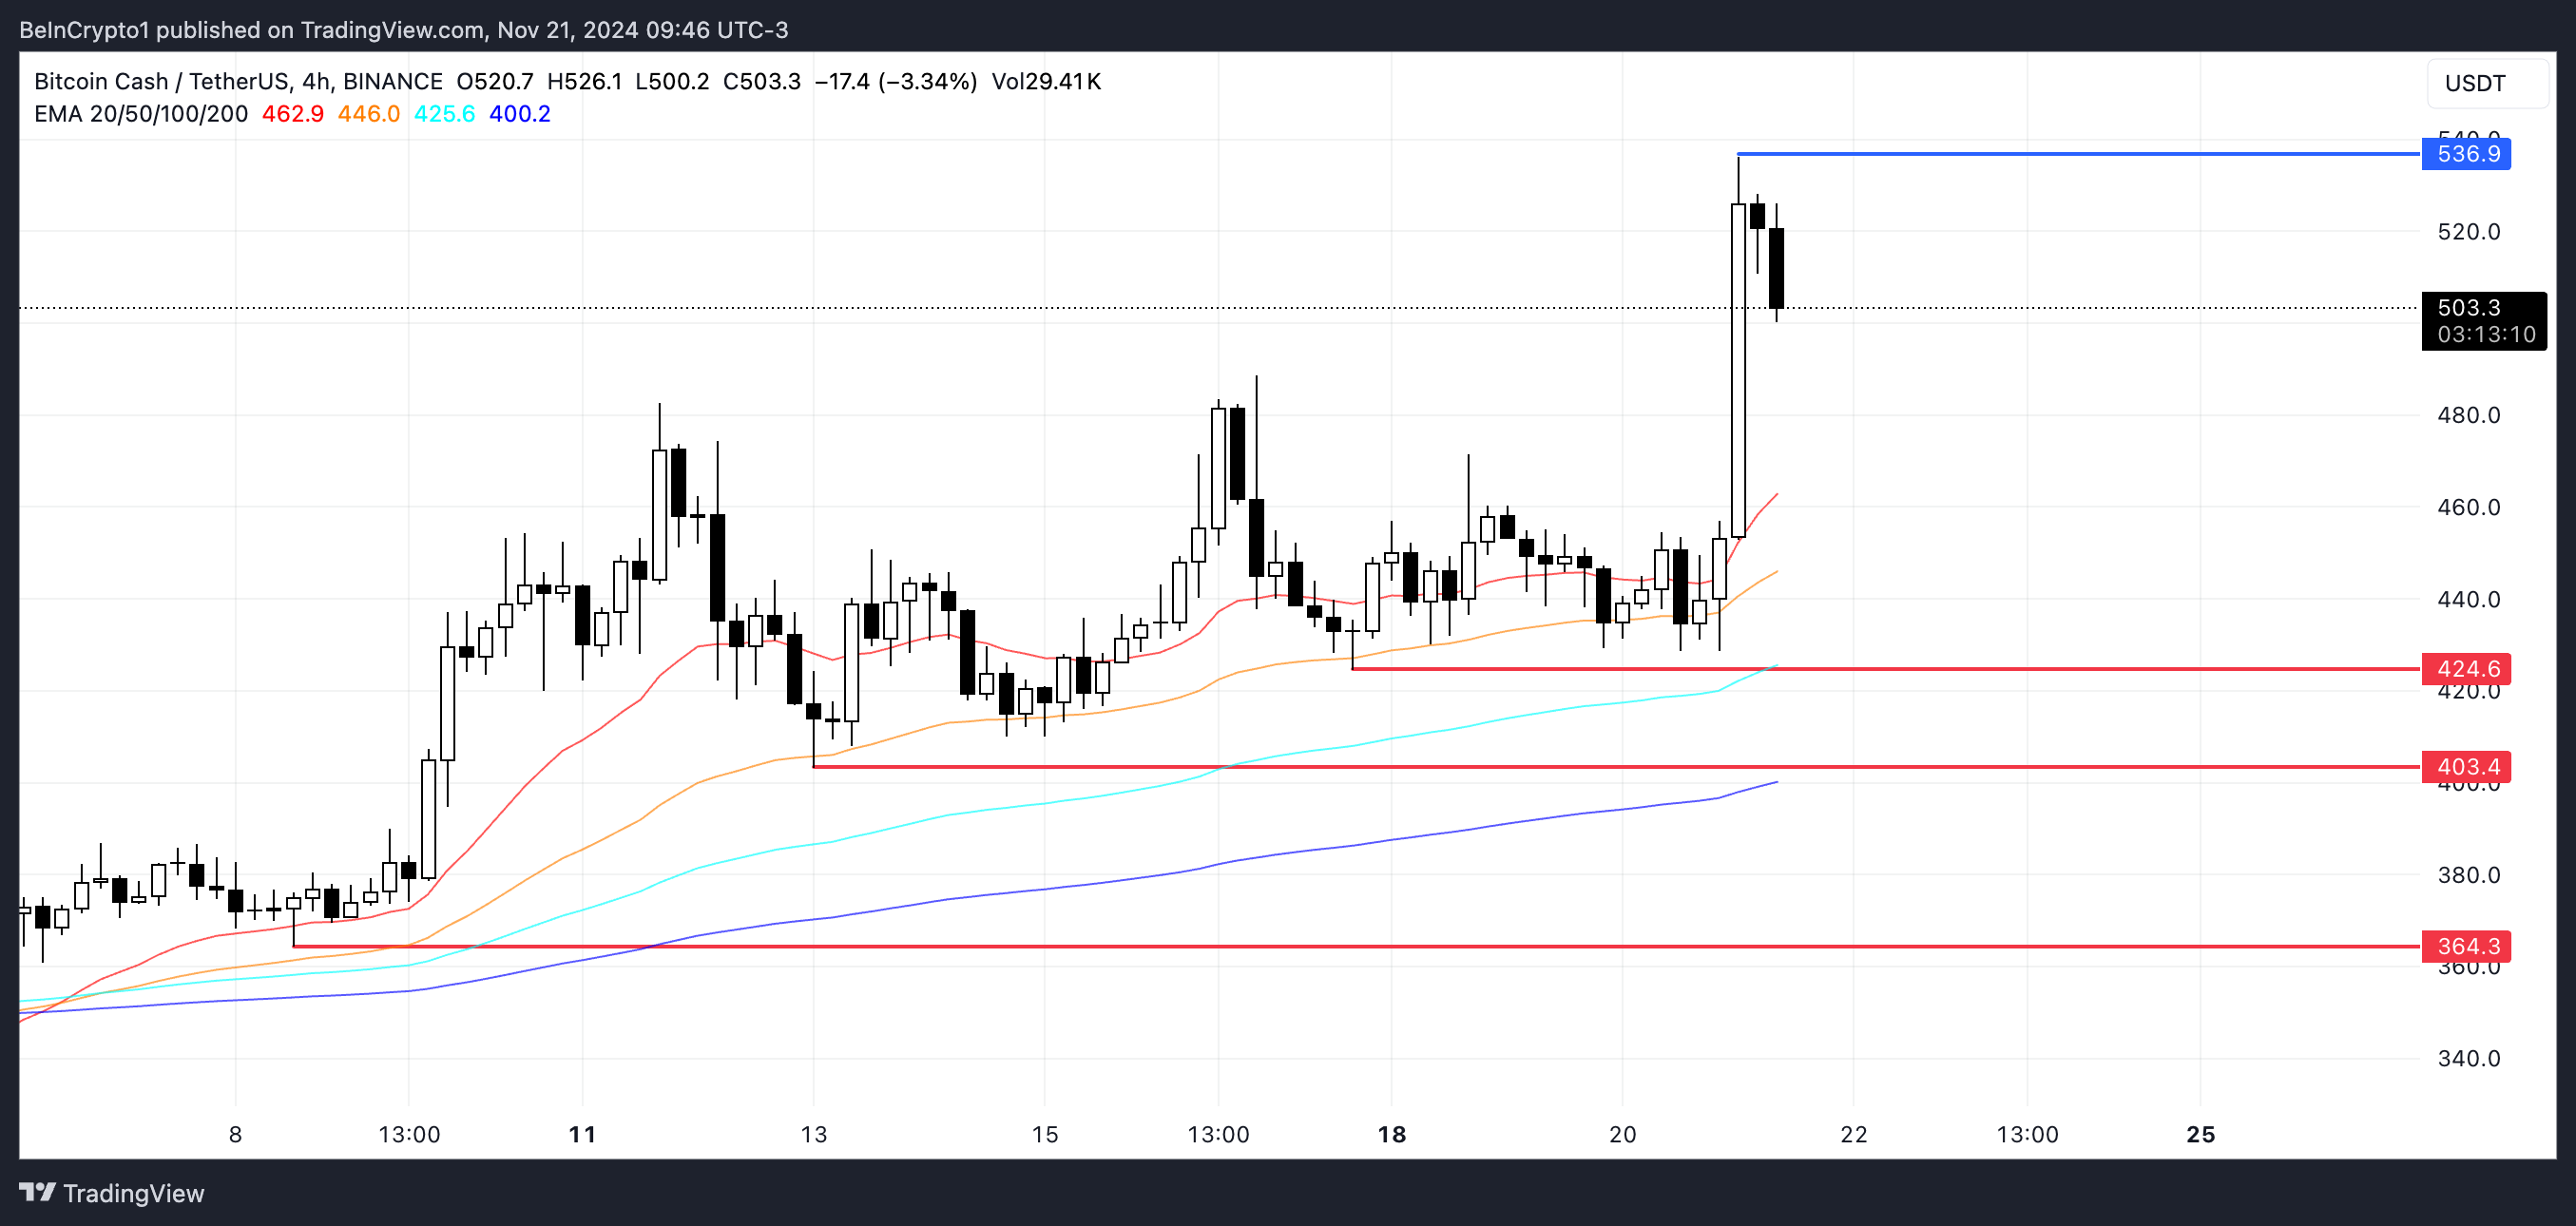
This strength could push BCH price to test the resistance at $536.9. Breaking this level would signal a continuation of bullish momentum and could attract further buying interest.
On the other hand, if the uptrend fades away and reverses, BCH price could retrace to test the nearest support levels at $424 and $403. If these supports fail to hold, the price could fall further to $364, representing a potential 27% correction.
Disclaimer
In line with the Trust Project guidelines, this price analysis article is for informational purposes only and should not be considered financial or investment advice. BeInCrypto is committed to accurate, unbiased reporting, but market conditions are subject to change without notice. Always conduct your own research and consult with a professional before making any financial decisions. Please note that our Terms and Conditions, Privacy Policy, and Disclaimers have been updated.
Wyoming-based crypto bank Custodia is reportedly deliberating more layoffs as it braces for ongoing regulatory scrutiny under the Biden administration. The decision comes as the crypto sector faces unprecedented challenges, including de-bankings and increasing pressure from US regulatory agencies.
Meanwhile, cryptocurrency market participants remain hopeful of a better regulatory environment amid expectations of policy shifts with the incoming Donald Trump administration.
Custodia Banks Plans More Layoffs Amid Regulatory Pressure
Custodia Bank might enact more layoffs after retrenching 25% of its staff in August. This comes as the digital asset-focused bank continues to devote resources to its ongoing lawsuit with the Federal Reserve (Fed), which denied the lender a master account last year.
“Fox Business has learned that Wyoming-based crypto bank Custodia Bank will implement further layoffs in order to preserve capital,” Fox Business correspondent Eleanor Terrett reported.
The bank did not immediately respond to BeInCrypto’s request for comment on the supposed layoffs. Early in 2023, Custodia Bank was denied a master account, which would give it access to the Fed’s liquidity facilities. The lawsuit challenges this denial.
Custodia Bank has been trying to conserve capital as it continues its legal battle against the Fed. During its last layoffs three months ago, the company’s founder and CEO Caitlin Long attributed the retrenchments to “right-sizing.” She said it was necessary to maintain operations while preserving capital during the lawsuit against the Fed.
Long also indicated that the efforts could continue “until after Operation Choke Point 2.0 ends,” referring to the alleged ongoing crackdown on digital assets under the Biden administration. Operation Choke Point was the name of an Obama-era effort that “choked off” high-risk industries such as payday lending, gambling, and firearms from banking access.
“I’m incredibly proud of the Custodia team, the services we’re building for our customers and our resilience in the face of repeated de-bankings due to no fault of our own. I especially thank Custodia’s customers and shareholders who have helped us continue the fight for the durability of banking access for the law-abiding US crypto industry,” Terrett added, citing Long.
Noteworthy, oral arguments in the lawsuit will take place on January 21. This will be the day after Donald Trump’s inauguration, following his recent win.
Regulatory Pressures Intensify But There’s Hope for Change Under Trump
Custodia is not alone in struggling against regulatory pressure. The crypto industry at large has recently faced mounting regulatory challenges. High-profile companies like Consensys have also recently announced significant layoffs.
As BeInCrypto reported in late October, the blockchain software firm behind Ethereum infrastructure tools like MetaMask revealed it was cutting 20% of its workforce. Its CEO, Joe Lubin, cited mounting pressure from the US SEC (Securities and Exchange Commission), among other uncertainties in the regulatory space.
“The broader macroeconomic conditions over the past year and ongoing regulatory uncertainty have created broad challenges for our industry, especially for US-based companies,” Lubin shared.
Meanwhile, the Biden administration has been accused of taking an increasingly aggressive stance toward the crypto industry. Among the accusations include enforcing stringent banking restrictions and debankings. Nevertheless, Trump’s recent win and upcoming inauguration reignited hope within the crypto sector for a more supportive regulatory environment.
The hope hinges on the delivery of Trump’s crypto blueprint. Experts believe Trump’s pro-business stance could revive the industry by easing regulatory pressures on crypto.
Brian Armstrong, CEO of Coinbase, has also expressed optimism about a potential shift in regulatory attitudes. Armstrong recently urged the next SEC chair to drop “frivolous cases” against crypto firms and issue a public apology. He slammed the current SEC composition for what he views as overly aggressive enforcement, calling out Gary Gensler.
“The next SEC chair should withdraw all frivolous cases and issue an apology to the American people. It would not undo the damage done to the country, but it would start the process of restoring trust in the SEC as an institution,” Armstrong posted.
Still, Custodia’s ongoing lawsuit is a symbol of the crypto industry’s fight for legitimacy and fair treatment within the financial sector. While the industry’s outlook remains uncertain in the short term, there is cautious optimism that the incoming Trump administration could bring relief to embattled crypto firms.
Disclaimer
In adherence to the Trust Project guidelines, BeInCrypto is committed to unbiased, transparent reporting. This news article aims to provide accurate, timely information. However, readers are advised to verify facts independently and consult with a professional before making any decisions based on this content. Please note that our Terms and Conditions, Privacy Policy, and Disclaimers have been updated.
5 Key Indicators To Watch For Ethereum Price Rally To $10K
ETH/BTC Ratio Plummets to 42-Month Low Amid Bitcoin Surge

Marathon Digital Raises $1B to Expand Bitcoin Holdings
Agency Reiterates “Digital Assets Securities” As XRP Eyes $2

Bitcoin Cash (BCH) Price Up, Leads Daily Gains

Dogecoin Whale Accumulation Sparks Optimism, DOGE To Rally 9000% Ahead?

2.52 Million Altcoins Are Ruining Crypto’s Future

Animoca Brands Valuation Tanks 75% In Two Years, Here’s Why

Crypto exchange BingX hacked for $43 million

Are The Big Players Losing Interest?

Hong Kong’s Securities Association Tips Authorities On Crypto Self-Regulation

Coinbase cbBTC Set to go Live on Solana
2.52 Million Altcoins Are Ruining Crypto’s Future
Animoca Brands Valuation Tanks 75% In Two Years, Here’s Why
Crypto exchange BingX hacked for $43 million
Are The Big Players Losing Interest?
Hong Kong’s Securities Association Tips Authorities On Crypto Self-Regulation
Coinbase cbBTC Set to go Live on Solana
-

 Market12 hours ago
This is Why MoonPay Shattered Solana Transaction Records
-

 Ethereum9 hours ago
Fundraising platform JustGiving accepts over 60 cryptocurrencies including Bitcoin, Ethereum
-
 Regulation17 hours ago
US SEC Pushes Timeline For Franklin Templeton Crypto Index ETF
-

 Market17 hours ago
RENDER Price Soars 48%, But Whale Activity Declines
-

 Market21 hours ago
Arkham Spot Trading Platform Set to Launch in the US Market
-
 Regulation16 hours ago
BitClave Investors Get $4.6M Back In US SEC Settlement Distribution
-

 Regulation20 hours ago
Donald Trump’s transition team considering first-ever White House crypto office
-

 Market15 hours ago
Nvidia Q3 Revenue Soars 95% to $35.1B, Beats Estimates