
Market
What’s Next for the Trending Altcoins Today? Find Out

Today’s trending altcoins feature two meme coins connected to Artificial Intelligence (AI) and a recently launched cryptocurrency that’s gaining significant market attention.
However, only one of these three has experienced a notable price increase, while the others have seen their values decline in the last 24 hours. Based on CoinGecko data, the top three trending altcoins are Goatseus Maximus (GOAT), Scroll (SCR), and KOALA AI (KOKO).
Goatseus Maximus (GOAT)
GOAT leads today’s trending altcoins thanks to a significant price surge. In the past 24 hours, GOAT’s price has soared by 55%, recovering losses incurred just days ago. This surge has propelled the cryptocurrency, which benefits from the popular AI and meme coin narrative to a new all-time high of $0.68.
Further, BeInCrypto’s analysis reveals that this impressive gain is linked to a surge in whale purchases. Earlier today, Lookonchain reported that a wallet acquired $3.39 million worth of GOAT, likely exerting upward pressure on the price
From a technical perspective, the Accumulation/Distribution (A/D) line shows that the market has continued to buy more of the GOAT. If this continues, the altcoin’s value might rise above $0.70 and move closer to the $1 mark.
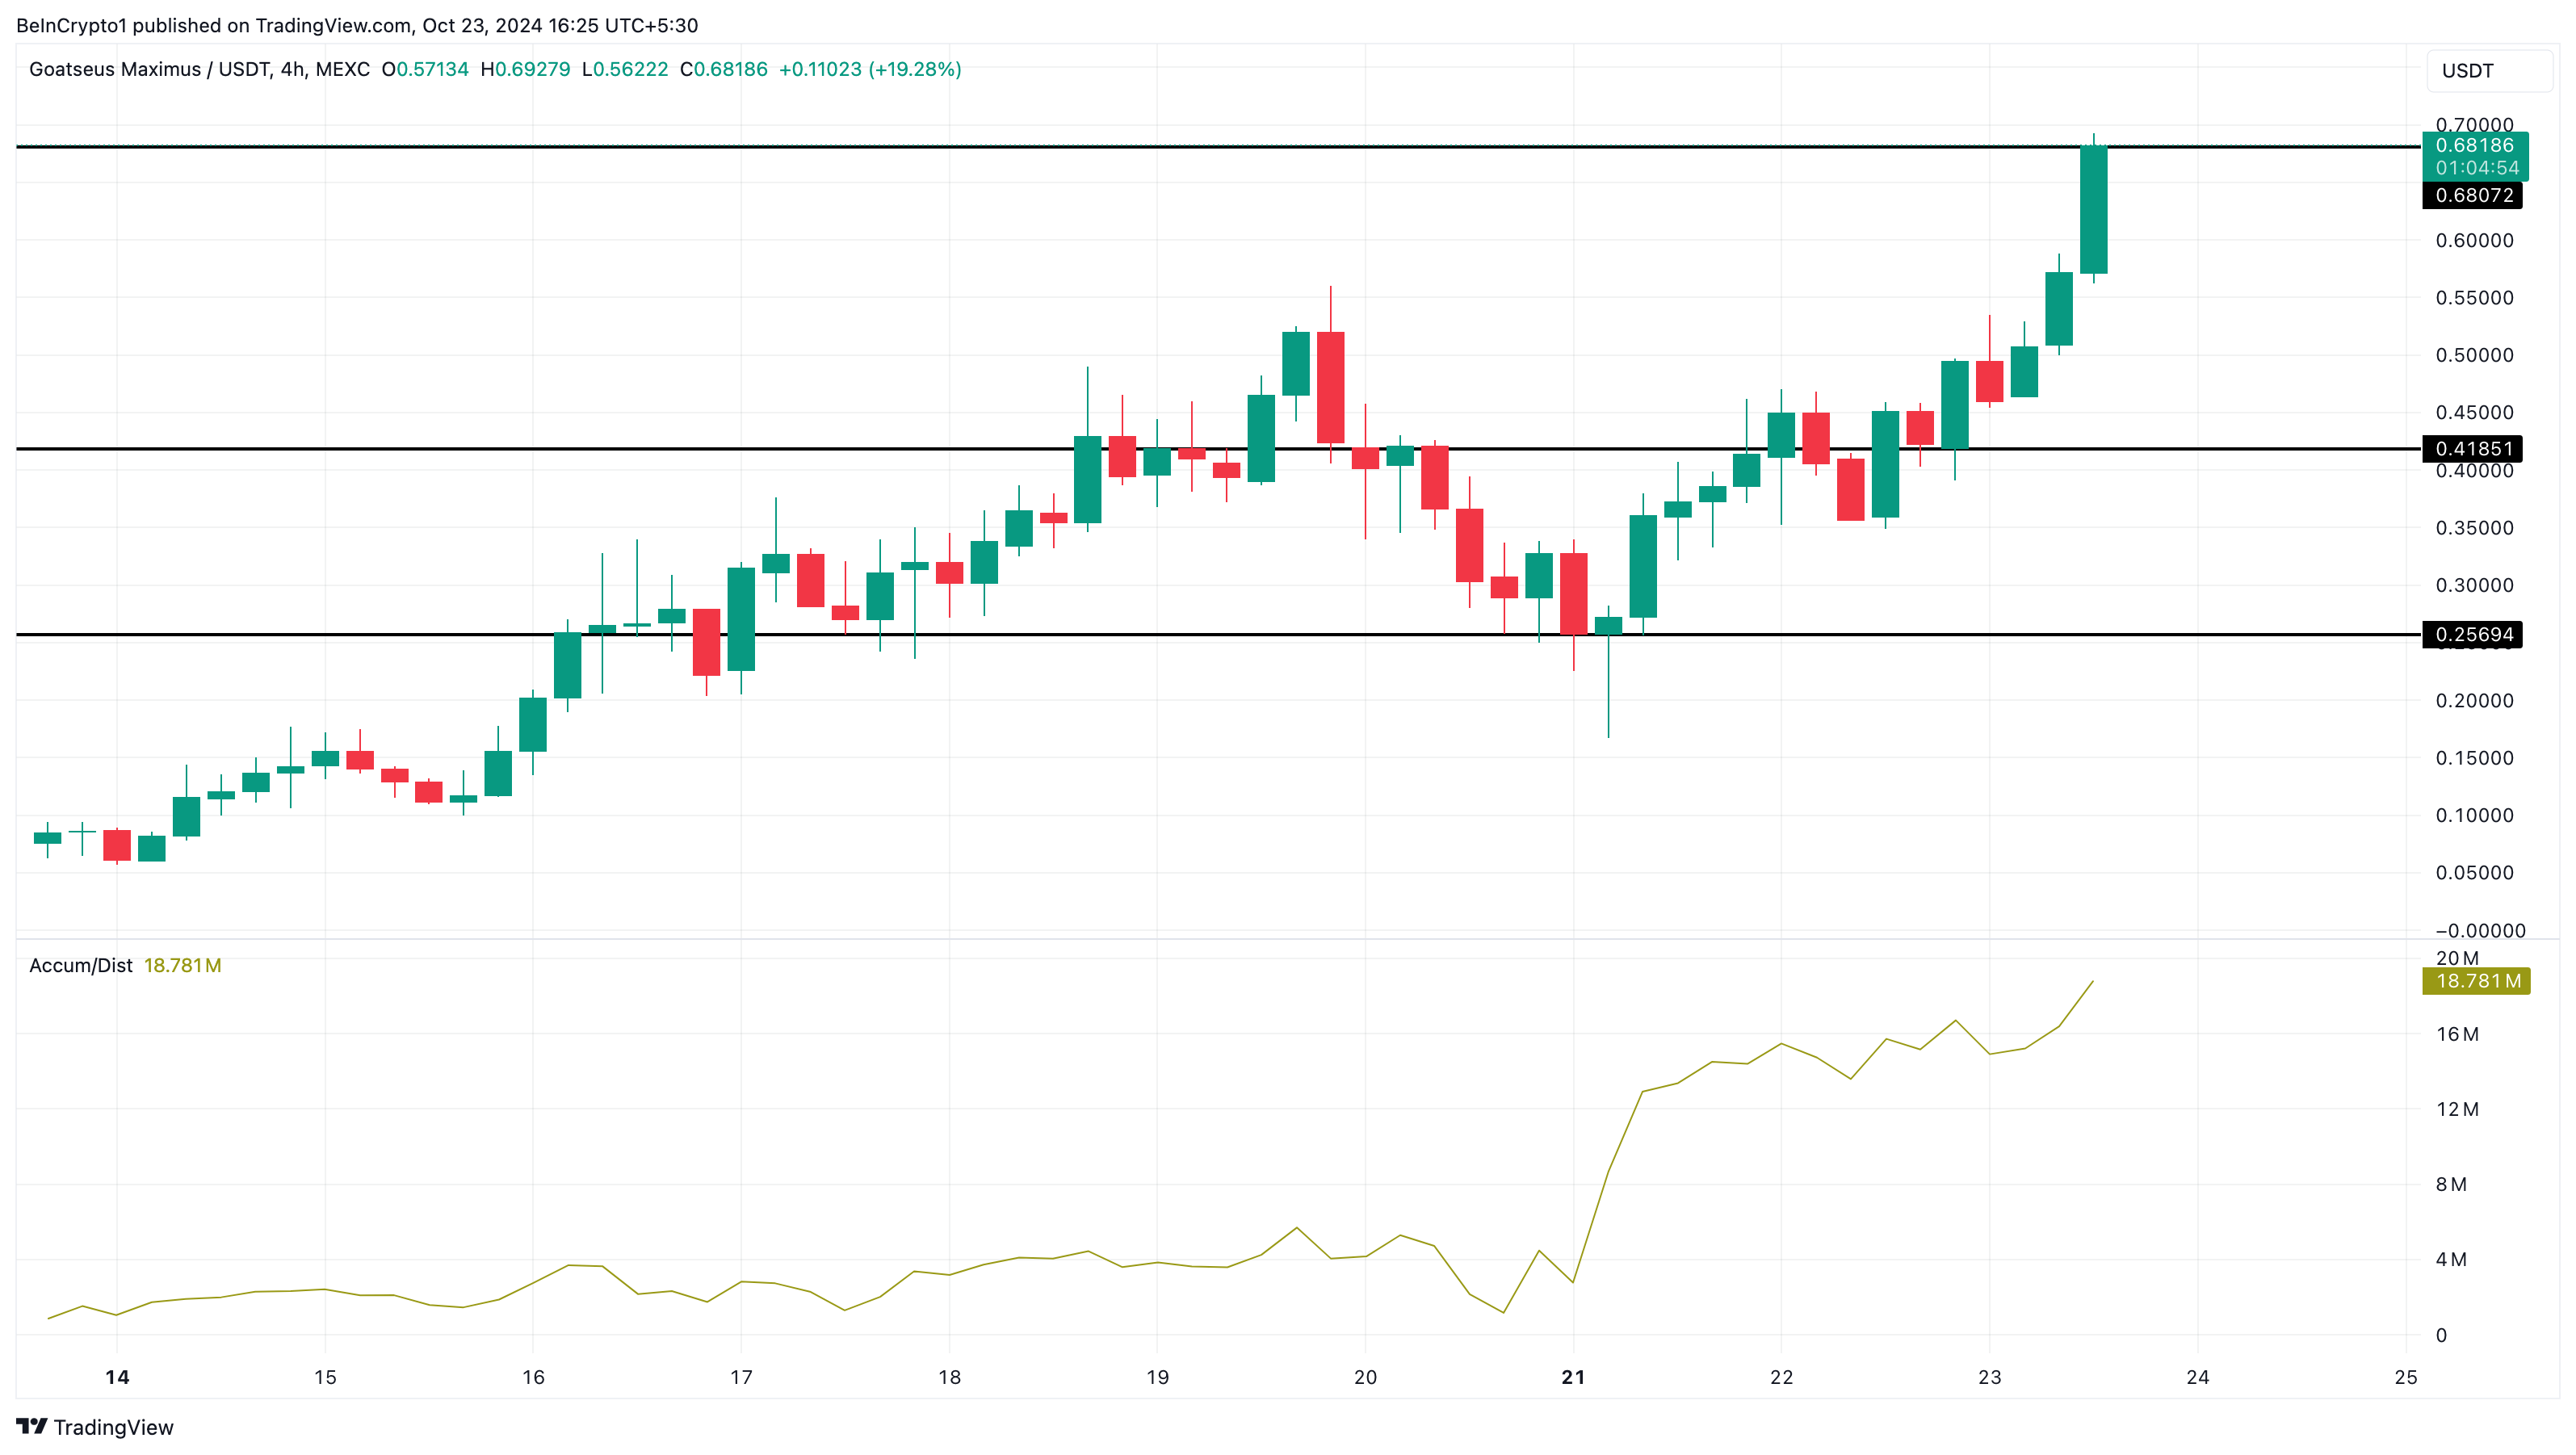
However, that will only be the case if the Bulls continue to receive $0.42 support. On the other hand, the price might sink to $0.26 if holders of the token book profit in large volumes.
On Tuesday, October 22, Scroll emerged as one of the top trending altcoins, and it remains in that group today for similar reasons. According to CoinGecko, SCR’s price has dipped by 16% in the last 24 hours, indicating that recipients of the project’s airdrop may be selling off their allocations.
Currently, Scroll’s price is $1.02 on the one-hour chart. However, the trend suggests a potential decline, with the possibility of falling below $1. If the downward momentum continues, a move to $0.85 could be on the horizon.
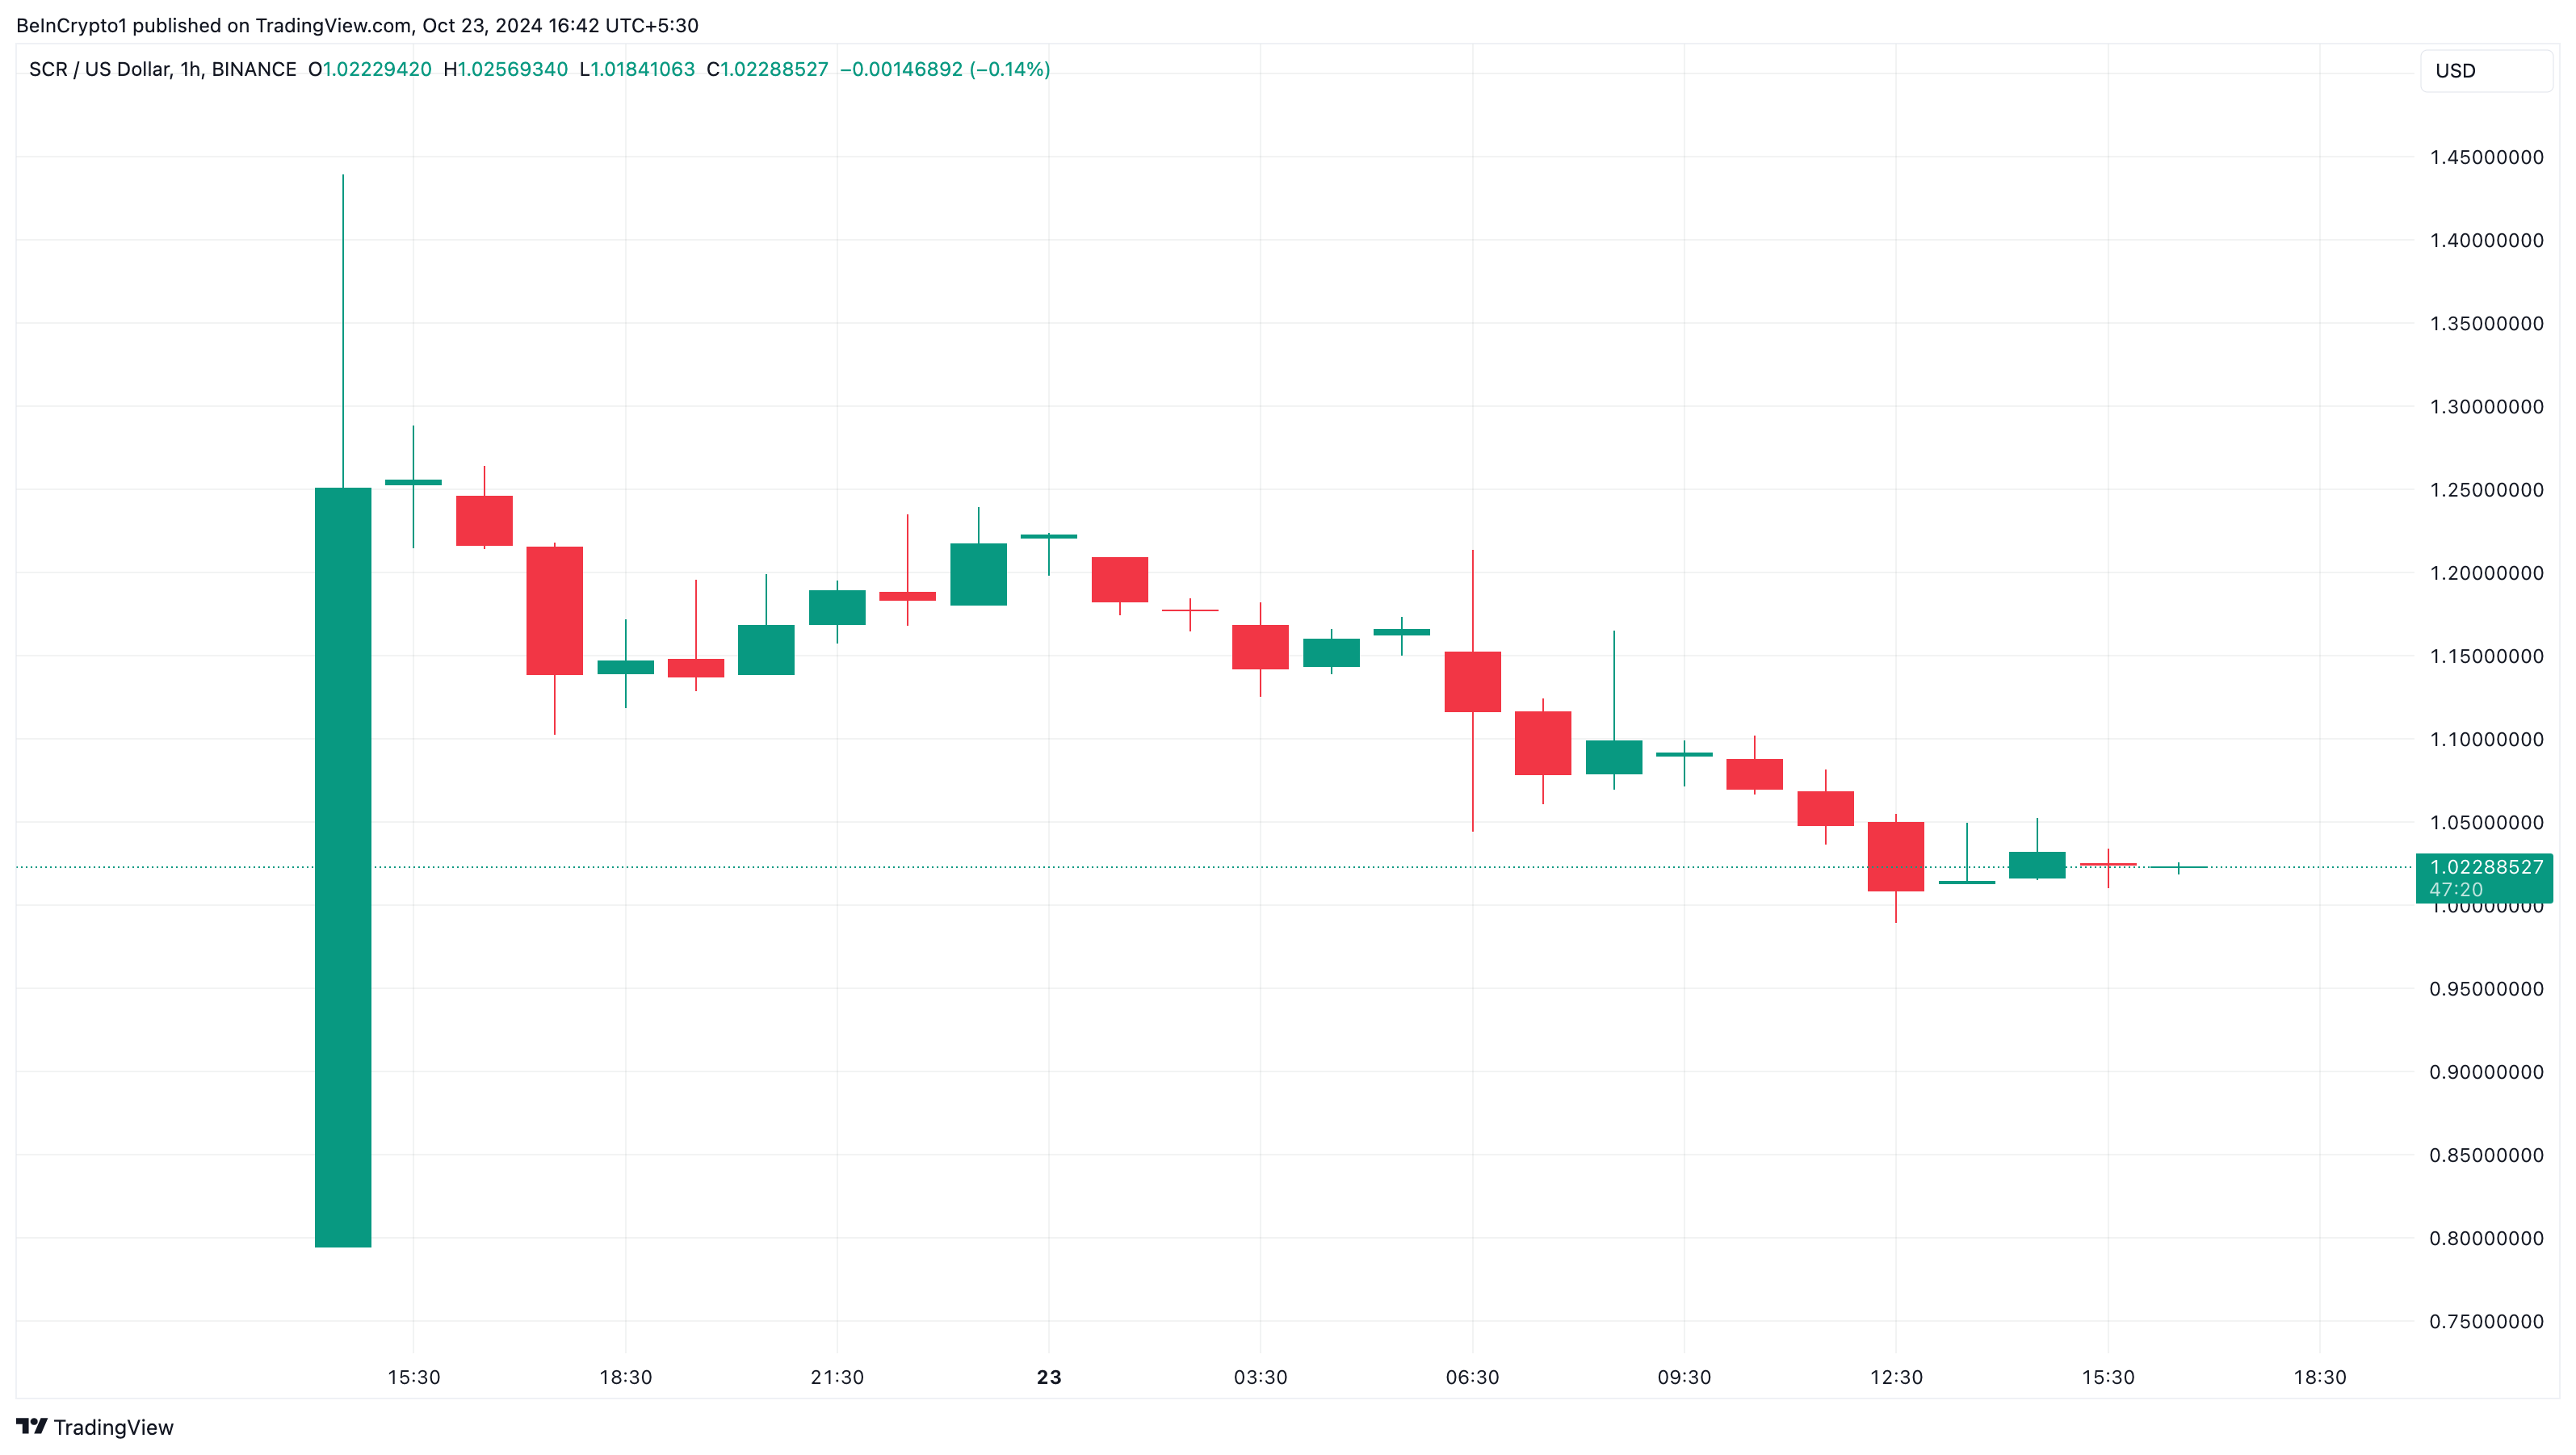
However, if market participants decide to buy the dip, things might change for SCR. If that happens, the price could bounce to $1.30.
KOALA AI (KOKO)
KOALA AI’s inclusion in the trending altcoins list is the third consecutive time. This is basically because of the same reason GOAT is also on the list. But unlike Goatseus Maximus, KOKO’s price is down 4.70% in the last 24 hours.
However, the Awesome Oscillator (AO), which measures momentum, has become positive. This positive reading suggests that market participants are starting to buy the KOKO dip. Should this continue, the altcoin’s price might climb to $0.0000086.
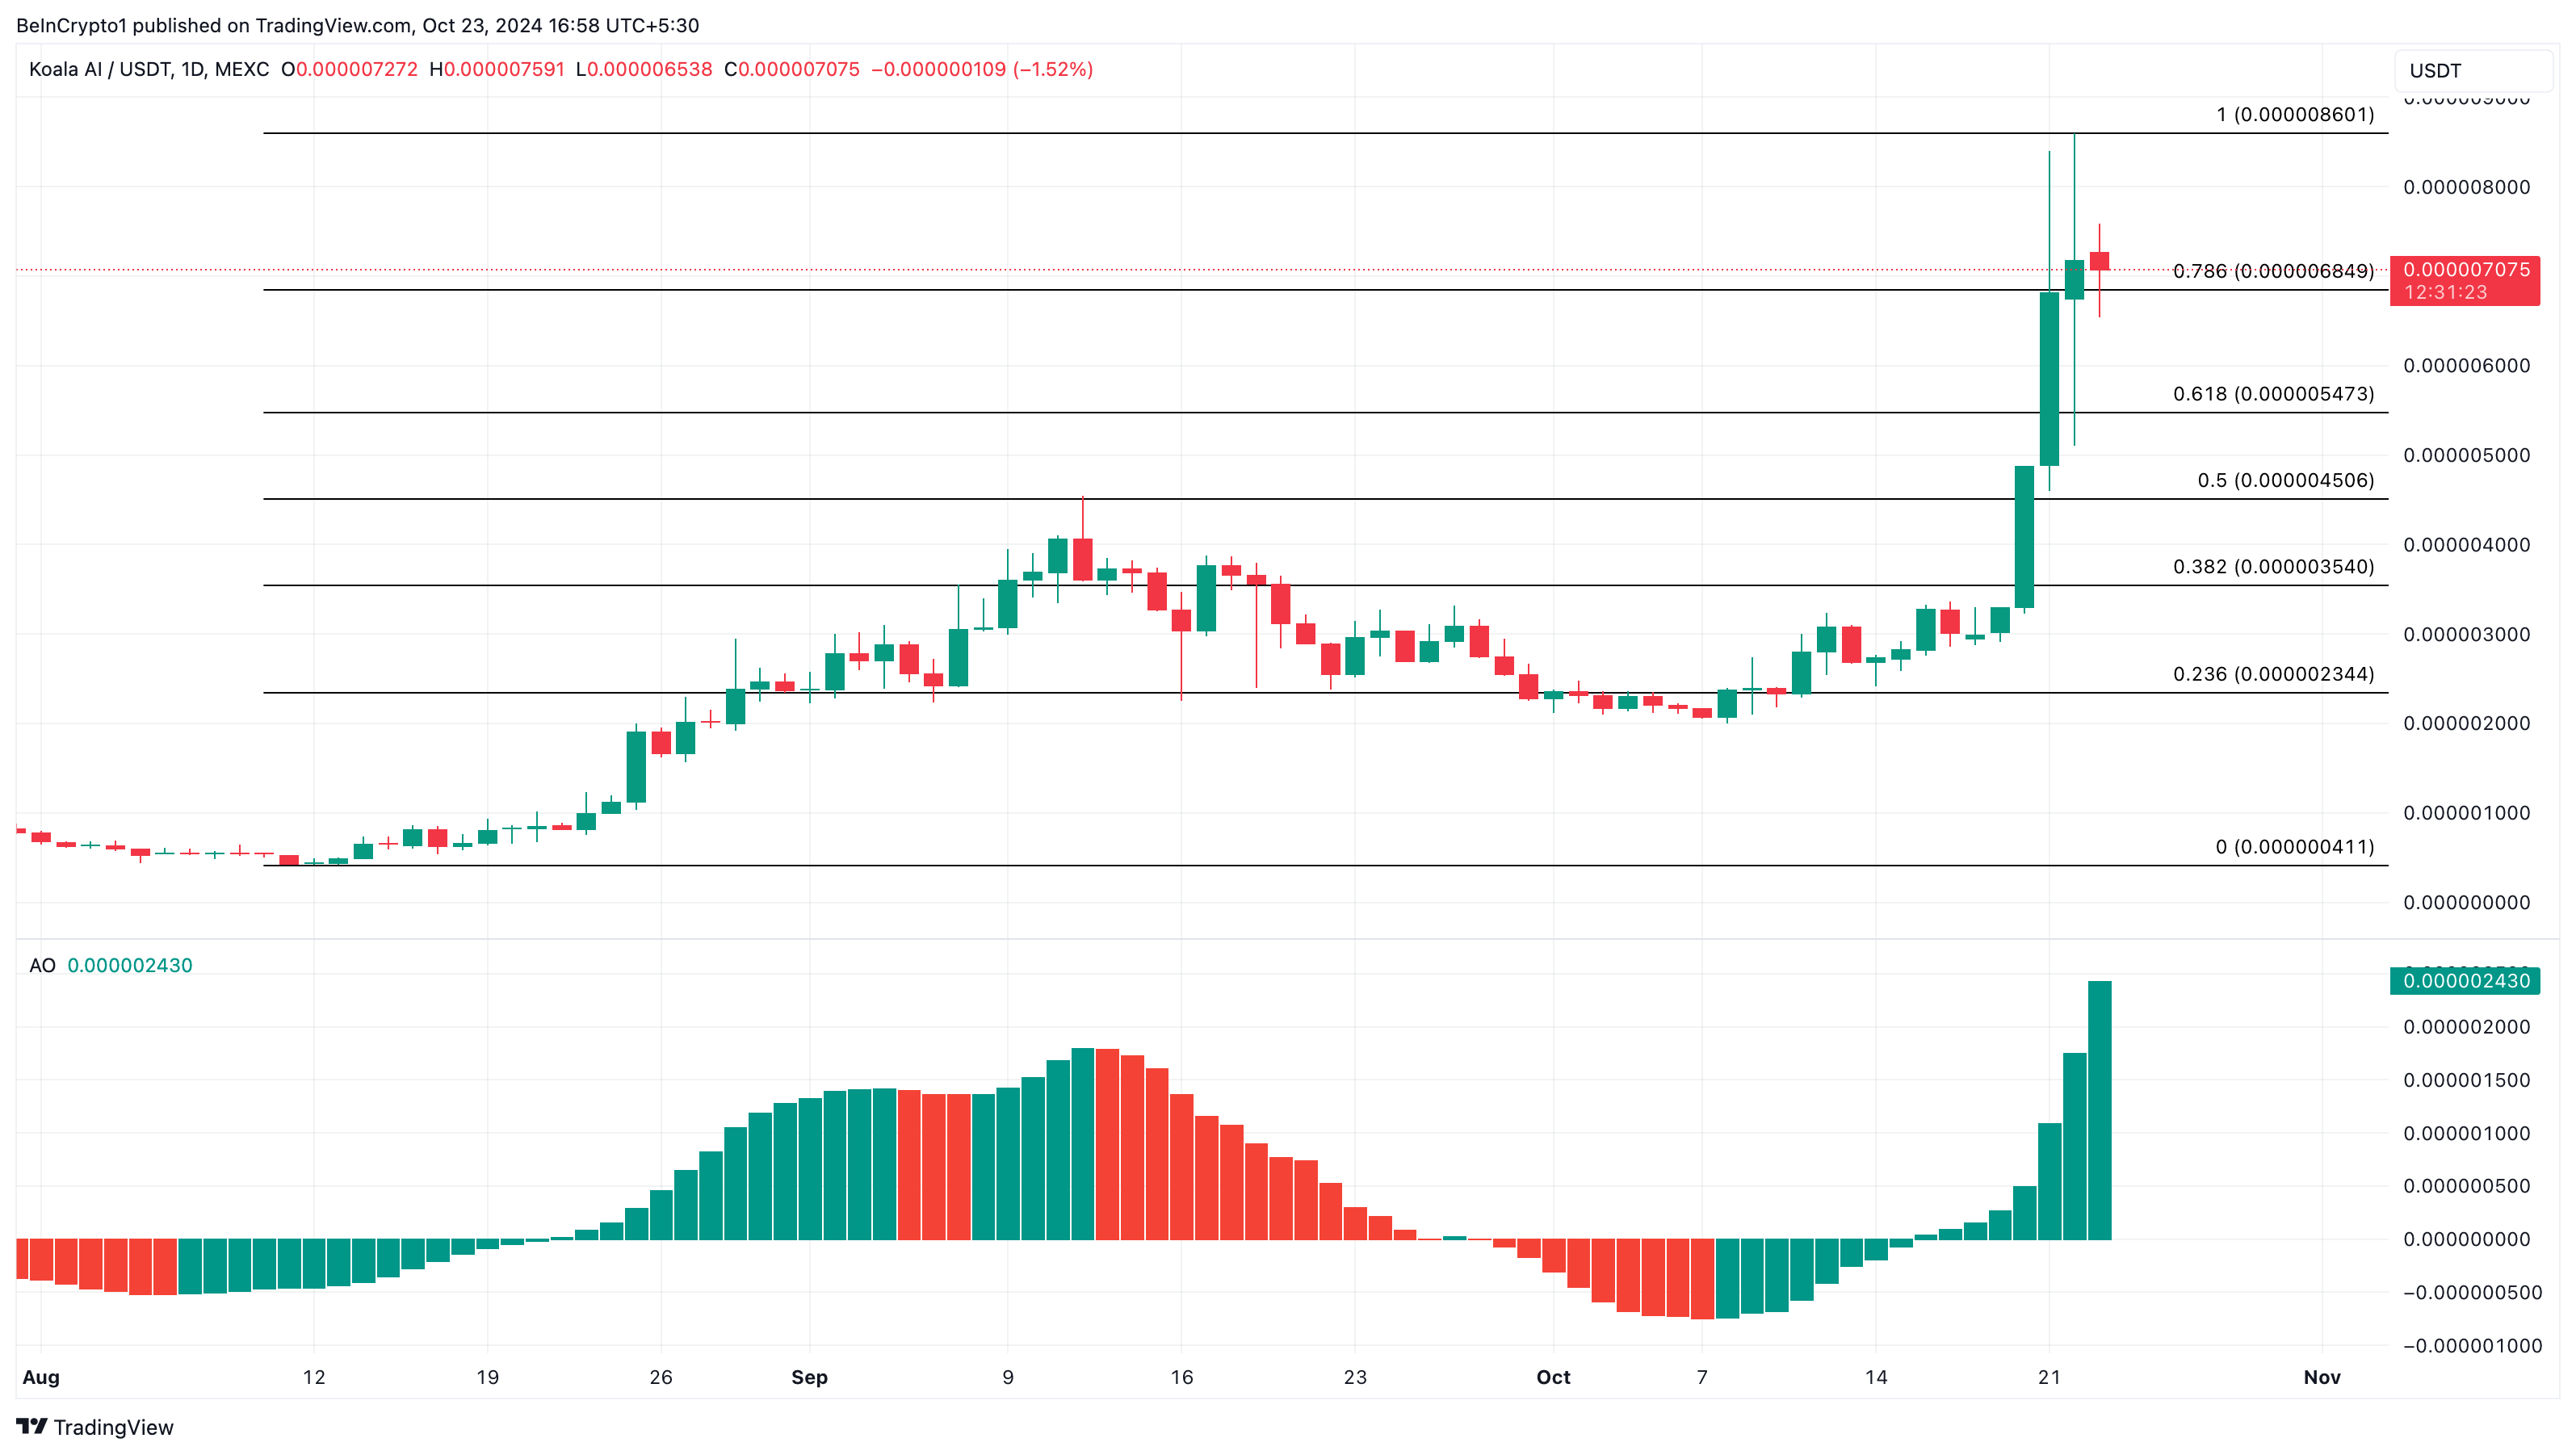
On the flip side, if the momentum turns bearish, then the prediction might be invalidated. Should that be the case, KOALA AI’s price might drop to $0.0000035.
Disclaimer
In line with the Trust Project guidelines, this price analysis article is for informational purposes only and should not be considered financial or investment advice. BeInCrypto is committed to accurate, unbiased reporting, but market conditions are subject to change without notice. Always conduct your own research and consult with a professional before making any financial decisions. Please note that our Terms and Conditions, Privacy Policy, and Disclaimers have been updated.


Justin Sun, founder of TRON and Poloniex CEO, has purchased the viral art piece Comedian—a banana duct-taped to a wall—for $6.2 million at Sotheby’s.
Following the purchase, Sun announced on X (formerly Twitter) that he plans to eat the artwork. This has ignited a frenzy of memes, commentary, and market reactions, even causing the crypto token Banana Gun to spike in value.
Crypto Reacts: Banana Gun on the Rise
Maurizio Cattelan’s Comedian gained international fame in 2019 when it was first displayed at Art Basel Miami. Its simplicity and absurdity—a banana taped to a wall—sparked debates about the nature of art. The so-called artwork became viral when performance artist David Datuna ate it in a stunt dubbed Hungry Artist.
Sun’s pledge to eat the $6.2 million fruit has also drawn parallels, adding another layer of humor to the piece’s history. The Tron founder even said he’s willing to donate the banana to Elon Musk and send it to Mars.

Meanwhile, several users even recreated their own version of Comedian and shared it on social media. One fan followed up by taping bananas around the Massachusetts Institute of Technology (MIT) campus, encouraging others to “tape all over the world” and start a movement.
What they are campaigning for, precisely, remains to be seen.
“In the coming days, I will personally eat the banana as part of this unique artistic experience, honoring its place in both art history and popular culture. Stay tuned,” Sun said on X.
The ripple effects of Sun’s purchase eventually trickled beyond the confines of art and humor and into crypto markets. The token Banana Gun, which shares its name with the theme, surged nearly 16% following the news. Traders and enthusiasts, ever attuned to cultural moments, appear to have seized the chance to capitalize on the buzz.

Sun’s acquisition and the banana’s virality bring to mind another recent development in the art-crypto nexus. Earlier this week, Ethereum co-founder Vitalik Buterin allegedly minted 400 Patron NFTs. This development sparked hopes of a resurgence for the NFT market.
This aged well…. $BANANA is an insane project. For me, this is in the same league as $ZIG. Fundamentals are truly insane. No matter which narrative will cook next, $BANANA will profit from it,” said one trader on X.
The combination of Sun’s high-profile purchase and the market’s reaction to Banana Gun demonstrates how art, humor, and technology continue to blur boundaries. Whether Sun’s banana-eating spectacle will leave a lasting impact or peel away (pun intended) into meme history, one thing is certain—the intersection of crypto and culture remains as unexpected as ever.
Disclaimer
In adherence to the Trust Project guidelines, BeInCrypto is committed to unbiased, transparent reporting. This news article aims to provide accurate, timely information. However, readers are advised to verify facts independently and consult with a professional before making any decisions based on this content. Please note that our Terms and Conditions, Privacy Policy, and Disclaimers have been updated.
Cardano (ADA) price has surged 41.89% in the last seven days, signaling strong bullish momentum in the market. The uptrend remains strong, supported by key technical indicators like the ADX and Ichimoku Cloud, which point to sustained positive sentiment.
However, signs of consolidation and narrowing gaps in short-term indicators suggest that the rally could face challenges if buying pressure weakens.
ADA Current Uptrend Is Still Strong
Cardano DMI chart shows an ADX of 42.7, indicating a strong trend. The metric has remained above 40 since November 7. This high ADX value confirms the robustness of ADA ongoing uptrend, signaling solid momentum behind the recent price movements.
With the positive directional index (D+) at 21.3 and the negative directional index (D-) at 11, bullish pressure continues to outweigh bearish activity, further supporting the upward trajectory.
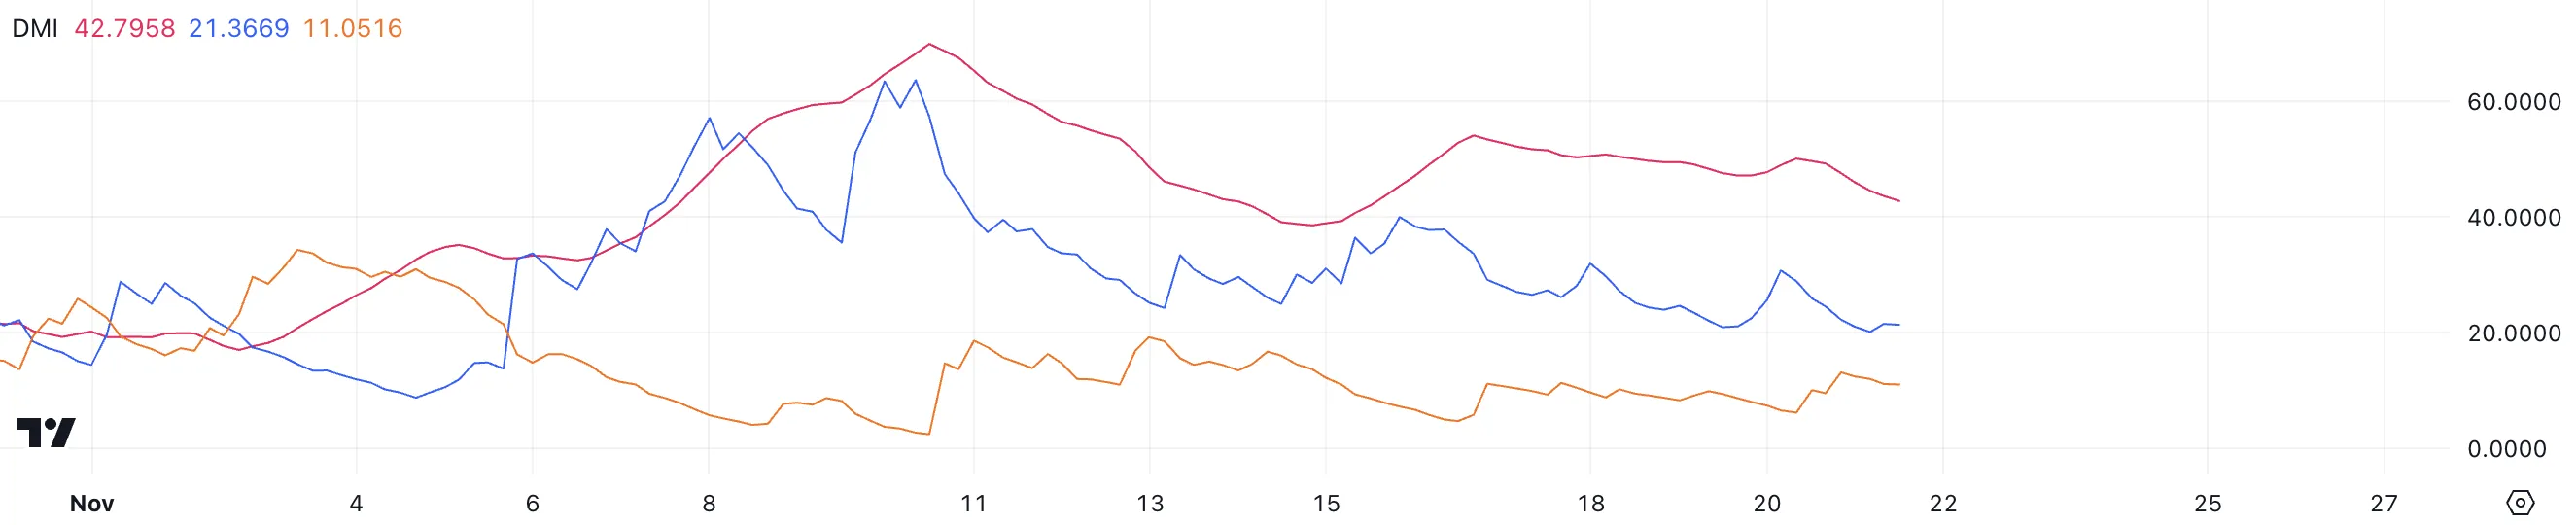
The ADX measures the strength of a trend without considering its direction. Values above 25 indicate a strong trend, while those below 20 suggest a weak or nonexistent trend. With an ADX at 42.7, ADA is clearly in a strong uptrend, showing significant market confidence.
The gap between D+ and D- reinforces the bullish dominance, suggesting that ADA price could sustain its upward movement if current conditions persist.
Cardano Ichimoku Cloud Shows An Important Signal
The Ichimoku Cloud chart for Cardano indicates a generally bullish trend, as the price remains above the cloud (Kumo). The Tenkan-sen (blue line) and Kijun-sen (red line) are relatively flat, showing signs of consolidation after ADA’s recent rally.
While the price is still trading above these lines, the narrowing gap between the price and the Tenkan-sen suggests weakening short-term momentum.
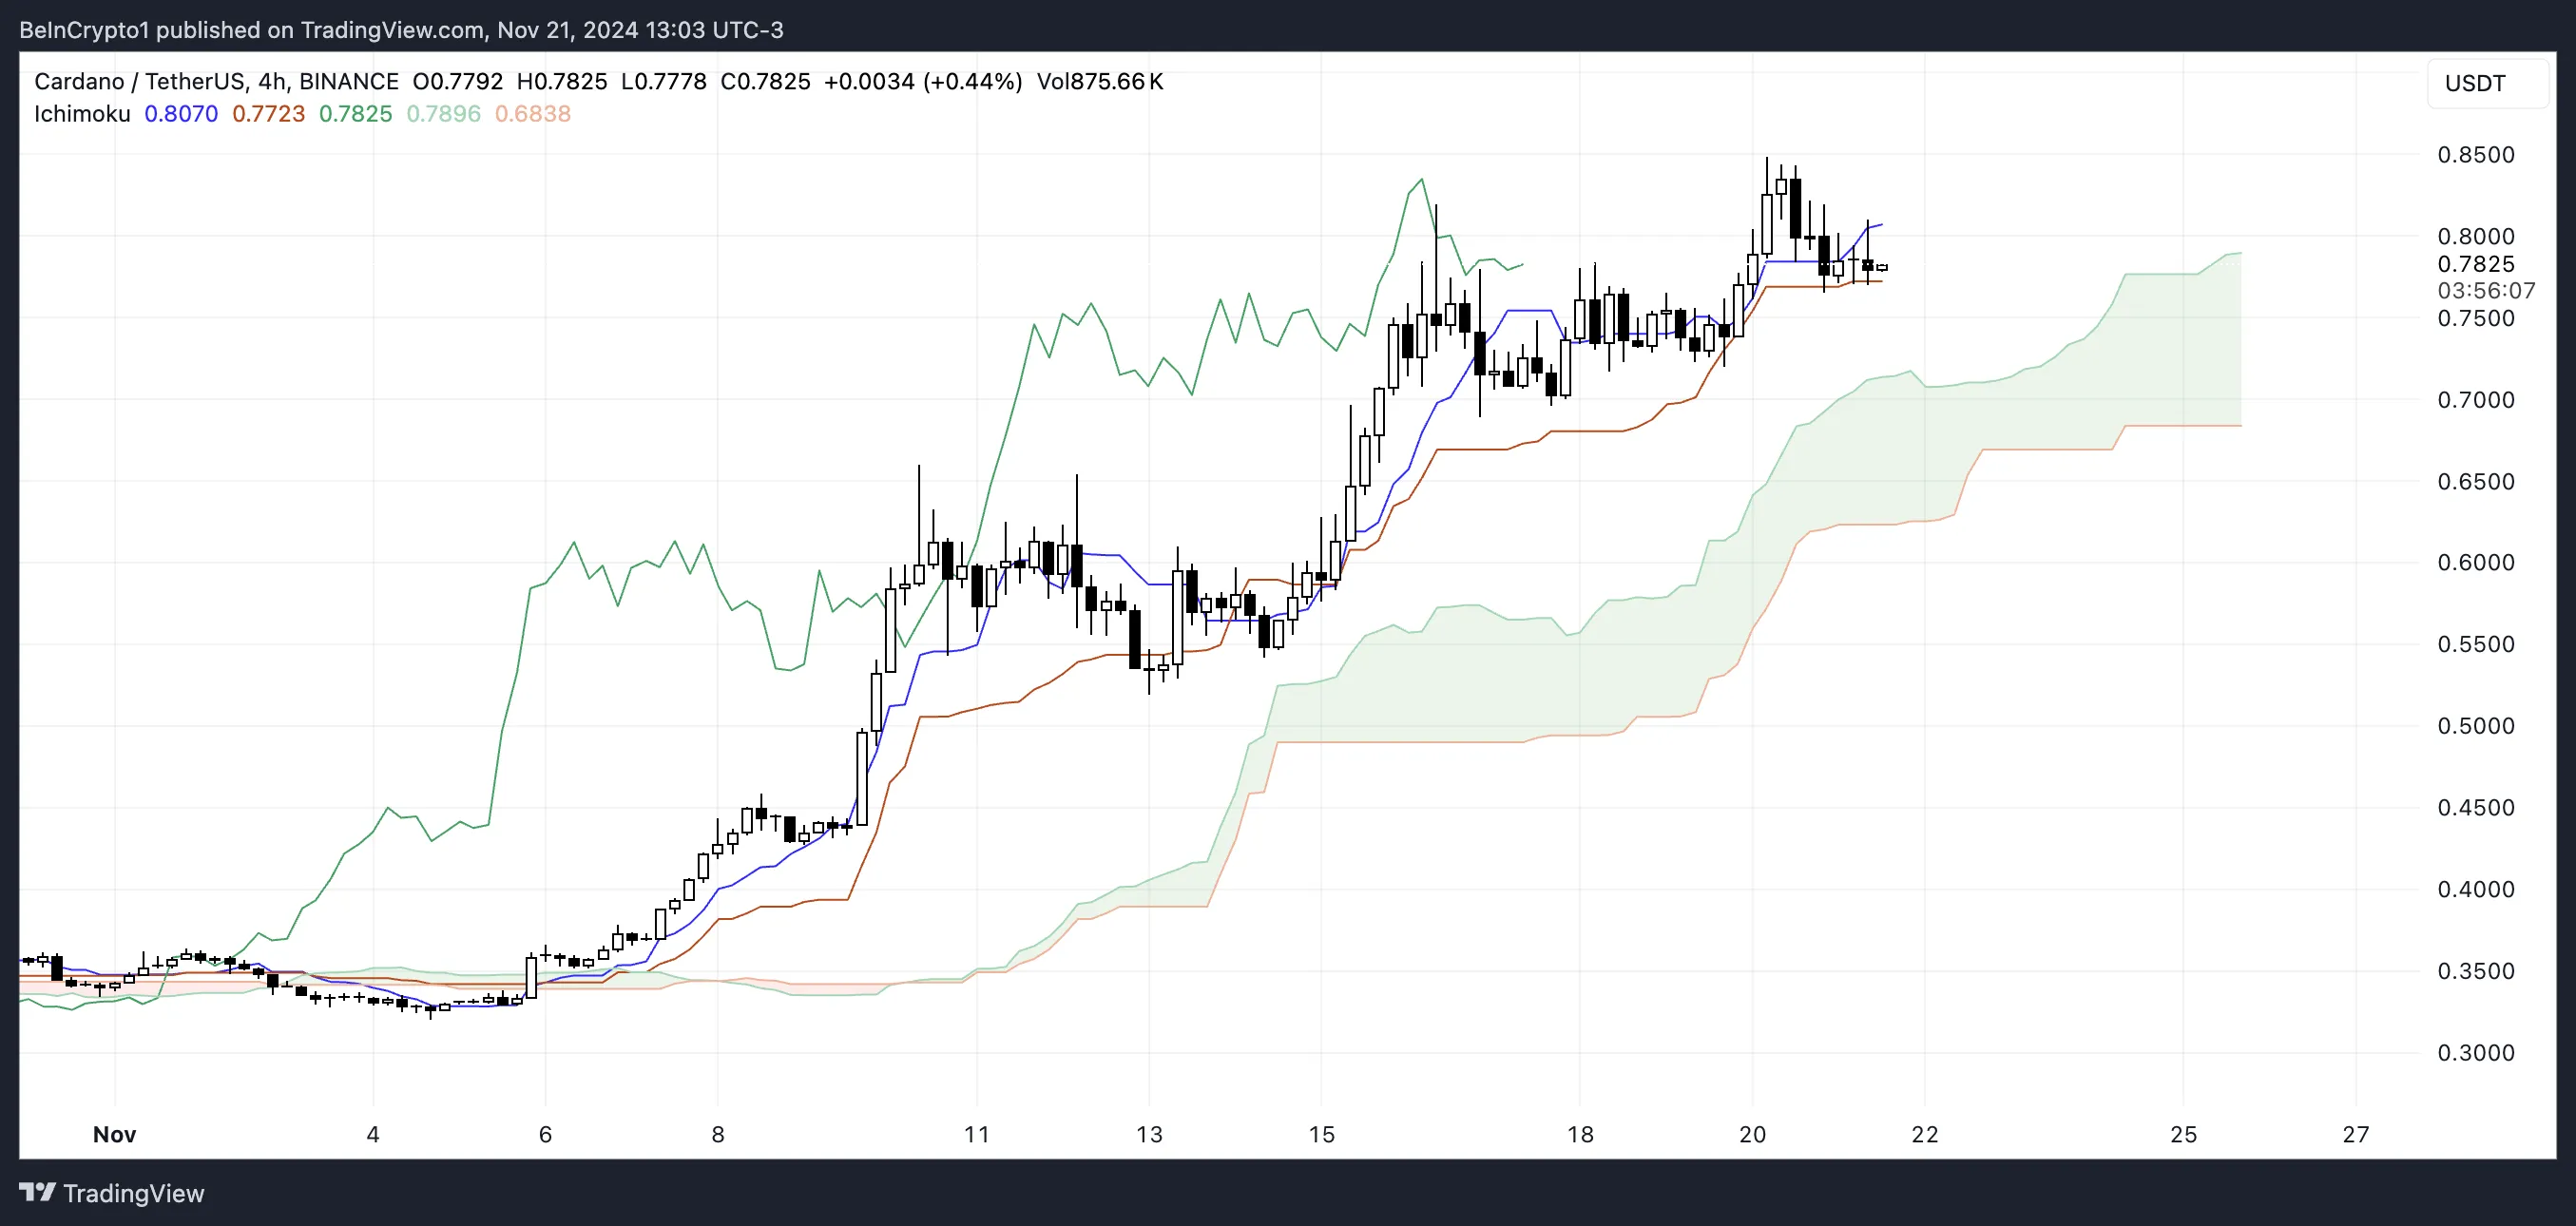
The green cloud ahead signals potential support for ADA uptrend, but the current consolidation phase highlights the need for sustained buying pressure to maintain this momentum.
If the price drops below the Kijun-sen or approaches the cloud, it could signal a possible shift toward bearish sentiment.
ADA Price Prediction: Can It Reach $1 In November?
If Cardano (ADA) maintains its strong uptrend, it could test the resistance at $0.85. Breaking this level could pave the way for further gains, with the potential to reach the $1 threshold, marking a 20% rise from current levels and the highest price for Cardano since April 2022.
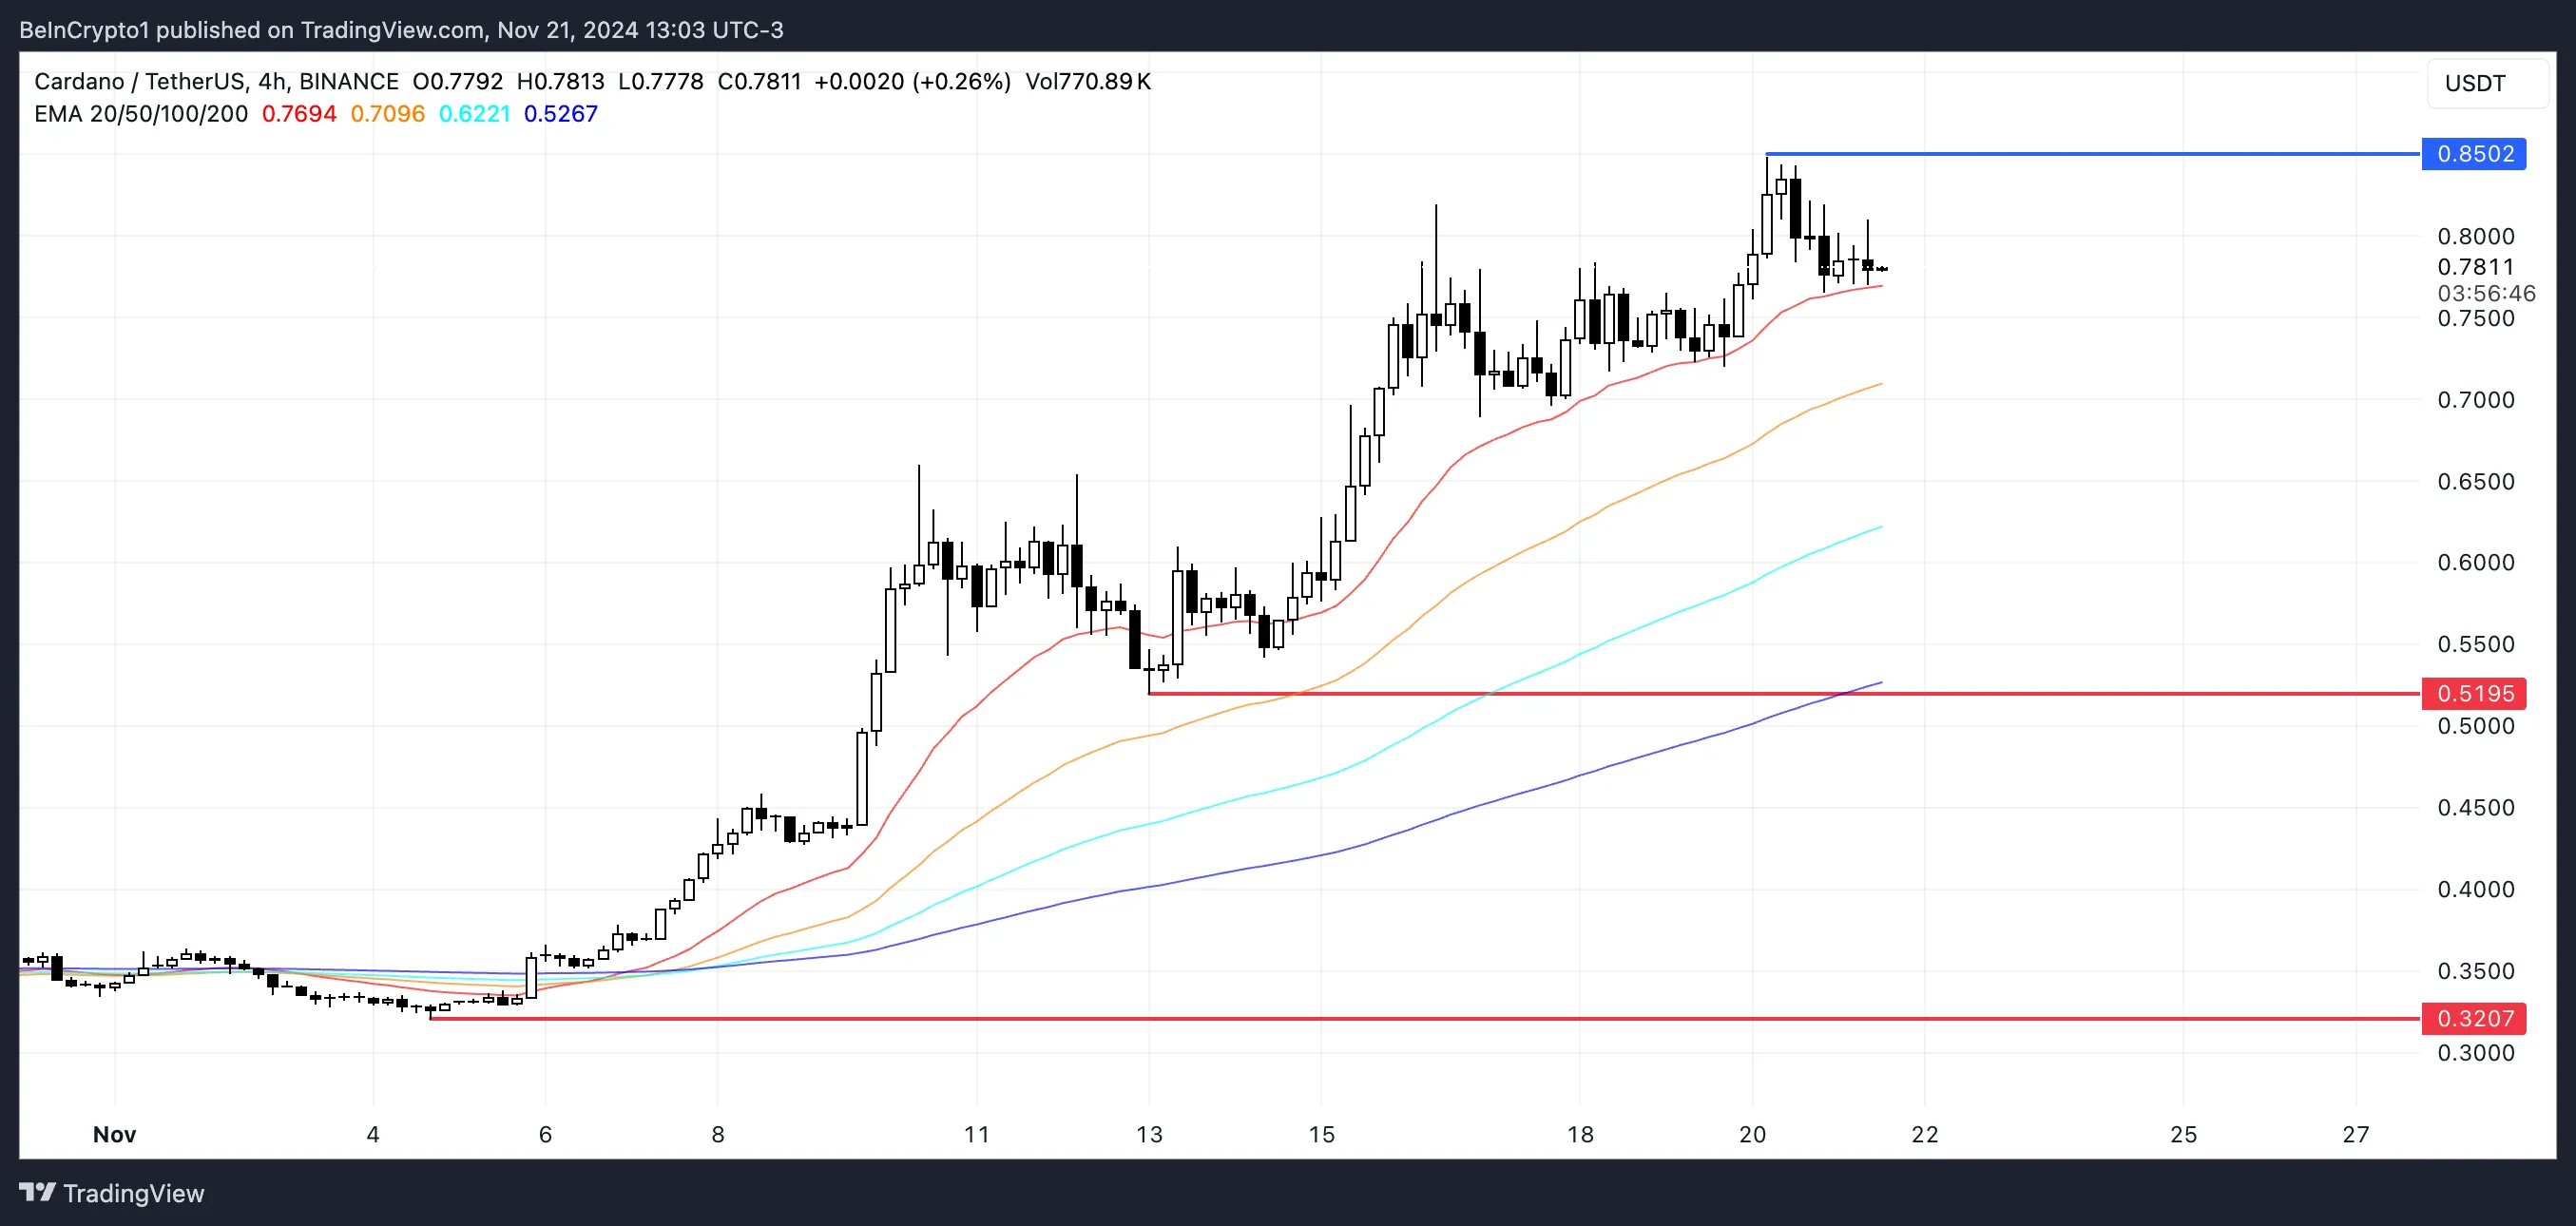
However, as indicated by the Ichimoku Cloud, a potential reversal could be on the horizon. If bearish momentum takes over, ADA price could face significant downward pressure, potentially dropping to $0.51.
If this support fails, the price could decline further to $0.32, representing a steep 59% correction. This highlights the importance of the current support and resistance levels in determining ADA’s next direction.
Disclaimer
In line with the Trust Project guidelines, this price analysis article is for informational purposes only and should not be considered financial or investment advice. BeInCrypto is committed to accurate, unbiased reporting, but market conditions are subject to change without notice. Always conduct your own research and consult with a professional before making any financial decisions. Please note that our Terms and Conditions, Privacy Policy, and Disclaimers have been updated.
Earlier today, the Layer-1 blockchain Sui experienced a two-hour blackout, halting block production and rendering transaction processing impossible. This network outage led to a slight dip in SUI’s price, falling from $3.73 to $3.64.
Despite concerns of a more significant decline, the price stabilized after the project announced that the network was fully restored and operational.
Sui Comes Back Online, Altcoin Still in Good Position
Around 10:52 UTC, web3 security firm ExVull disclosed that a DOS bug caused the Sui network outage. Fully known as a Denial-of-Service (DoS) attack, the bug” refers to a software attack that overwhelms a system with excessive traffic or requests, causing it to become unavailable to legitimate users by crashing or severely slowing its functionality.
“After our analysis, it was found that the Sui Network node occur DOS due to integer overflow,” ExVul stated.
Following this development, several exchanges halted SUI transactions as the price also dipped a little. However, nearly two hours later, the project updated its community, saying that validators had assisted in resolving the issue.
“The Sui network is back up and processing transactions again, thanks to swift work from the incredible community of Sui validators. The 2-hour downtime was caused by a bug in transaction scheduling logic that caused validators to crash, which has now been resolved,” it explained.
Meanwhile, data from Messari showed that, amid the outage, the Sharpe ratio remained positive. The Sharpe ratio is a key measure of risk-adjusted return, indicating how much excess return an investment generates relative to its volatility.
It helps investors assess whether the returns of a riskier asset justify the risk taken. A higher ratio signifies better risk-adjusted performance. Typically, when the ratio is negative, it means that the risk might not be worth the reward.
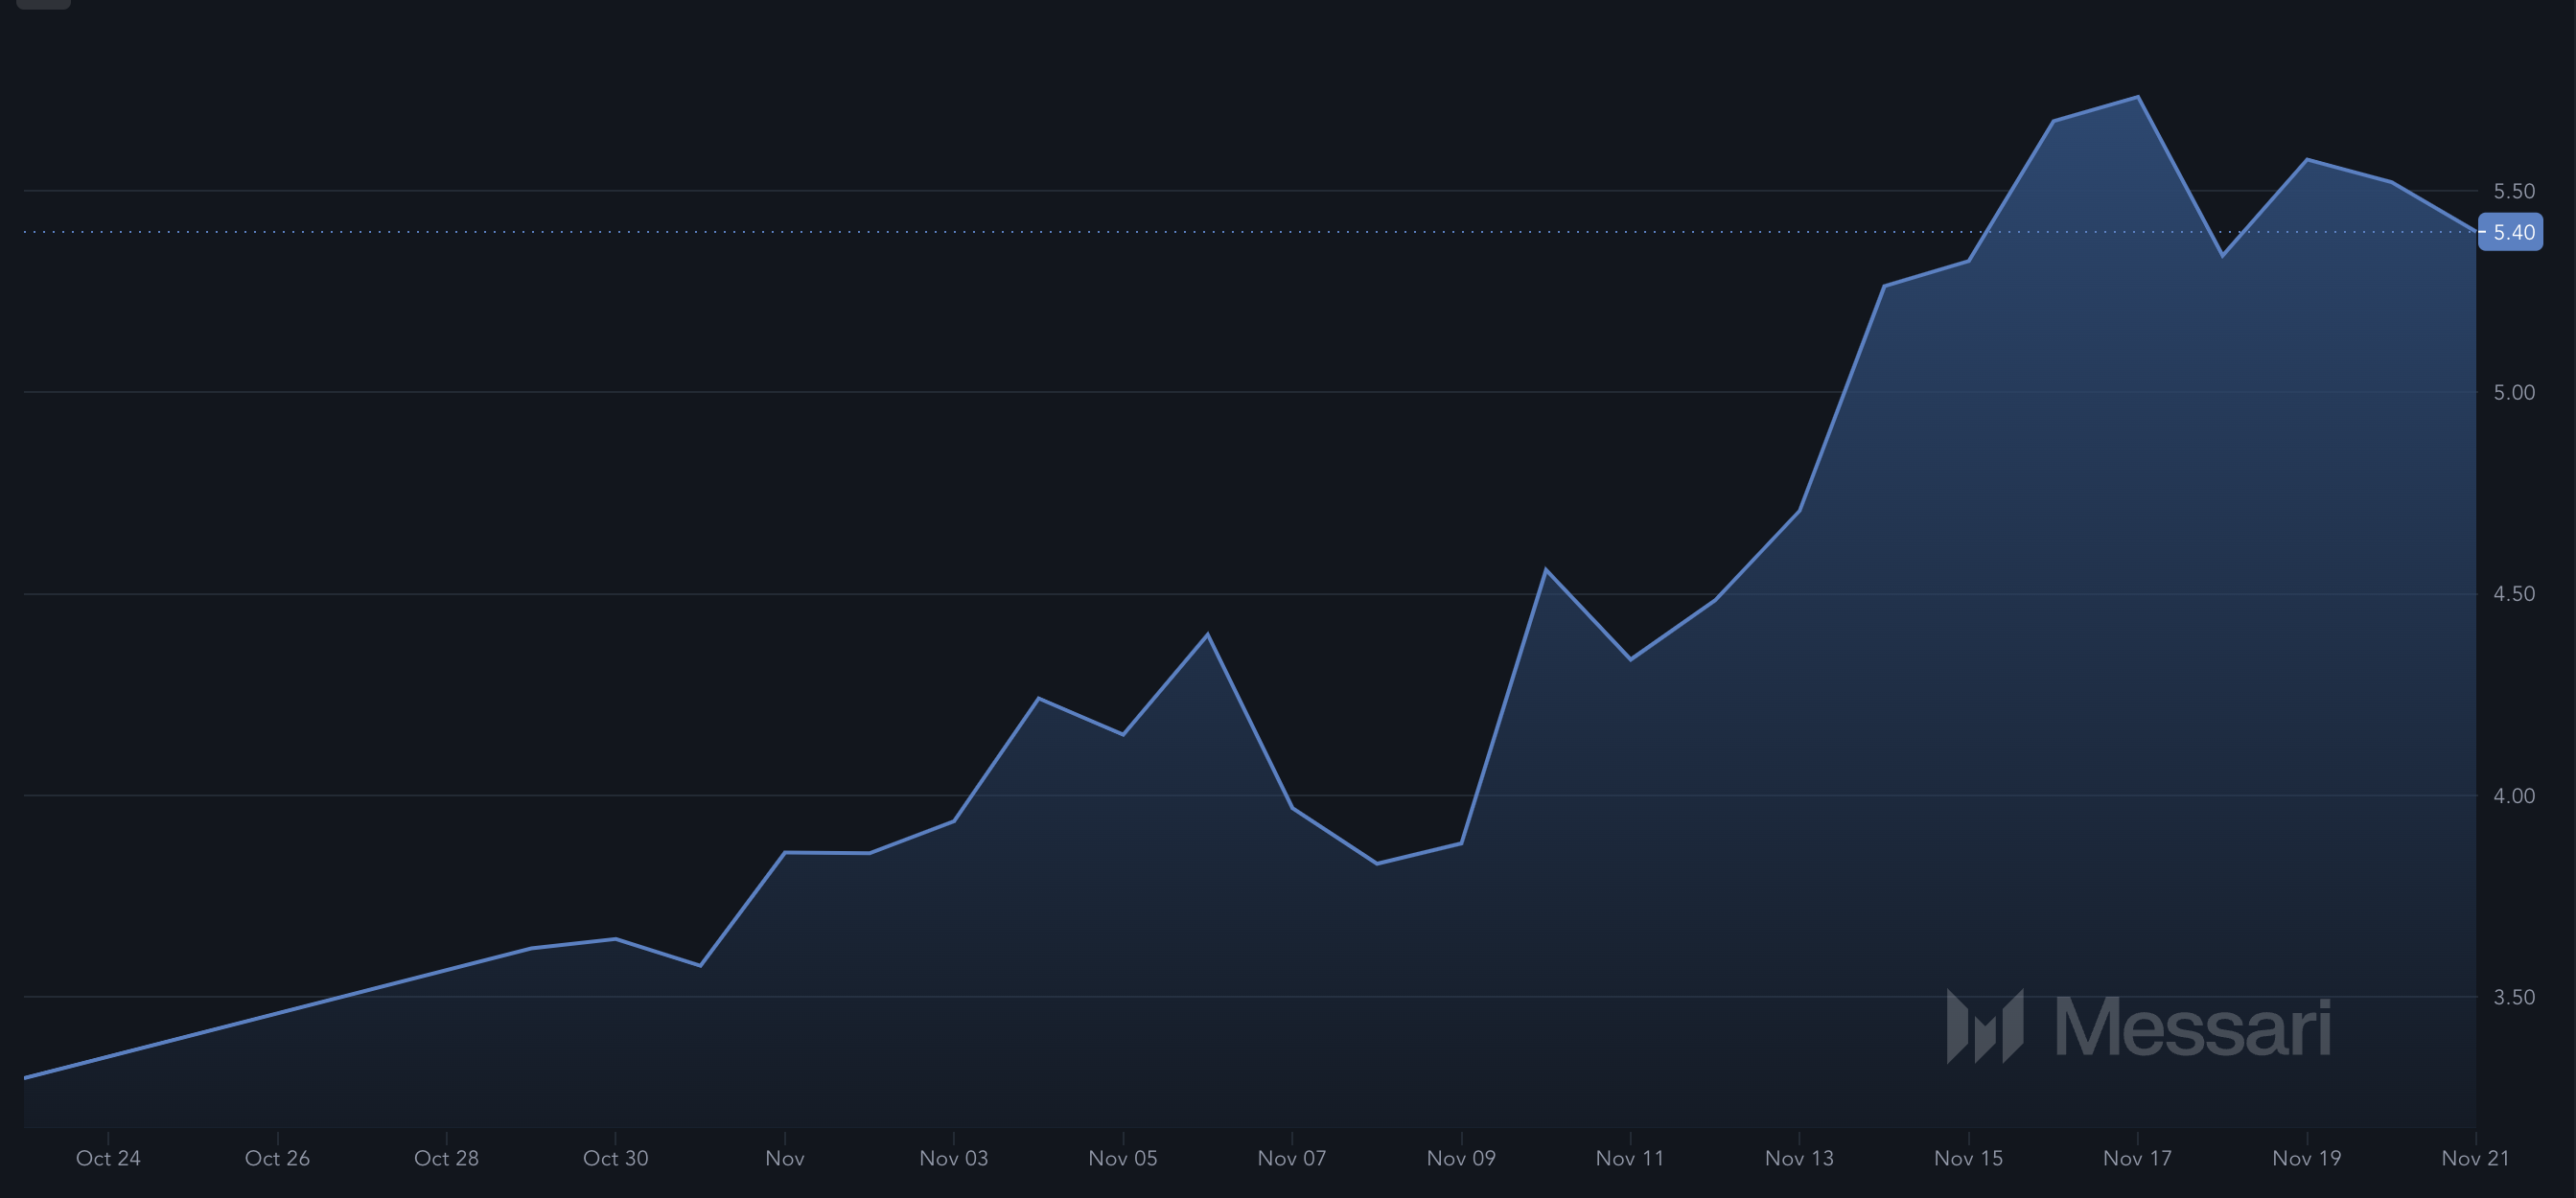
However, since it is positive for SUI, it indicates that accumulating the altcoin around its current value could still yield positive returns.
SUI Price Prediction: Run Above $4
On the daily chart, SUI continues to trade within an ascending channel. An ascending channel, also called a rising channel or channel up, is a chart pattern defined by two parallel upward-sloping lines.
It forms when the price shows higher swing highs and higher swing lows, indicating an ongoing uptrend. Furthermore, the Chaikin Money Flow (CMF) has increased, suggesting that buying pressure has outpaced distribution.
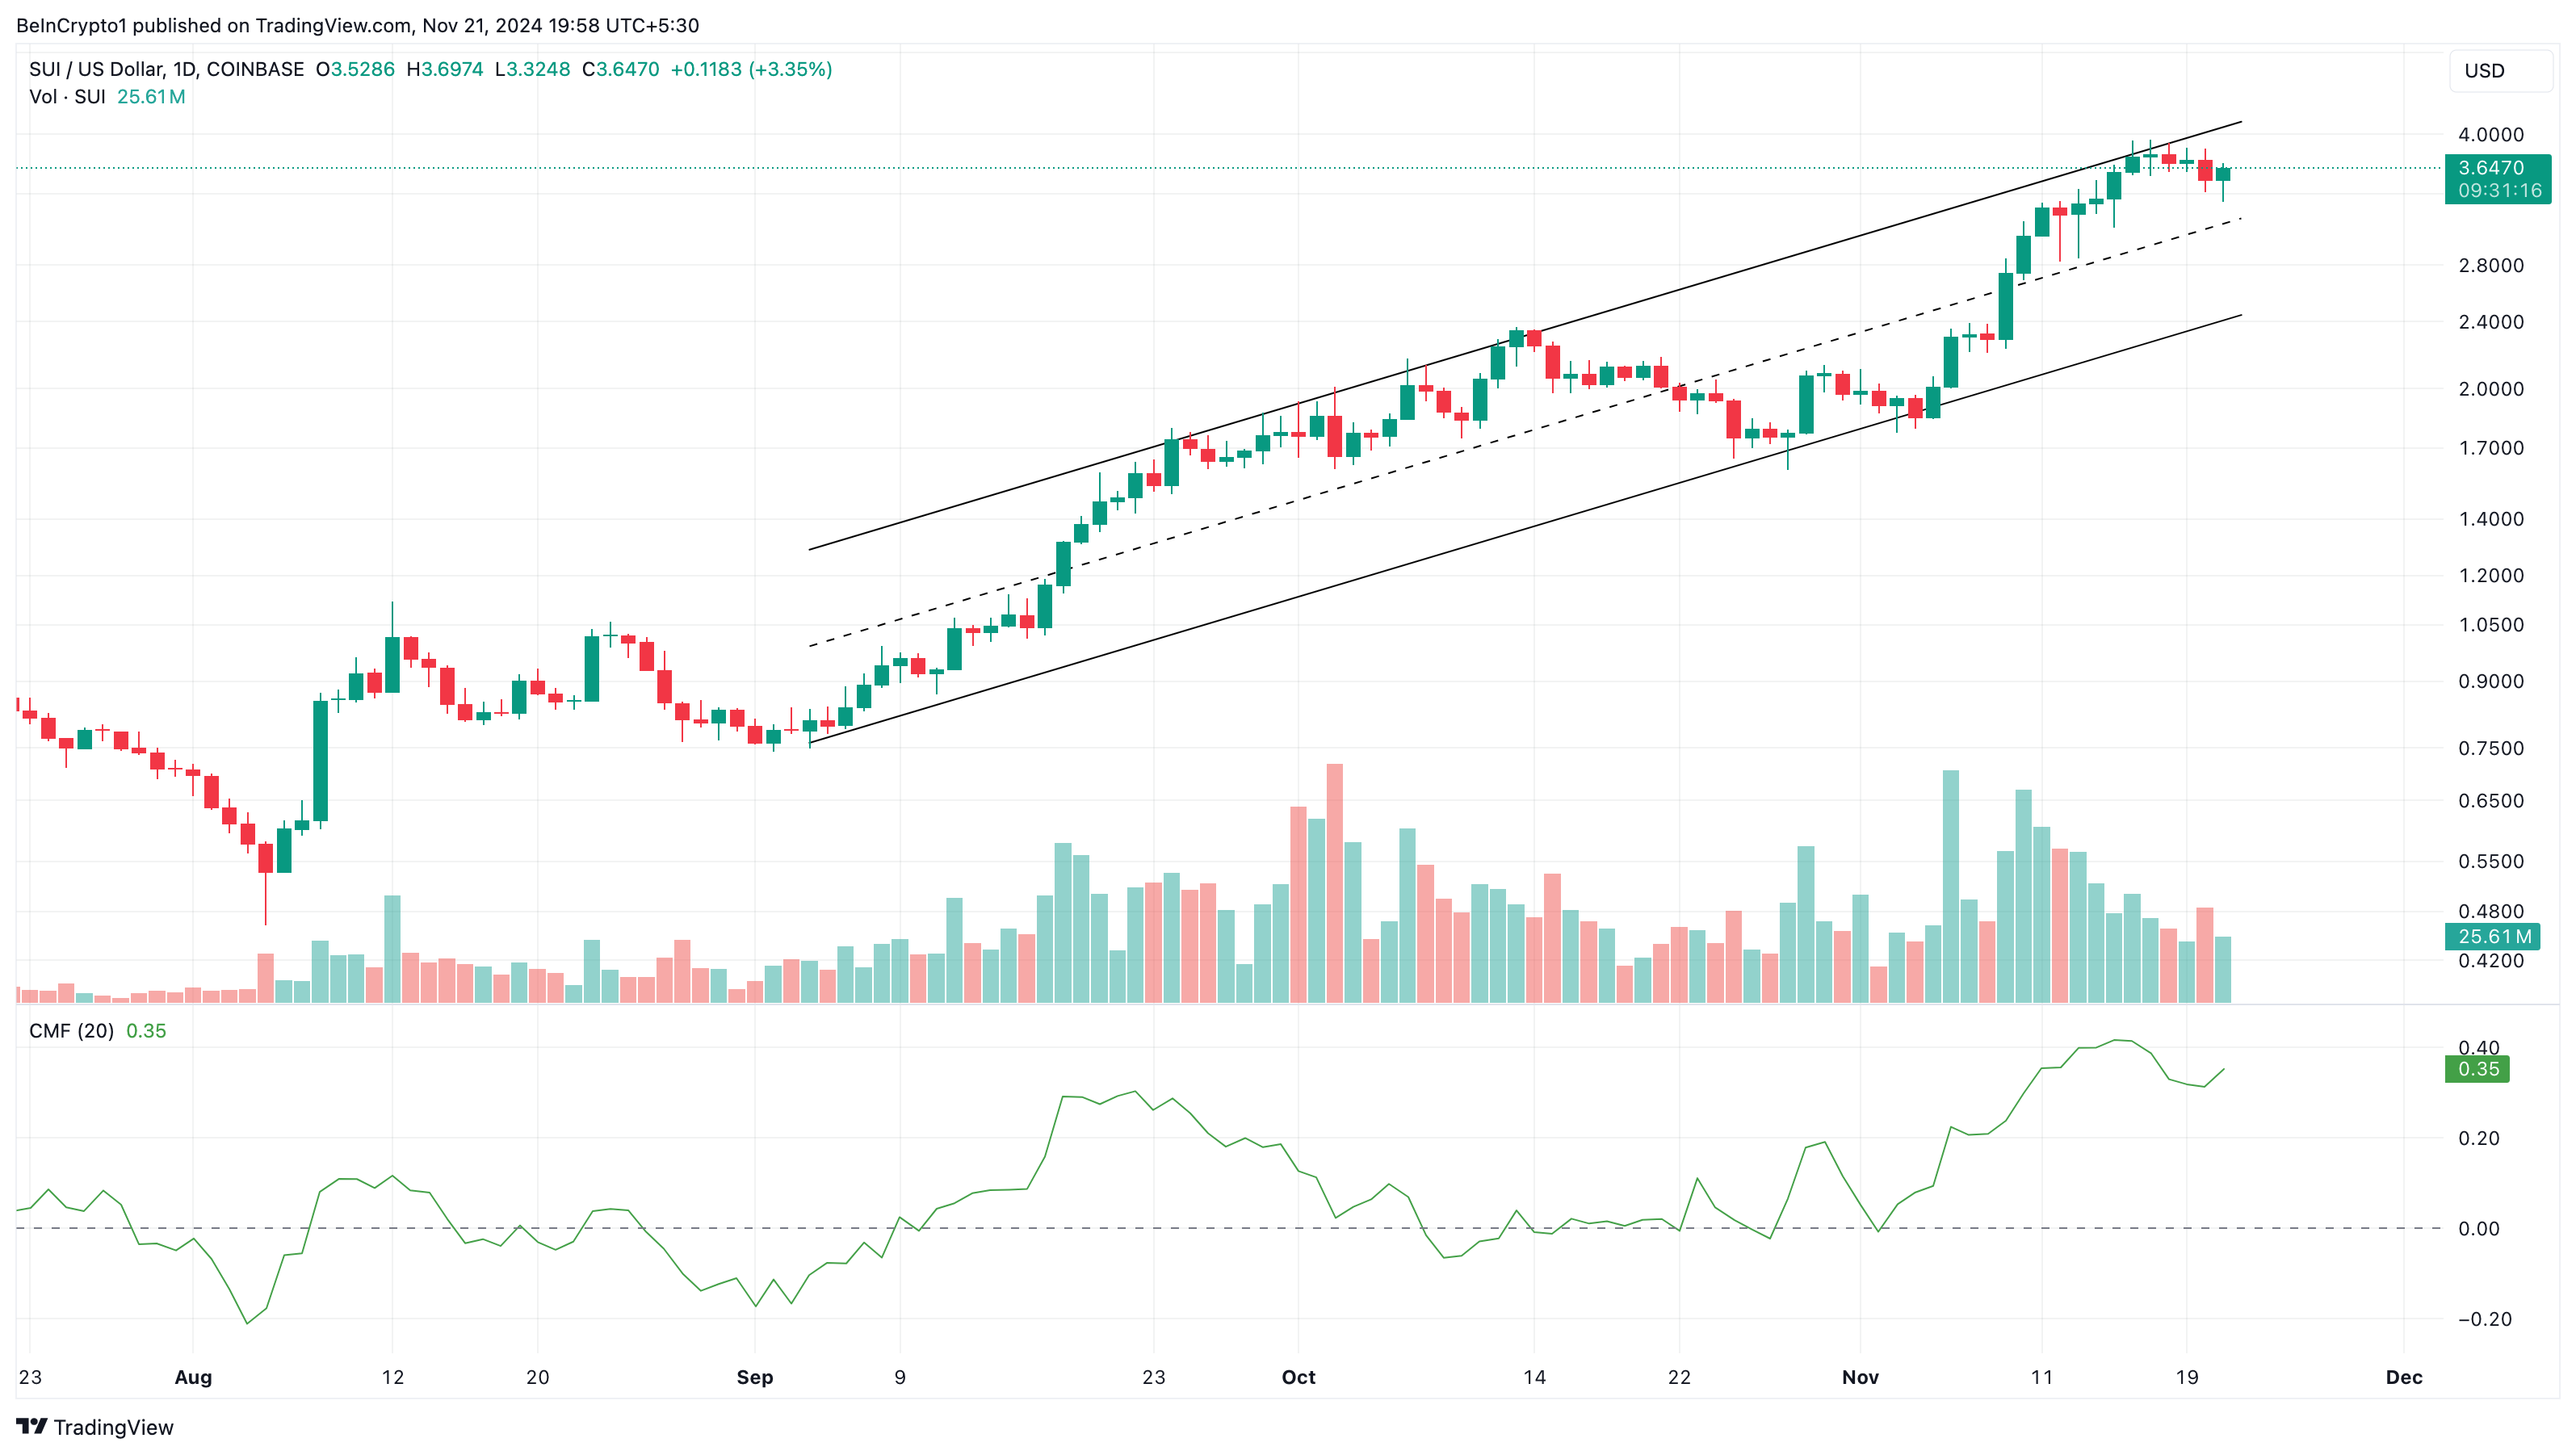
If this continues, SUI’s price could climb above $4. However, if a Sui network outage occurs again, this might not happen. In that scenario, the value could drop below $3.
Disclaimer
In line with the Trust Project guidelines, this price analysis article is for informational purposes only and should not be considered financial or investment advice. BeInCrypto is committed to accurate, unbiased reporting, but market conditions are subject to change without notice. Always conduct your own research and consult with a professional before making any financial decisions. Please note that our Terms and Conditions, Privacy Policy, and Disclaimers have been updated.

Banana Gun Rises After Justin Sun’s $6.2 Million Art Purchase
Cardano (ADA) Price Hits 41% Weekly Growth, $1 Target in Sight

Why SUI Network Outage Did Not Cause a Price Crash

Analyst Reveals When The Ethereum Price Will Reach A New ATH, It’s Closer Than You Think

Gary Gensler To Step Down As US SEC Chair In January

Aptos Partners with Circle and Stripe to Revitalize Network

2.52 Million Altcoins Are Ruining Crypto’s Future

Animoca Brands Valuation Tanks 75% In Two Years, Here’s Why

Crypto exchange BingX hacked for $43 million

Are The Big Players Losing Interest?

Hong Kong’s Securities Association Tips Authorities On Crypto Self-Regulation

Coinbase cbBTC Set to go Live on Solana
2.52 Million Altcoins Are Ruining Crypto’s Future
Animoca Brands Valuation Tanks 75% In Two Years, Here’s Why
Crypto exchange BingX hacked for $43 million
Are The Big Players Losing Interest?
Hong Kong’s Securities Association Tips Authorities On Crypto Self-Regulation
Coinbase cbBTC Set to go Live on Solana
-

 Market17 hours ago
This is Why MoonPay Shattered Solana Transaction Records
-

 Ethereum14 hours ago
Fundraising platform JustGiving accepts over 60 cryptocurrencies including Bitcoin, Ethereum
-
 Regulation21 hours ago
US SEC Pushes Timeline For Franklin Templeton Crypto Index ETF
-
 Market21 hours ago
RENDER Price Soars 48%, But Whale Activity Declines
-
 Regulation20 hours ago
BitClave Investors Get $4.6M Back In US SEC Settlement Distribution
-

 Market20 hours ago
Nvidia Q3 Revenue Soars 95% to $35.1B, Beats Estimates
-

 Market19 hours ago
Dogecoin (DOGE) Price Momentum Weakens Despite Rally
-

 Altcoin19 hours ago
Crypto Analyst Says Dogecoin Price Has Entered Parabolic Surge To $23.36. Here Are The Reasons Why