
Ethereum
Ethereum Price Breaks Out Of Symmetrical Triangle, Next Stop $3,400?

The Ethereum price has just broken out of a key symmetrical triangle pattern, signaling a potential surge to new levels above $3,000. The recent breakout is seen as a bullish indicator for the top altcoin by analysts who have closely watched the Ethereum price action for the past few months.
Ethereum Price Breaks Out Of Key Triangle Pattern
A popular crypto analyst identified as “TheMoonCarl” on X (formerly Twitter) has disclosed that the Ethereum price has finally broken out from its symmetrical triangle pattern. Sharing a chart illustration of the distinctive technical pattern, the analyst revealed to his 1.3 million followers that the symmetrical triangle pattern had begun forming in August 2024, extending through September and October to potentially reach a peak around December.
Related Reading
However, before Ethereum could reach this designated endpoint, its price broke through the upper trendline of the triangle, indicating a potential bullish breakout to new highs. A symmetrical triangle is a key technical pattern that often indicates a period of consolidation followed by a breakout to the downside or upside.
In Ethereum’s case, its price has been on a major consolidation trend, failing to experience similar price surges seen in Bitcoin and other altcoins. With the now broken triangle pattern, TheMoonCarl is setting new bullish price targets at around $3,400 for Ethereum.
At the time of the symmetrical triangle breakout, Ethereum was trading at around $2,707. However, as of writing, the cryptocurrency has declined by 3.15%, pushing its current price to $2,629, according to CoinMarketCap. While the analyst is highly optimistic about his $3,400 Ethereum price projection, the cryptocurrency will still have to see a 29.91% increase to achieve this feat.
TH Whales Are On The Move
Amidst analysts’ bullish predictions for Ethereum and its recent breakout from a key symmetrical triangle pattern, reports have revealed that large-scale investors, typically referred to as “Whales” are now back in action.
Whale Alert, a blockchain tracker and analytics system revealed a series of substantial whale transactions involving the Ethereum token. In the last 24 hours, an Ethereum whale had moved a whopping 12,590 ETH tokens, worth approximately $33.8 million from an unknown wallet to Coinbase.
Related Reading
Additionally, in the past few hours, another Ethereum whale had transferred 8,452 ETH tokens valued at $22.4 million from an unknown wallet to Binance. Typically, when whales move coins from their private wallets to a centralized exchange, it often indicates that they may be selling off their tokens.
While a full-blown sell-off could cast a shadow on Ethereum’s already slow price momentum, it appears that whales are not only moving ETH to exchanges but also potentially accumulating tokens. Whale Alert has reported that an anonymous whale recently moved 8,811 ETH from Binance to an unknown wallet.
These multiple transactions create uncertainty about whether whales are selling more than they are buying. However, with Ethereum’s recent breakout from its symmetrical triangle pattern, bullish momentum could push prices higher, potentially encouraging more buying activity.
Featured image created with Dall.E, chart from Tradingview.com


Reason to trust
![]()
Strict editorial policy that focuses on accuracy, relevance, and impartiality
Created by industry experts and meticulously reviewed
The highest standards in reporting and publishing
Strict editorial policy that focuses on accuracy, relevance, and impartiality
Morbi pretium leo et nisl aliquam mollis. Quisque arcu lorem, ultricies quis pellentesque nec, ullamcorper eu odio.
Crypto analyst Klejdi has indicated that Ethereum’s pain is far from over, with the second-largest crypto by market cap set to suffer a further downtrend. Specifically, he warned that ETH could still drop to as low as $1,400 before it finds a bottom.
Ethereum May Still Drop To As Low As $1,400
In a TradingView post, Kledji stated that Ethereum may drop to $1,400, providing a bearish outlook for the altcoin, which has underperformed other top cryptocurrencies. The analyst noted that ETH lost nearly 12% of its value within just three days after breaking out of its recent pattern last Friday.
Related Reading
He further mentioned that Ethereum’s movement and the rest of the crypto market are closely tied to Bitcoin. As such, this ETH crash is likely to happen, seeing as the flagship crypto has dropped to $81,300 and is already showing signs of further decline.
Klejdi highlighted in his accompanying chart that ETH will likely consolidate near its current level before continuing to move lower. However, the chart showed that the move to this $1,400 target will likely happen this month.
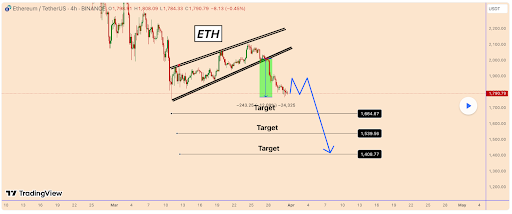
In the meantime, the analyst believes it would be wise to wait for Ethereum’s price to form another bearish pattern before entering a trade. He again reaffirmed that there is a strong possibility that ETH may extend its drop to $1,400.
Ethereum whales are already capitulating ahead of this projected price crash. Onchain analytics platform Lookonchain revealed an ETH OG that has sold off all its holdings. This investor bought 5,0001 ETH while trading at $277 in 2017 and didn’t sell when the altcoin hit its ATH during the last bull run. The whale started selling last month, possibly giving up on Ethereum making a comeback anytime soon.
ETH Will Still Reach New Highs
Crypto analyst Virtual Bacon is still confident that Ethereum will reach new highs. He noted that ETH is back at its key bear market breakout zone, retesting the $1,700 and $2,100 range. He predicts that the altcoin will continue to chop around this range in the short term. However, he remarked that Ethereum tends to catch up fast once the US Federal Reserve pivots and global liquidity turns.
Related Reading
Crypto analyst Crypto Patel affirmed that Ethereum’s biggest run is coming. He stated that Q2 to Q4 of this year will be life-changing for ETH. The analyst added that this could be the cycle top window and advised market participants not to miss it. Crypto Patel advised that they should accumulate between $1,900 and $1,300 with the target of between $7,000 and $10,000 in mind.
At the time of writing, the Ethereum price is trading at around $1,850, up in the last 24 hours, according to data from CoinMarketCap.
Featured image from iStock, chart from Tradingview.com

Reason to trust
![]()
Strict editorial policy that focuses on accuracy, relevance, and impartiality
Created by industry experts and meticulously reviewed
The highest standards in reporting and publishing
Strict editorial policy that focuses on accuracy, relevance, and impartiality
Morbi pretium leo et nisl aliquam mollis. Quisque arcu lorem, ultricies quis pellentesque nec, ullamcorper eu odio.
Ethereum continues to face strong headwinds as it trades below the $1,900 mark, with bullish momentum fading and market sentiment growing increasingly fearful. After a brief attempt to stabilize, ETH has resumed its downward trajectory, now down over 35% since late February. Price action remains weak, and investors are bracing for more potential downside as selling pressure shows no sign of easing.
Related Reading
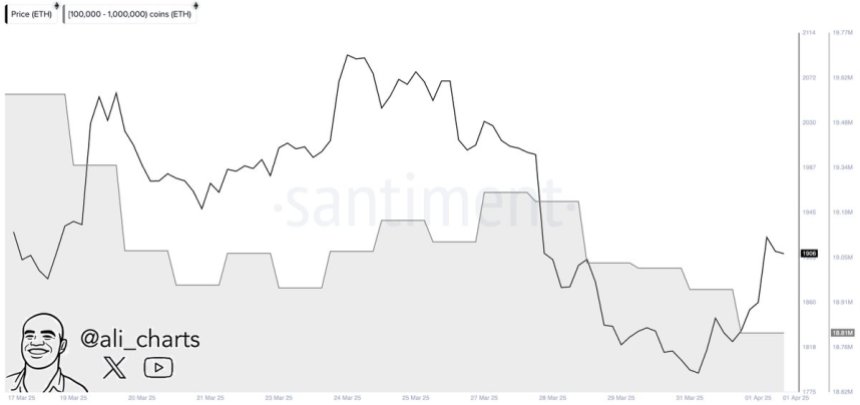
Contributing to the bearish outlook, on-chain data from Santiment reveals that whales have offloaded approximately 760,000 ETH in just the past two weeks. This significant sell-off by large holders adds weight to the growing concerns that the market may be entering a deeper correction phase. When whales exit in size, it often reflects declining confidence and triggers a wave of additional selling from smaller investors.
With macroeconomic uncertainty still shaking financial markets and Ethereum’s key support levels under threat, the outlook for ETH remains fragile. Bulls must act fast to reclaim momentum and prevent a slide into lower demand zones. Until then, the combination of fading demand, technical weakness, and aggressive whale selling continues to cloud Ethereum’s near-term path, leaving traders on edge as the next move unfolds.
Ethereum Whale Selling Grows and Market Confidence Fades
Ethereum continues to show signs of sustained selling pressure, and the broader market is starting to accept that the current downtrend may persist. With ETH trading well below key resistance levels and struggling to hold above $1,900, confidence among traders and investors is weakening. Macroeconomic uncertainty, fueled by rising global tensions, unstable interest rate expectations, and unpredictable policy moves, has shaken financial markets. High-risk assets like Ethereum are taking the hardest hits, with volatility amplifying every move.
Despite the weakness, there’s still a glimmer of optimism across the market. Some investors believe Ethereum could mount an aggressive recovery, especially if broader conditions stabilize or if ETH finds strong support around current levels. However, that optimism is starting to fade in the face of poor price action and concerning on-chain data.
Top analyst Ali Martinez shared insights on X, revealing that whales have sold approximately 760,000 ETH over the past two weeks. This significant offloading by large holders adds to the ongoing bearish pressure and suggests that confidence among big players is declining. Whale movements are closely watched, as they often precede or confirm broader market trends.
Still, markets are dynamic, and this trend could shift quickly. If Ethereum can hold key support zones and macroeconomic conditions begin to calm, the same large players currently selling may reenter the market in anticipation of the next rally. For now, though, Ethereum remains in a fragile state, with continued selling and cautious sentiment likely to dominate the short-term outlook. Bulls must step in soon to shift the trend — or risk watching ETH slide further in the weeks ahead.
Related Reading
Bulls Struggle to Reclaim Key Levels
Ethereum is currently trading at $1,880 after several days of weak price action, caught in a tight range between $2,000 resistance and $1,750 support. Despite multiple attempts, bulls have failed to reclaim the critical $2,000–$2,200 zone — a level that would signal strength and potentially mark the beginning of a broader recovery phase. Instead, ETH remains trapped in a downtrend, with momentum continuing to favor the bears.
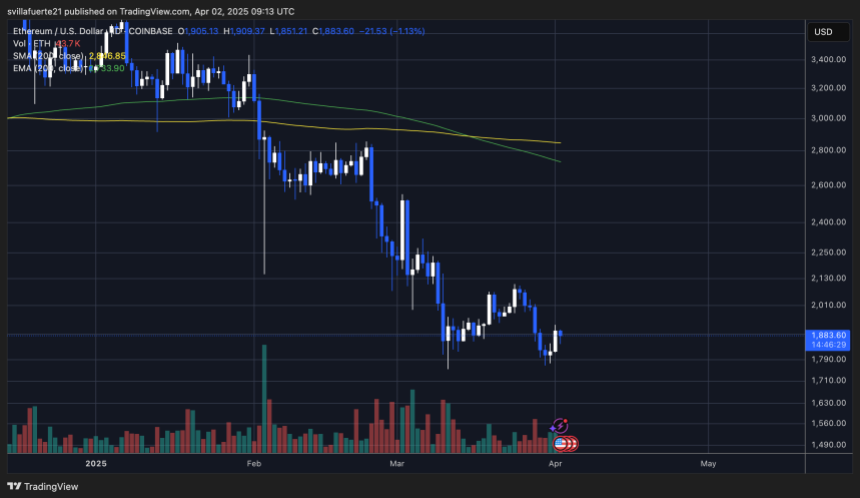
The inability to push higher is putting bulls in a vulnerable position. With Ethereum now hovering just below the $1,900 level, the coming days are crucial. If ETH fails to hold above this mark and cannot break back above $2,000 with conviction, a sharp drop is likely. Such a move could lead to a retest of the lower $1,700s or even deeper, especially if broader market sentiment remains negative.
Related Reading
As macroeconomic instability and market uncertainty persist, investors are growing cautious, and risk appetite continues to fade. For Ethereum to avoid a deeper selloff, bulls must step in quickly, reclaim lost ground, and reestablish confidence above the $2,000 level. Until then, the path of least resistance appears to remain to the downside.
Featured image from Dall-E, chart from TradingView


Ethereum co-founder Vitalik Buterin has again made the news with a big donation to a Swiss project called Zuitzerland. Isla, a Web3 researcher developing the project, received the 274 ETH, equivalent to around $500,000, from Buterin, according to reports. The donation was identified by Onchain Lens, a blockchain monitoring site that tracks fund transfers.
This step is not surprising to anyone who has known about Buterin’s charitable activities and experimental associations. Zuitzerland is said to be a product of Buterin’s previous Zuzalu experiment, whose purpose was to unite like-minded people and engage into proposals on technology, longevity, and decentralized regimes.
Ethereum Donation: What Is Zuitzerland?
The Zuitzerland initiative is based on the ideas launched in the Zuzalu experiment, a short-term community project initiated by Buterin between March and May 2023, in Montenegro. Zuzalu assembled about 200 participants who worked and lived together for two months. They exchanged ideas and teamed up on projects together in workshops, discussions, and social gatherings.
Just in: Vitalik (@VitalikButerin) has sent 274.1 $ETH ($500k), as a grant or donation to a contract deployed by @0xisla, who is building @zuitzerland.
Vitalik’s Address: 0xd8da6bf26964af9d7eed9e03e53415d37aa96045
Contract Address: 0x69649512c97c630c4f06a21e09e71f0362ca74ec… pic.twitter.com/NusZDSp7tn
— Onchain Lens (@OnchainLens) April 1, 2025
Zuitzerland pushes this concept further by hosting residencies, hackathons, and citywide events for those with common interests. The platform emphasizes the development of collaboration between “thinkers and builders.” Although Buterin is not among the founders of the project, he is mentioned as a speaker and curator on its official site, indicating his support and engagement.

Funding Through Token Sales
Buterin’s contribution was partly financed by selling tokens he had earlier received as gifts from other crypto projects. According to on-chain statistics, Buterin sold 5,000 Dohrnii (DHN) tokens for $93,882 and 2 trillion LEDOG (DOG) tokens for $16,569 on March 31, 2025. The proceeds from these sales were aggregated and then sent as 274 ETH to Isla.
ETHUSD trading at $1,873 on the daily chart: TradingView.com
This is not the first time that Buterin has sold tokens gifted to him for a cause. In 2022, he sold some Shiba Inu (SHIB) tokens gifted to him in order to donate to an Indian COVID-19 relief fund. Buterin has also publicly urged token issuers to give directly to charities instead of donating tokens to him.
A History Of Token Donations
Dohrnii Labs, the developers of the DHN token, had sent 10,000 tokens to Buterin in January 2025. Likewise, LEDOG’s developers sent 10 trillion DOG tokens to him in August 2024. Although these tokens are usually given as a token of appreciation, they are also a marketing strategy for visibility. Buterin has been selling these tokens gradually over time, using the funds for donations and other things.
As of now, Buterin still retains 2 trillion DOG tokens, as per data on the blockchain. Nevertheless, his actions reveal a distinct orientation towards leveraging such assets to help initiatives such as Zuitzerland, which align with his belief in decentralized governance and innovation led by community.
Featured image from Gemini Imagen, chart from TradingView
Editorial Process for bitcoinist is centered on delivering thoroughly researched, accurate, and unbiased content. We uphold strict sourcing standards, and each page undergoes diligent review by our team of top technology experts and seasoned editors. This process ensures the integrity, relevance, and value of our content for our readers.

Binance Sidelines Pi Network Again In Vote To List Initiative, Here’s All

XRP Price Reversal Toward $3.5 In The Works With Short And Long-Term Targets Revealed

First Digital Trust Denies Justin Sun’s Allegations, Claims Full Solvency

Will Cardano Price Bounce Back to $0.70 or Crash to $0.60?

Why A Massive Drop To $1,400 Could Rock The Underperformer

How Will Elon Musk Leaving DOGE Impact Dogecoin Price?

2.52 Million Altcoins Are Ruining Crypto’s Future

Animoca Brands Valuation Tanks 75% In Two Years, Here’s Why

Crypto exchange BingX hacked for $43 million

Are The Big Players Losing Interest?

Hong Kong’s Securities Association Tips Authorities On Crypto Self-Regulation

Coinbase cbBTC Set to go Live on Solana
2.52 Million Altcoins Are Ruining Crypto’s Future
Animoca Brands Valuation Tanks 75% In Two Years, Here’s Why
Crypto exchange BingX hacked for $43 million
Are The Big Players Losing Interest?
Hong Kong’s Securities Association Tips Authorities On Crypto Self-Regulation
Coinbase cbBTC Set to go Live on Solana
-

 Market23 hours ago
Bitcoin Price Bounces Back—Can It Finally Break Resistance?
-

 Market18 hours ago
BNB Price Faces More Downside—Can Bulls Step In?
-

 Regulation13 hours ago
Kraken Obtains Restricted Dealer Registration in Canada
-

 Market20 hours ago
XRP Recovery Stalls—Are Bears Still In Control?
-
 Altcoin20 hours ago
Pi Network Faces Community Backlash, Is Pi Coin Price Heading to Zero?
-

 Market19 hours ago
VanEck Sets Stage for BNB ETF with Official Trust Filing
-

 Altcoin23 hours ago
Tether Expands Bitcoin Reserves with 8,888 BTC Buy—What’s the Plan?
-

 Market22 hours ago
Ethereum Price Approaches Resistance—Will It Smash Through?