
Market
Aptos (APT) Price Set to Climb, but Momentum is Weakening

The Aptos (APT) price has surged by 24% over the last seven days, raising questions about whether this uptrend can be sustained. While recent gains have been impressive, the technical indicators are starting to show mixed signals.
Whether APT can push higher or face a correction will depend on how these trends unfold in the coming days.
APT RSI Is Far From Overbought
Aptos (APT) RSI is currently at 53.75, dropping from 76 just four days ago. This decline suggests a reduction in buying pressure compared to recent peaks, signaling a potential cooling period in market activity. However, the current RSI level still shows a neutral to mildly bullish outlook.
RSI, or Relative Strength Index, is a momentum indicator that measures the speed and change of price movements. It ranges from 0 to 100, with values above 70 indicating overbought conditions and below 30 suggesting oversold conditions. An RSI around 50 reflects a balanced state, where buying and selling pressures are nearly equal.
Read more: Aptos (APT) Price Prediction 2024/2025/2030
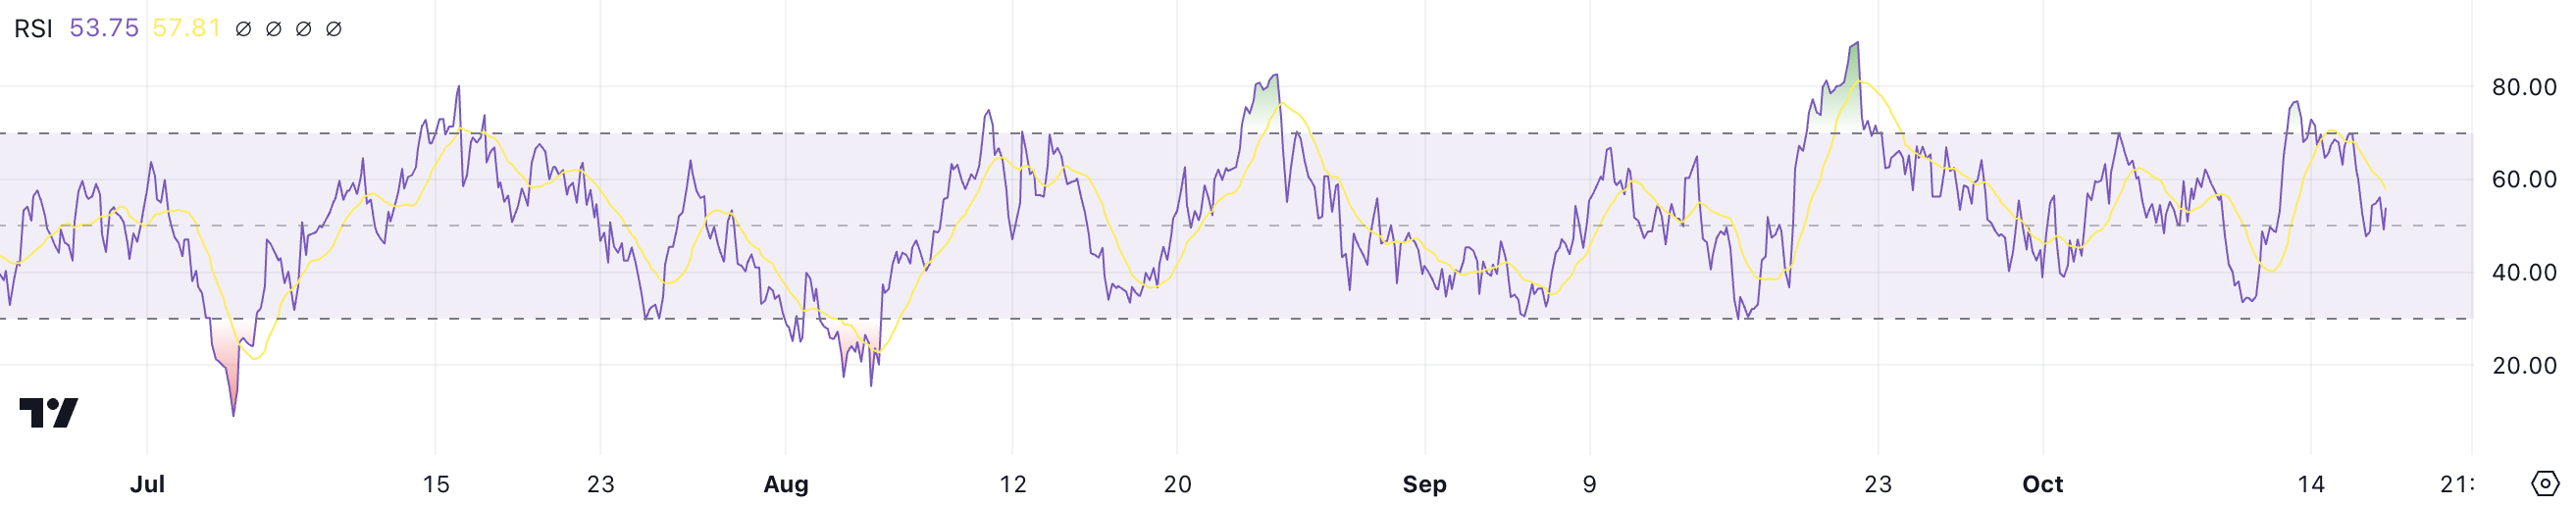
APT’s RSI at 53.75 points to a market that is not yet overextended despite recent gains, which saw APT price rise by 24% in just one week. This level suggests that the uptrend may still have room to grow as the RSI remains below the overbought threshold of 70.
If bullish momentum resumes, APT’s price could continue climbing, potentially pushing the RSI higher without immediately risking a reversal. This positioning allows for further growth before reaching a level that typically signals caution.
Ichimoku Cloud Shows Aptos Surge Could Be Over For Now
The Ichimoku Cloud chart for Aptos suggests a generally bullish trend, as indicated by price levels currently trading above the green cloud (kumo). This configuration implies that market sentiment is positive and buyers are in control. The cloud acts as a support zone, and with prices above it, APT is demonstrating resilience and strength in its recent price action.
Additionally, the leading span A (green) is above leading span B (red), which reinforces the bullish sentiment and points to potential support in the event of any short-term price dips.
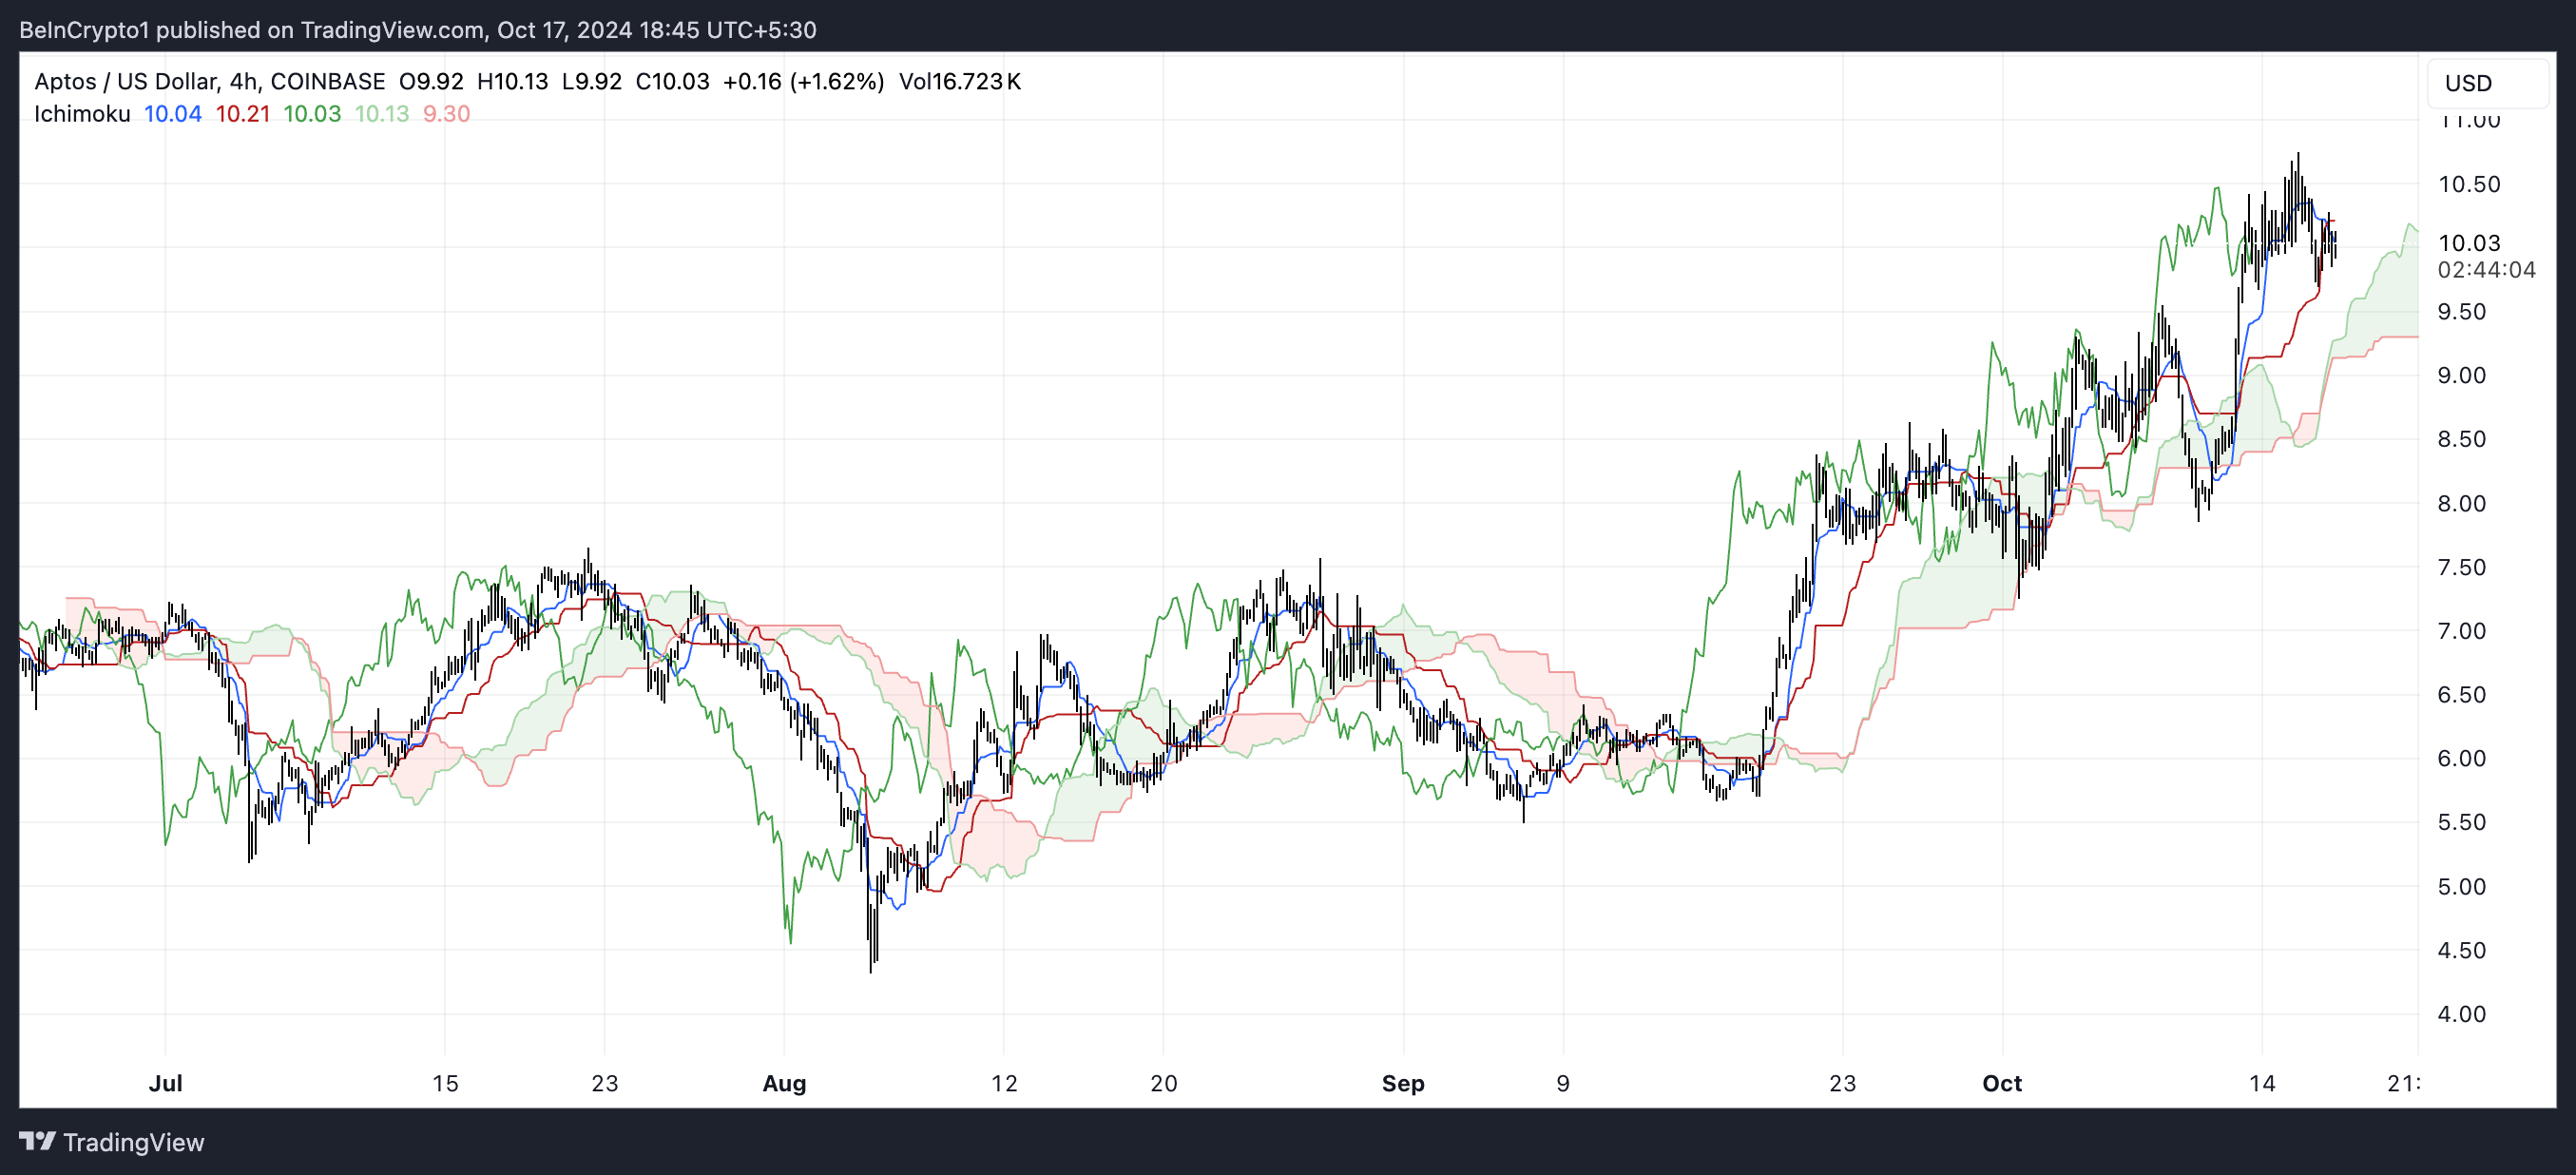
The Tenkan-sen (blue line) and Kijun-sen (red line) are also showing mixed signals. While the Tenkan-sen remains slightly above the Kijun-sen, indicating that the momentum is still bullish, their recent convergence suggests a loss of momentum. If the Tenkan-sen crosses below the Kijun-sen, it could signal a potential trend reversal or at least a weakening of the current uptrend.
Additionally, the green Chikou span (lagging line) is above the price, which supports a continued bullish outlook, but traders should watch for any changes that could signal a pullback. Overall, the Ichimoku chart signals that APT remains in a bullish position, but the narrowing gap between key lines indicates that momentum could be wavering.
APT Price Prediction: The Coin Can Surge 76% If This Happens
APT EMA lines are currently bullish, with short-term lines positioned above long-term ones. However, the distance between these lines has significantly narrowed, indicating that bullish momentum might be weakening. When the gap between short-term and long-term EMAs shrinks, it often signals that the trend could be losing strength and might soon reverse.
EMA lines, or Exponential Moving Averages, help identify the direction and momentum of price trends by giving more weight to recent data points. In APT’s case, the current EMA setup reflects an ongoing uptrend, but the diminishing separation suggests that the market’s strength may be faltering.
Read more: 5 Best Aptos (APT) Wallets in 2024
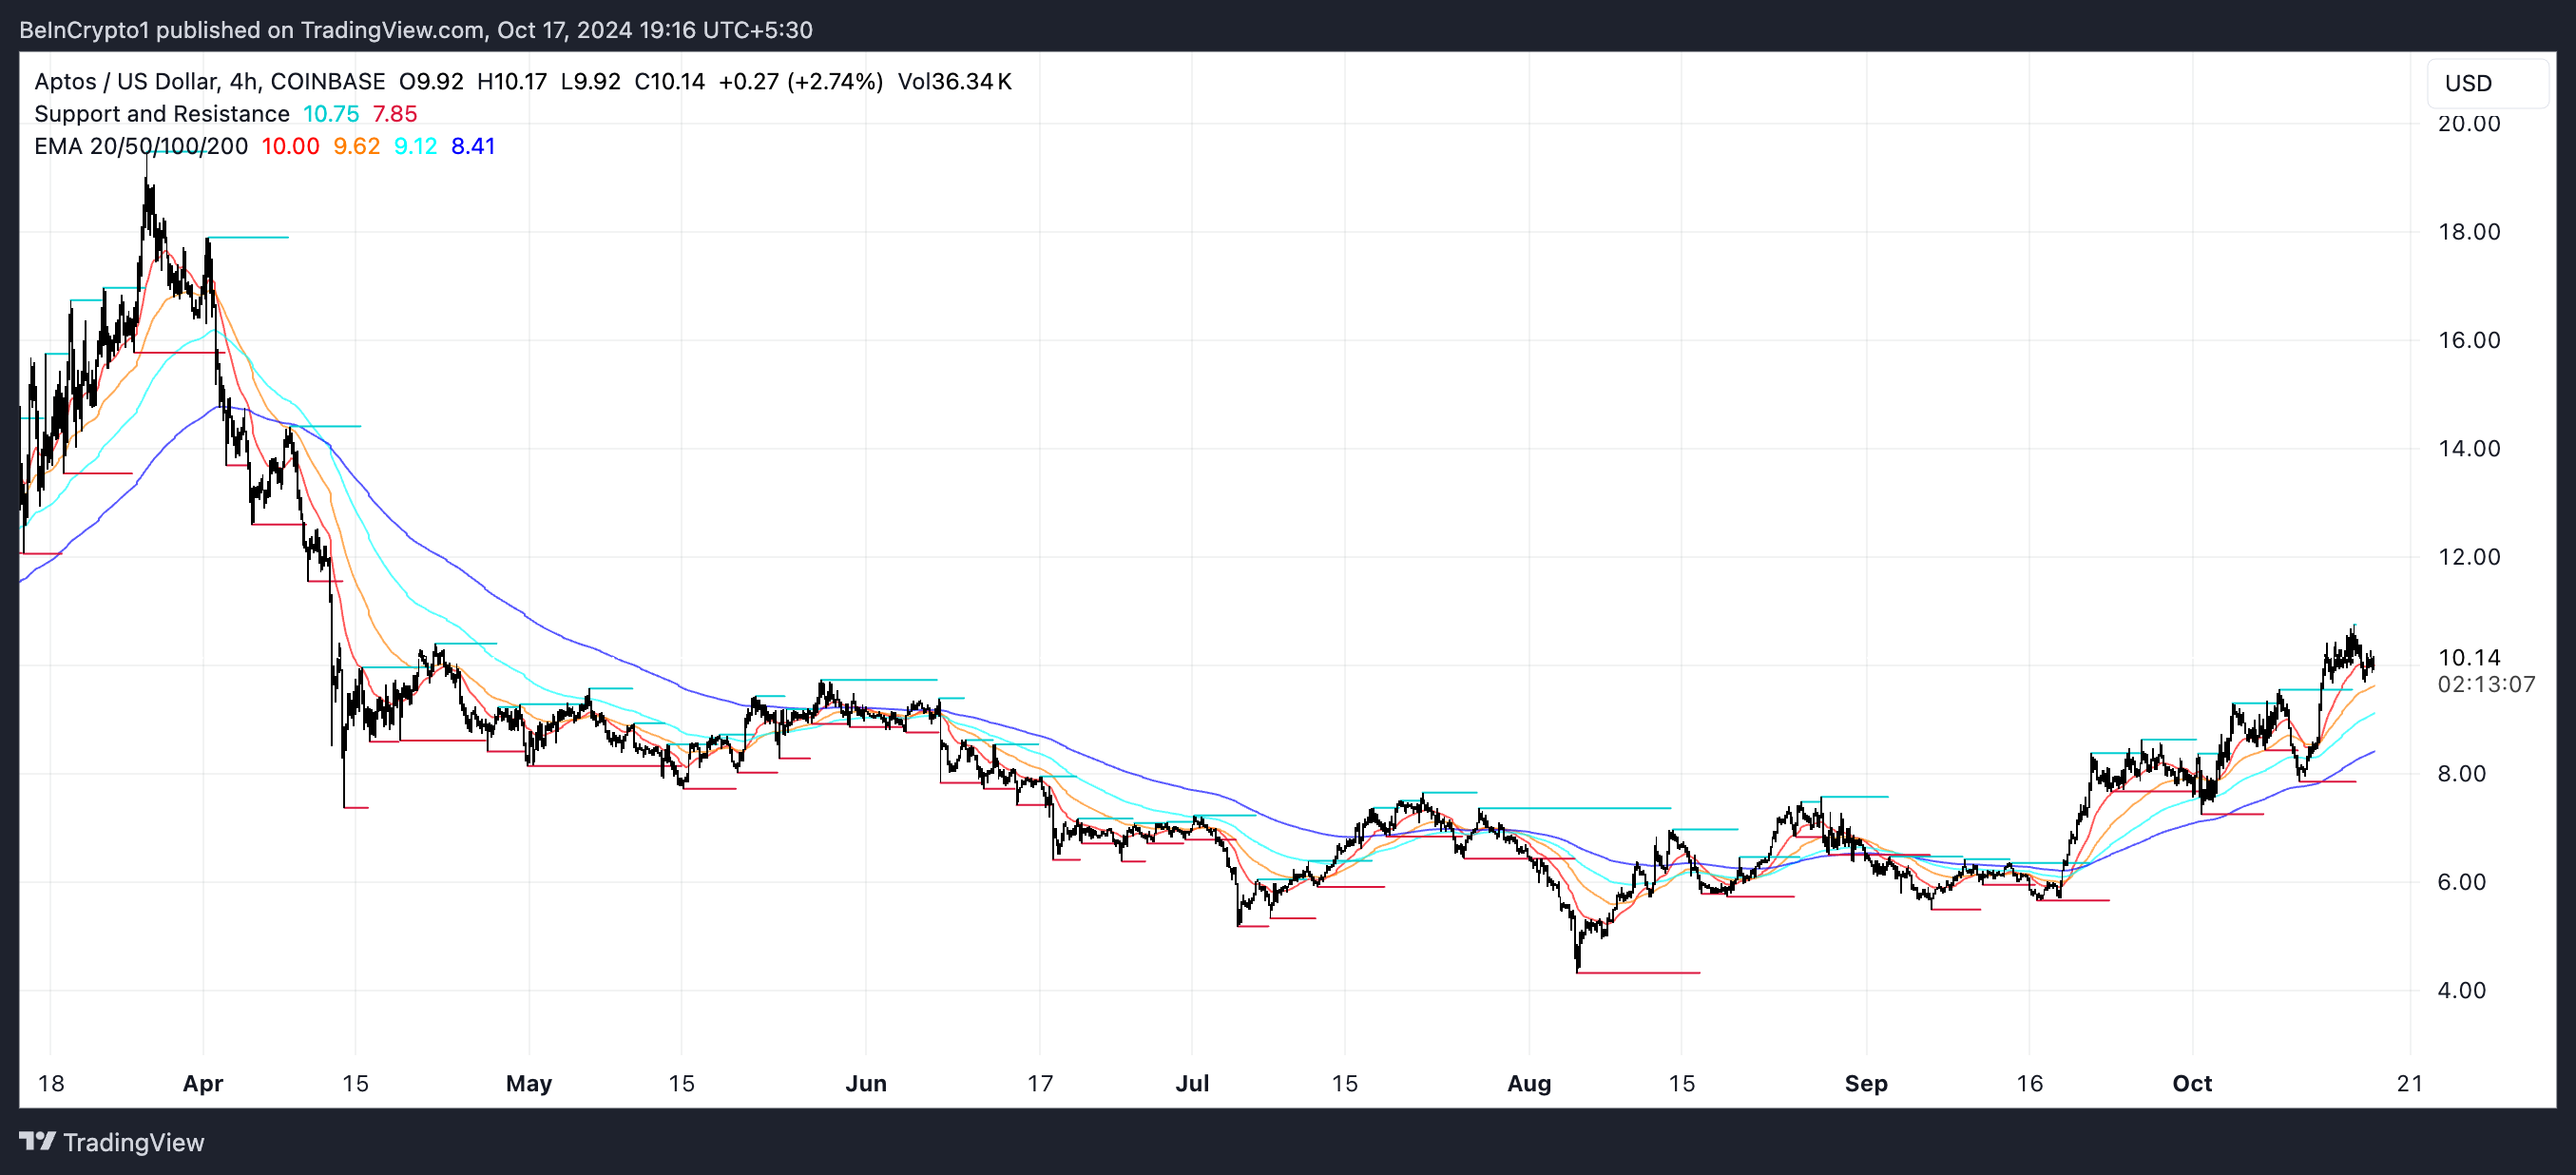
If the current uptrend holds, APT could surge to $14.42, and breaking that resistance might propel the price to $17.89 — its highest level since April 1. Such a move would represent a 76% gain for APT price, showing the bullish potential if momentum remains strong.
However, as indicated by both the Ichimoku Cloud and EMA lines, the uptrend could be getting weaker. If the trend reverses, APT price might test support levels at $8.45 or even fall to $7.86.
Disclaimer
In line with the Trust Project guidelines, this price analysis article is for informational purposes only and should not be considered financial or investment advice. BeInCrypto is committed to accurate, unbiased reporting, but market conditions are subject to change without notice. Always conduct your own research and consult with a professional before making any financial decisions. Please note that our Terms and Conditions, Privacy Policy, and Disclaimers have been updated.


XRP price saw a couple of swing moves from the $2.85 resistance. The price is consolidating near $2.50 and might aim for more gains above the $2.65 level.
- XRP price is struggling to gain pace for a move above the $2.80 resistance zone.
- The price is now trading above $2.30 and the 100-hourly Simple Moving Average.
- There is a key bullish trend line forming with support at $2.25 on the hourly chart of the XRP/USD pair (data source from Kraken).
- The pair might continue to accelerate if it clears the $2.72 resistance.
XRP Price Holds Gains Above $2.30
XRP price made another attempt to clear the $3.00 resistance. However, it failed to surpass $2.85 and corrected some gains unlike Bitcoin and like Ethereum. There was a move below the $2.65 and $2.50 levels.
A low was formed at $2.276 and the price is now correcting losses. There was a move above the $2.40 and $2.50 levels. The bulls pushed it back above the 50% Fib retracement level of the recent decline from the $2.848 swing high to the $2.276 low.
The price is now trading above $2.30 and the 100-hourly Simple Moving Average. There is also a key bullish trend line forming with support at $2.25 on the hourly chart of the XRP/USD pair.
On the upside, the price might face resistance near the $2.620 level. The first major resistance is near the $2.720 level. It is close to the 76.4% Fib retracement level of the recent decline from the $2.848 swing high to the $2.276 low.

The next key resistance could be $2.850. A clear move above the $2.850 resistance might send the price toward the $2.950 resistance. Any more gains might send the price toward the $3.00 resistance or even $3.150 in the near term. The next major hurdle for the bulls might be $3.20.
Are Dips Limited?
If XRP fails to clear the $2.620 resistance zone, it could start another decline. Initial support on the downside is near the $2.50 level. The next major support is near the $2.40 level.
If there is a downside break and a close below the $2.40 level, the price might continue to decline toward the $2.30 support and the trend line. The next major support sits near the $2.050 zone.
Technical Indicators
Hourly MACD – The MACD for XRP/USD is now losing pace in the bullish zone.
Hourly RSI (Relative Strength Index) – The RSI for XRP/USD is now below the 50 level.
Major Support Levels – $2.5000 and $2.4000.
Major Resistance Levels – $2.6200 and $2.7200.

Cardano (ADA) whales, who have been instrumental in driving the cryptocurrency’s price by 270% in the last 30 days, have now sold a bunch of tokens. This sell-off comes ahead of this week’s token unlock, which market participants expect will cause volatility.
As of this writing, ADA trades at $1.23. Will this sell-off draw the price down further?
Cardano Key Holders Offload Some Tokens
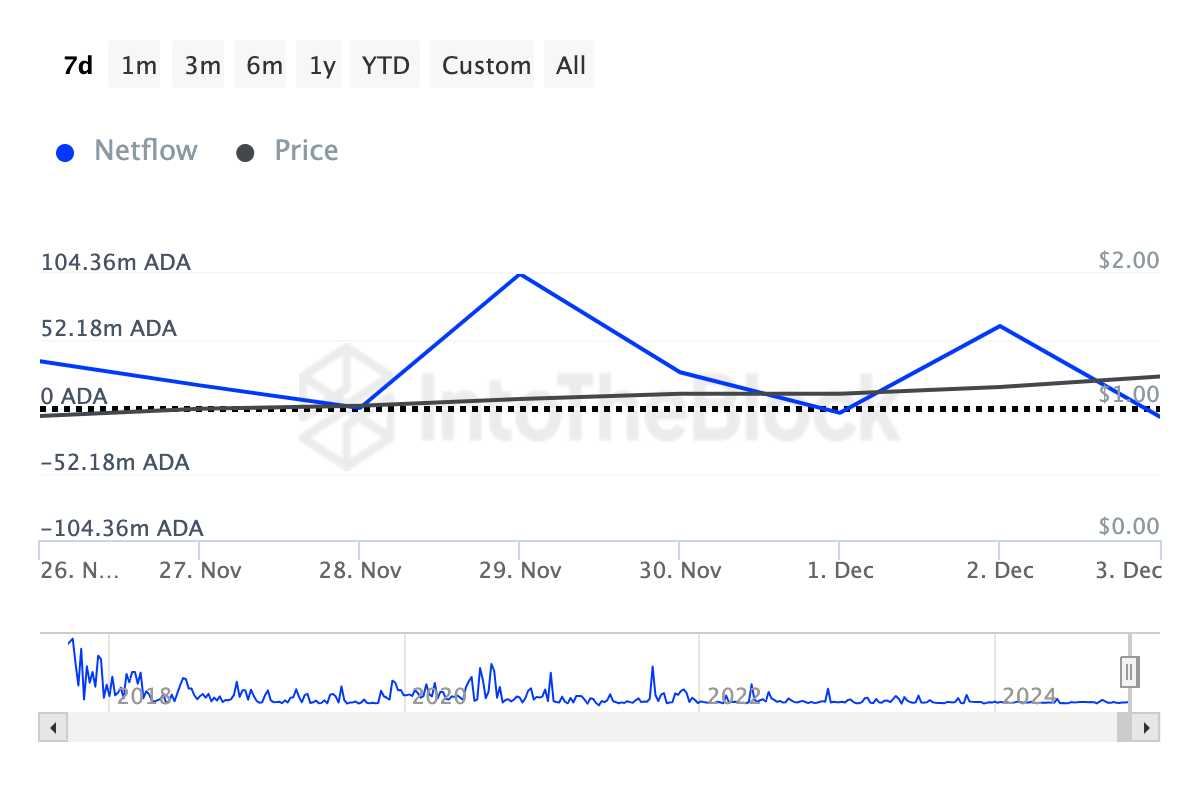
On Monday, December 2, Cardano’s large holders’ netflow reached 63.58 million ADA, reflecting a strong buying trend among whales. The netflow metric tracks the difference between tokens bought and sold by these key players. A rising netflow indicates accumulation, while a decline indicates selling pressure.
As of now, the netflow has plunged to 7.62 million ADA, according to IntoTheBlock, suggesting that whales offloaded 55.96 million ADA — either to take profits or rebalance their portfolios. At Cardano’s current price, this sell-off amounts to a staggering $69 million.
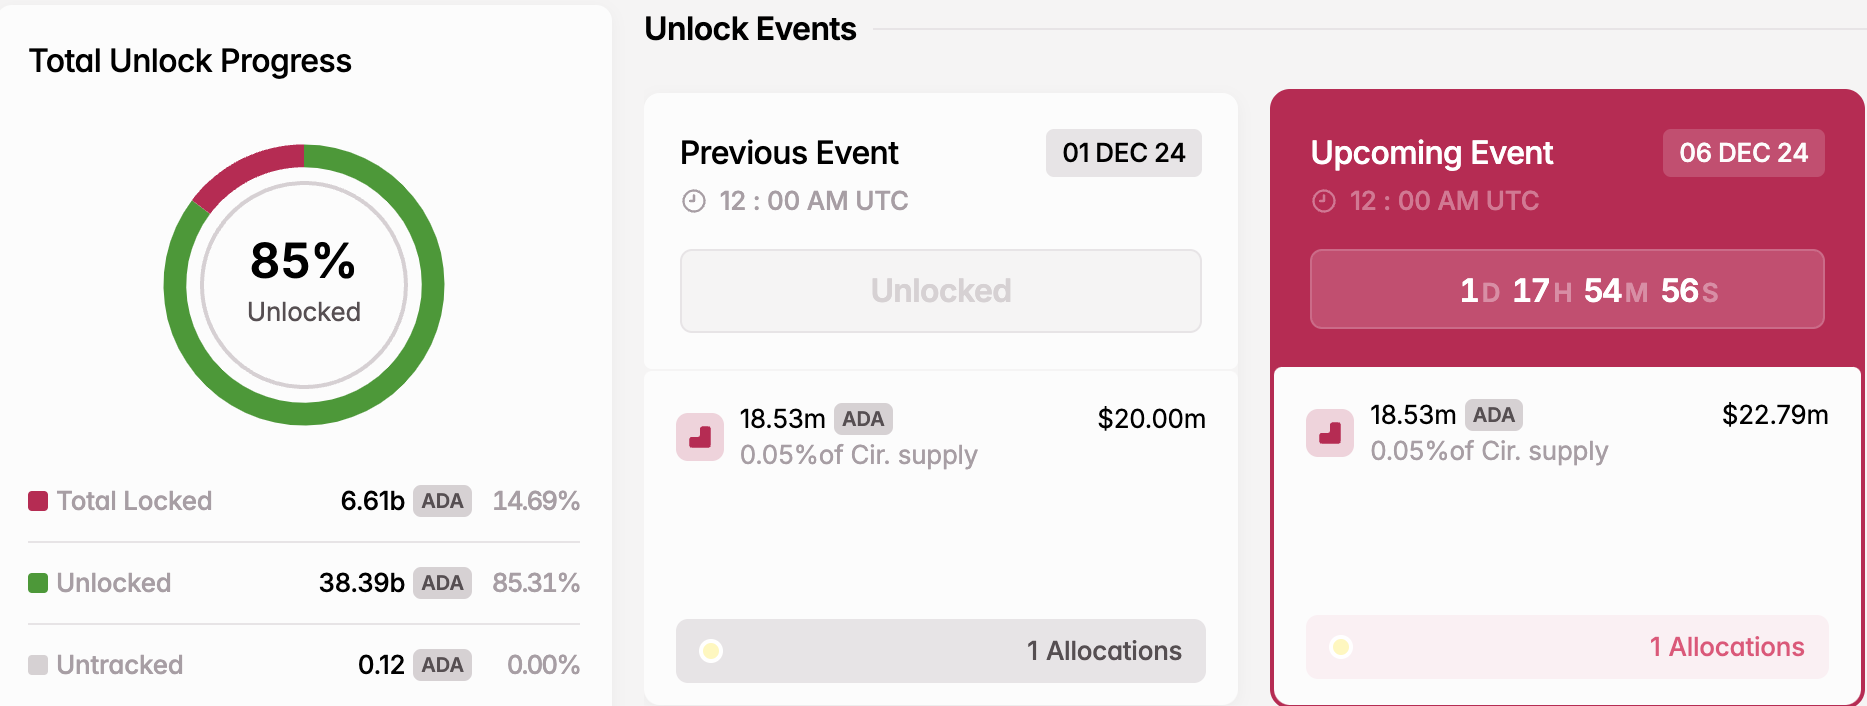
From BeInCrypto’s observation, the recent sell-off may be tied to the upcoming token unlock on December 6.
Token unlocks, which release previously restricted tokens into circulation, often drive significant price movements by altering supply and demand dynamics.
According to Tokenomist (formerly Token Unlocks), Cardano is set to release 18.53 million ADA on that date, valued at $22.79 million. This anticipated supply shock could introduce volatility, potentially hindering the altcoin’s ability to sustain an uptrend during this period.
ADA Price Prediction: Overbought, Retracement Likely
On the daily chart, Cardano’s Bollinger Bands (BB) have widened, indicating heightened volatility. The BB also highlights whether an asset is overbought or oversold.
When the price touches the upper band, it signals an overbought condition, while contact with the lower band indicates oversold territory. Therefore, the image below confirms the thesis that ADA is overbought.
The Relative Strength Index (RSI), which measures momentum, also aligns with the bias. When the RSI reading is above 70.00, it is overbought. On the other hand, when the reading is below 30.00, it is oversold.
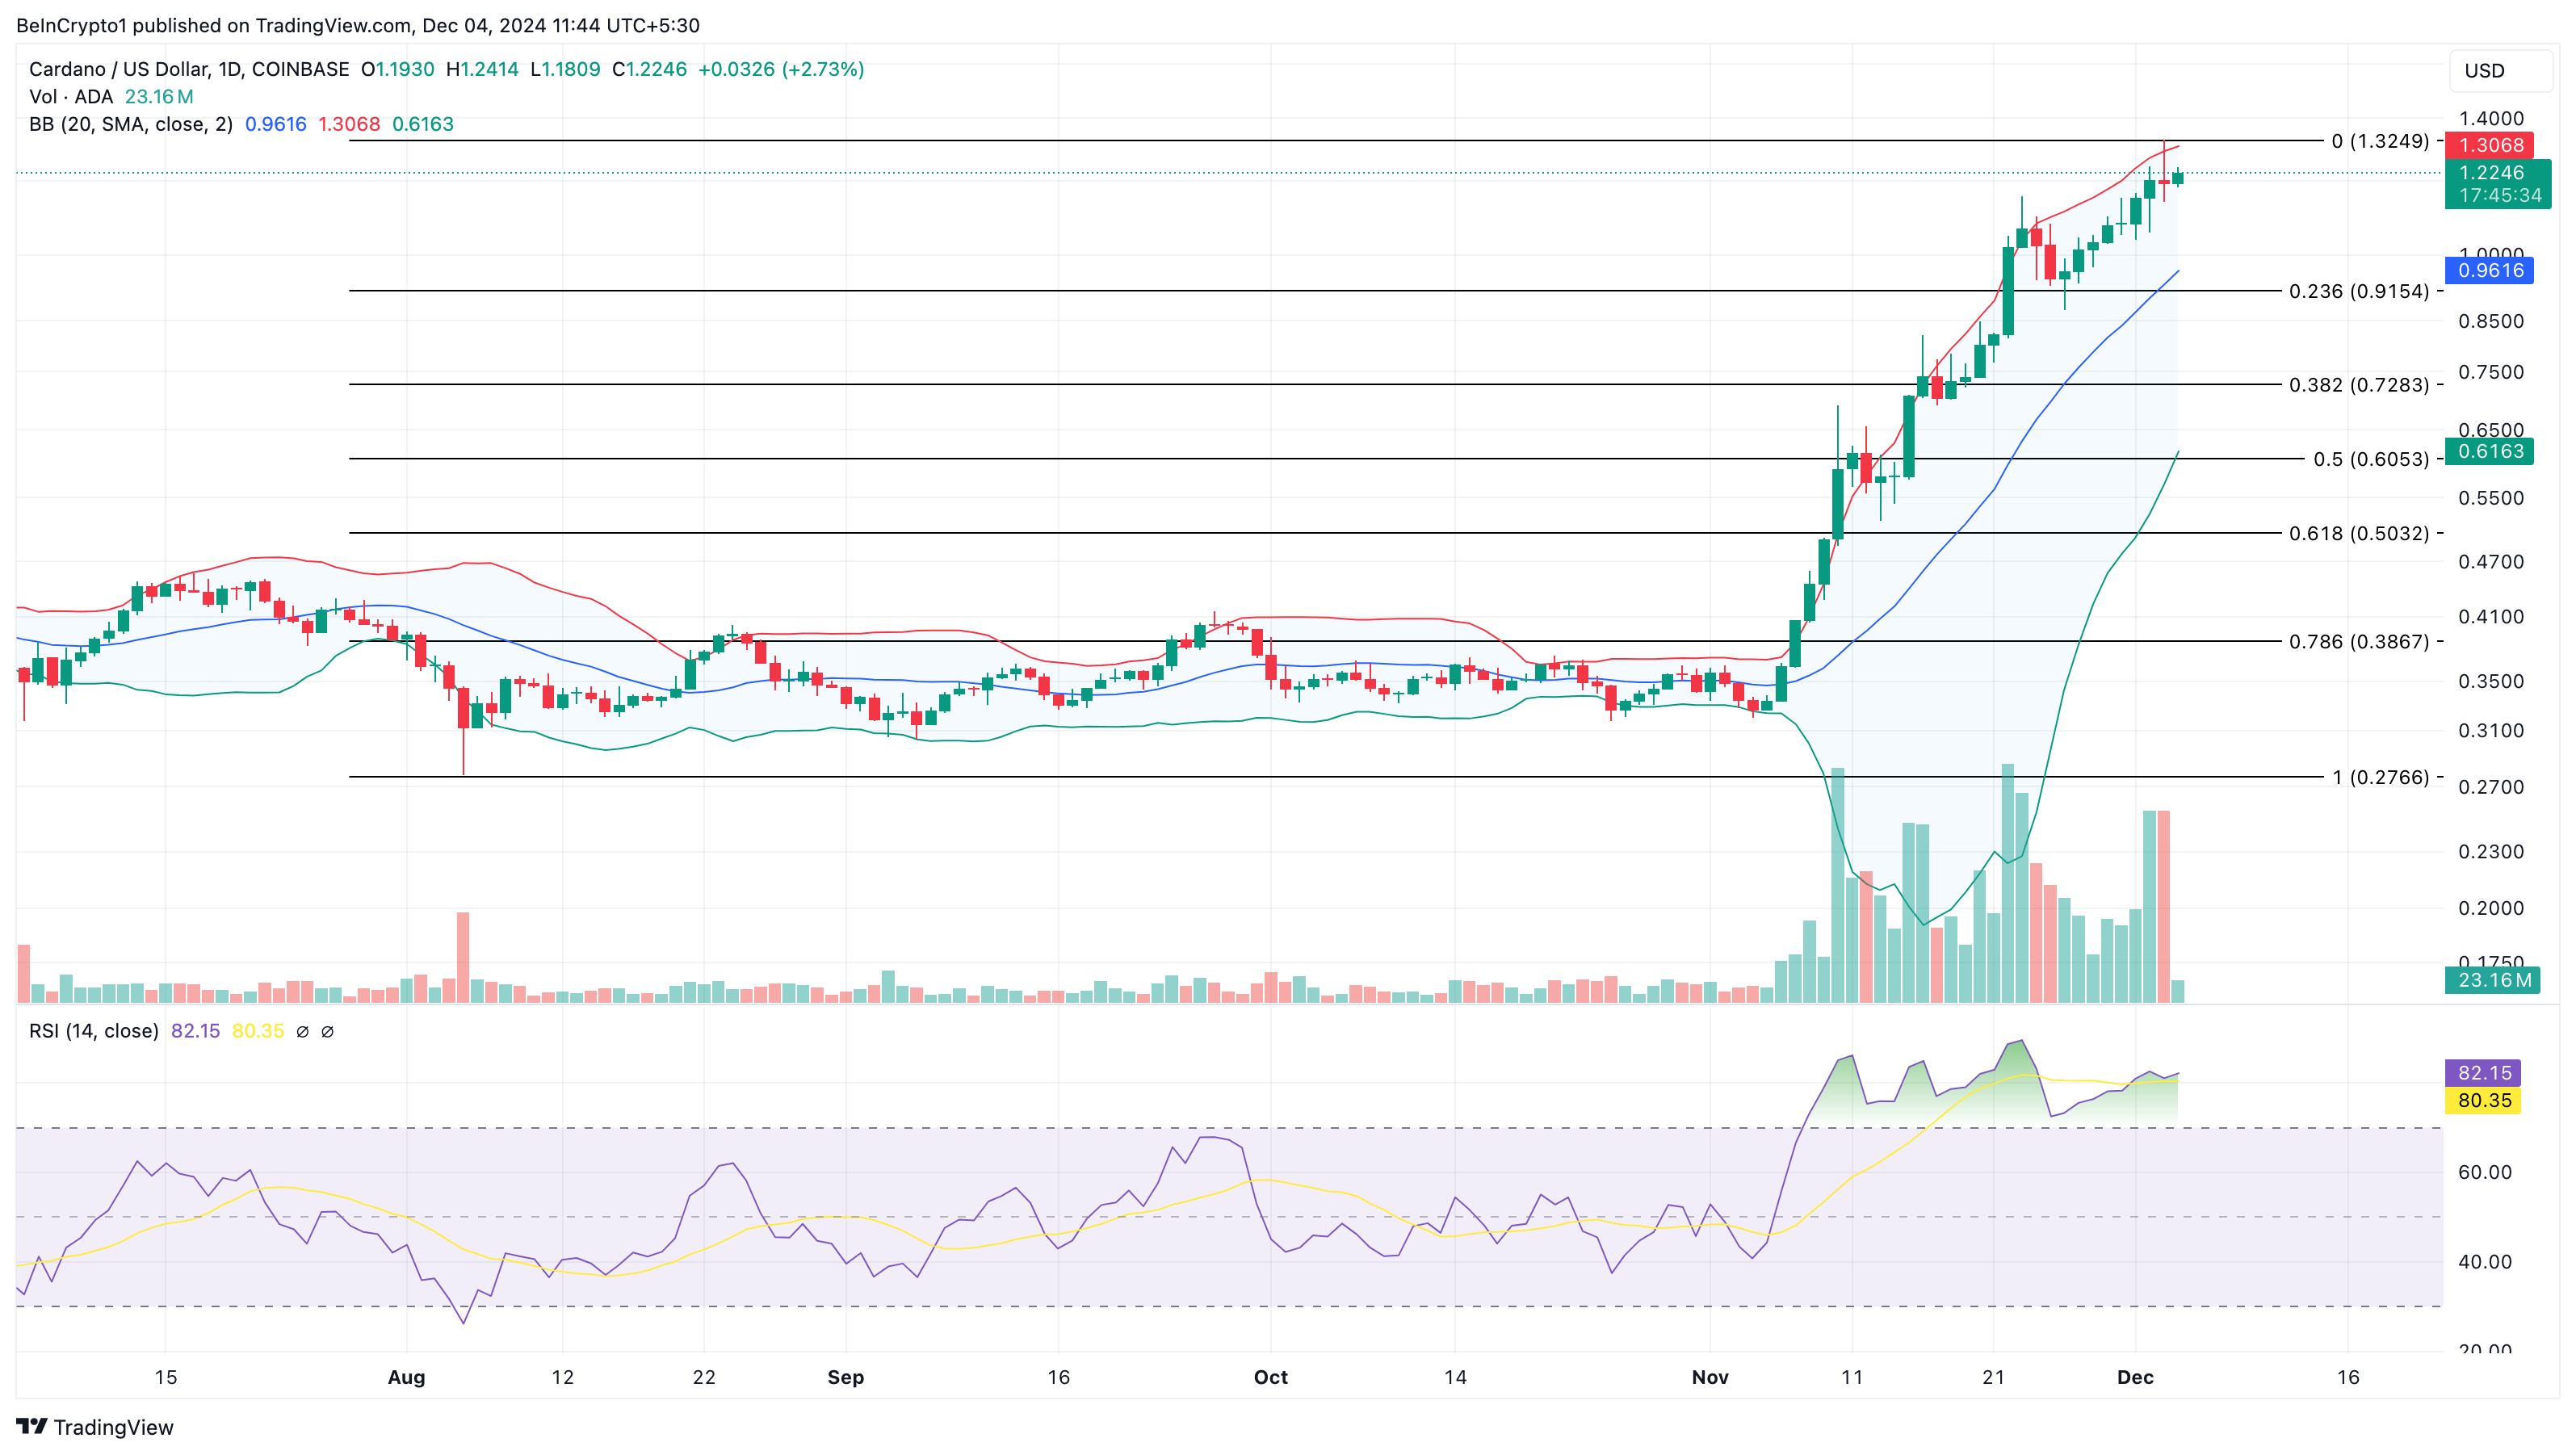
At press time, Cardano’s RSI stands at 82.15, firmly placing ADA in overbought territory. Given this condition, a price correction to $0.92 could be next. However, if Cardano whales resume accumulation, the trend could shift, potentially pushing the price above $1.33
Disclaimer
In line with the Trust Project guidelines, this price analysis article is for informational purposes only and should not be considered financial or investment advice. BeInCrypto is committed to accurate, unbiased reporting, but market conditions are subject to change without notice. Always conduct your own research and consult with a professional before making any financial decisions. Please note that our Terms and Conditions, Privacy Policy, and Disclaimers have been updated.

Solana started a fresh increase from the $215 zone. SOL price is rising and might aim for a move above the $240 and $250 resistance levels.
- SOL price started a fresh increase after it settled above the $222 level against the US Dollar.
- The price is now trading above $230 and the 100-hourly simple moving average.
- There was a break above a key bearish trend line with resistance at $232 on the hourly chart of the SOL/USD pair (data source from Kraken).
- The pair could start a fresh increase if the bulls clear the $240 zone.
Solana Price Eyes Fresh Surge
Solana price formed a support base and started a fresh increase above the $220 level like Bitcoin and Ethereum. There was a decent increase above the $225 and $230 resistance levels.
There was a move above the 50% Fib retracement level of the downward move from the $246 swing high to the $215 low. Besides, there was a break above a key bearish trend line with resistance at $232 on the hourly chart of the SOL/USD pair.
Solana is now trading above $235 and the 100-hourly simple moving average. On the upside, the price is facing resistance near the $240 level or the 76.4% Fib retracement level of the downward move from the $246 swing high to the $215 low.

The next major resistance is near the $246 level. The main resistance could be $250. A successful close above the $250 resistance level could set the pace for another steady increase. The next key resistance is $265. Any more gains might send the price toward the $280 level.
Another Decline in SOL?
If SOL fails to rise above the $240 resistance, it could start another decline. Initial support on the downside is near the $230 level or the 100-hourly simple moving average. The first major support is near the $220 level.
A break below the $220 level might send the price toward the $215 zone. If there is a close below the $215 support, the price could decline toward the $200 support in the near term.
Technical Indicators
Hourly MACD – The MACD for SOL/USD is gaining pace in the bullish zone.
Hourly Hours RSI (Relative Strength Index) – The RSI for SOL/USD is above the 50 level.
Major Support Levels – $230 and $220.
Major Resistance Levels – $240 and $250.

ETH Price to $4,000 Imminent as Ethereum ETF Inflows Surge Again

XRP Price Swings Wildly: Can It Resume Its Rally?

Pepe Coin Whales Accumulation Signals 7x Gains For PEPE Looms

Will Cardano Whales Continue to Sell Ahead of Token Unlock?

Solana (SOL) Back on Track: Is The Uptrend Here to Stay?

This Is Why DMM Bitcoin Closes After $305 Million Hack

2.52 Million Altcoins Are Ruining Crypto’s Future

Animoca Brands Valuation Tanks 75% In Two Years, Here’s Why

Crypto exchange BingX hacked for $43 million

Are The Big Players Losing Interest?

Hong Kong’s Securities Association Tips Authorities On Crypto Self-Regulation

Coinbase cbBTC Set to go Live on Solana
2.52 Million Altcoins Are Ruining Crypto’s Future
Animoca Brands Valuation Tanks 75% In Two Years, Here’s Why
Crypto exchange BingX hacked for $43 million
Are The Big Players Losing Interest?
Hong Kong’s Securities Association Tips Authorities On Crypto Self-Regulation
Coinbase cbBTC Set to go Live on Solana
-

 Regulation22 hours ago
Cambodia crackdown locks out 16 crypto exchanges
-
 Market22 hours ago
Tron (TRX) Price Hits New All-Time High Since 2018
-

 Altcoin22 hours ago
Thinking Of Selling Your Dogecoin Already? Crypto Analyst Puts Price Top In The Double-Digits
-
 Altcoin21 hours ago
Altcoin Season To Face Challenges Ahead, CryptoQuant CEO Predicts
-
 Altcoin20 hours ago
SHIB Burn Skyrockets 3400%, Shiba Inu Rally To Continue?
-
 Altcoin19 hours ago
XLM, KAIA, SAND, & These Crypto Eye Rally As Binance Expands Support
-

 Market23 hours ago
XRP Price Defies The Odds
-

 Altcoin18 hours ago
Analyst Who Correctly Called The XRP Price Jump From $1.4 To $2.8 Reveals The Rest Of The Prediction