
Market
DOGS Token Faces Major Test as 99% of Holders Are Underwater

The hype around the Telegram-linked meme coin DOGS has taken a sharp turn, as nearly 99% of its holders are now in losses just about 60 days after its listing.
Once a token of high expectations, DOGS has been hit by relentless selling pressure, leaving early investors deep underwater. With mounting concerns over its future, the meme coin now faces a crucial test. Can it recover, or is it heading towards further decline?
Interest in Telegram’s Flagship Meme Coin Plunges
DOGS, which launched on August 26 with the distribution of approximately 40 billion tokens to around 17 million Telegram users, had an initial price of $0.0017. However, since then, the meme coin has plummeted by 56%.
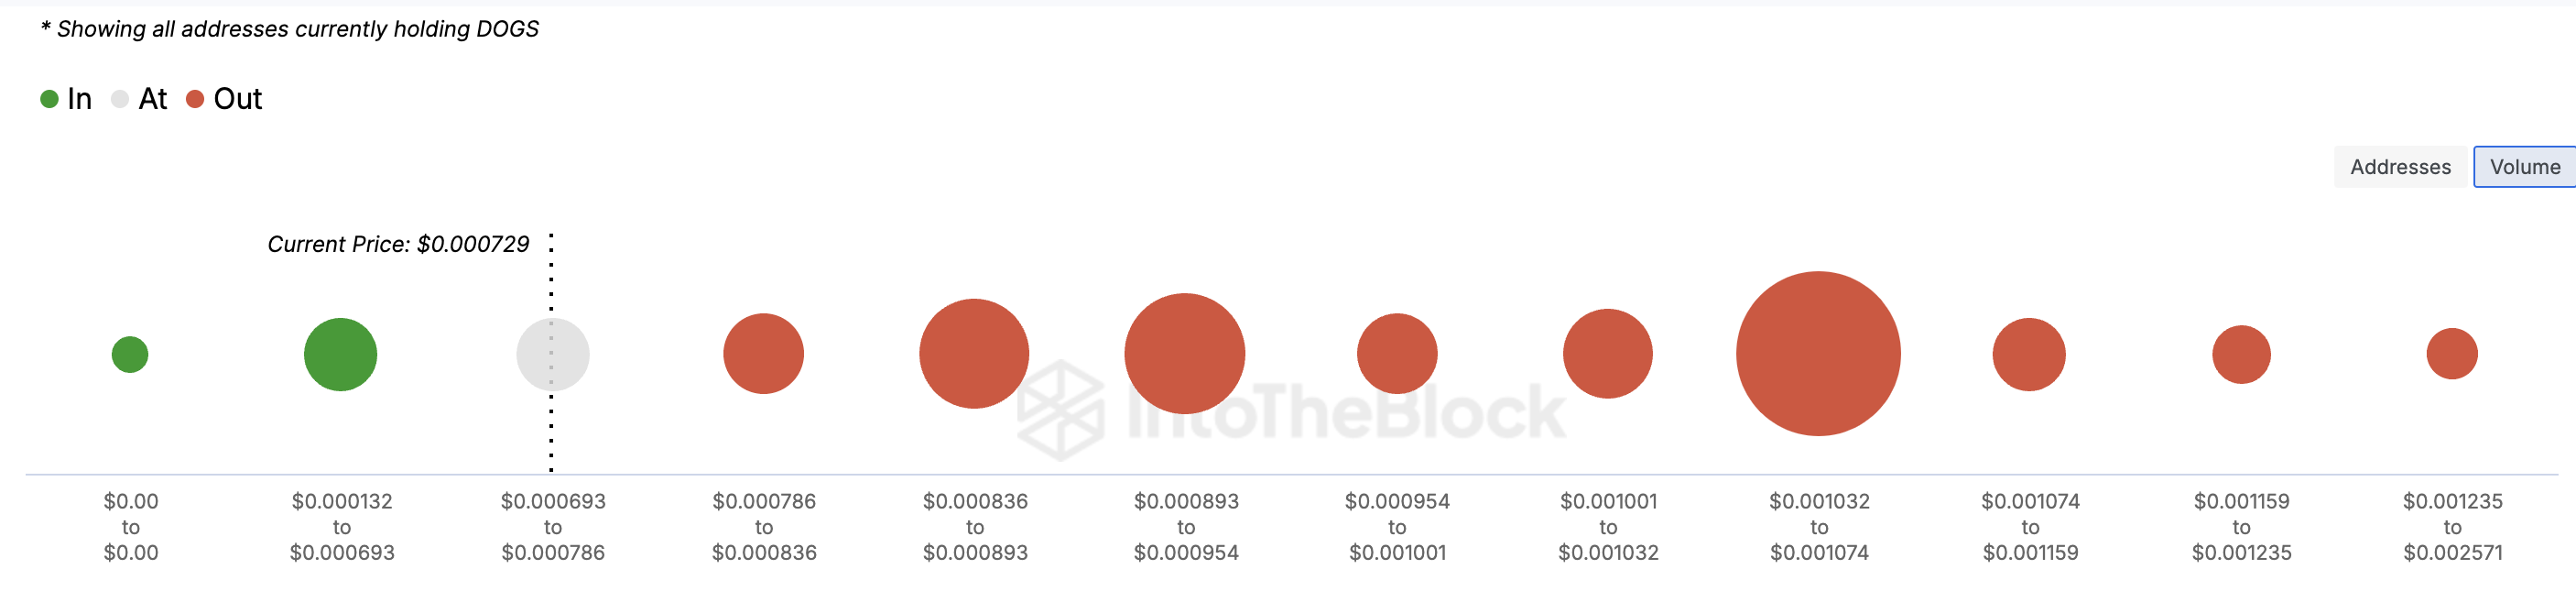
According to the Global In/Out of Money (GIOM) indicator, nearly 99% of DOGS holders are at a loss, with billions of addresses that purchased DOGS between $0.00079 and $0.0013 currently holding the token at a loss.
Apart from highlighting the on-chain cost basis, the GIOM also reveals whether a token is facing resistance or support. A large cluster of addresses or tokens within a price range signals significant support or resistance. Presently, the large number of DOGS holders out of the money indicates that the price may struggle to rise and could potentially fall again.
Read more: What Are Telegram Bot Coins?
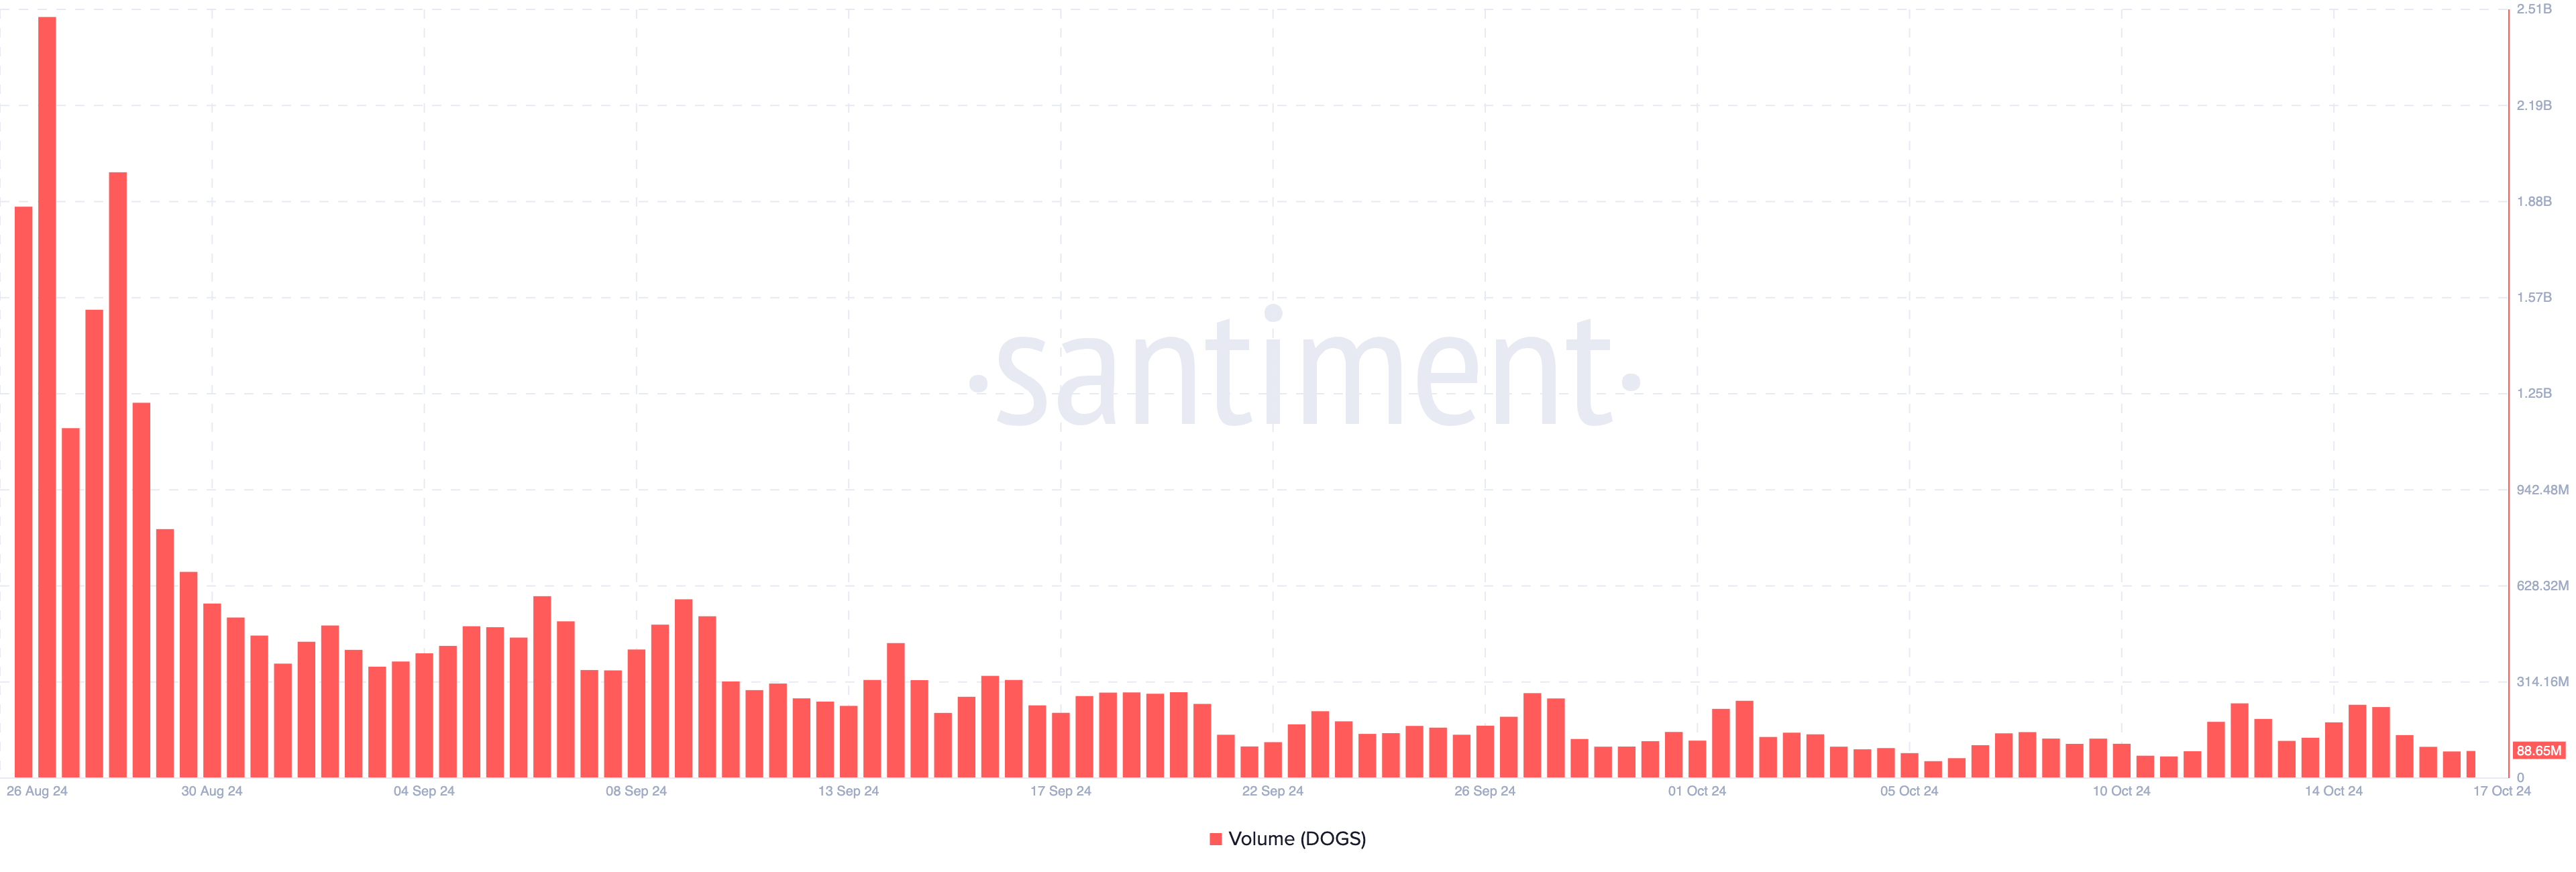
Another reason DOGS’ price could fall again is its volume. Around the time the meme coin launched, the volume was over $2 billion, indicating that the market was highly interested in it.
As of this writing, the token’s trading volume has dropped to $88.65 million, a significant decline from earlier levels. This drop in volume suggests reduced buying and selling activity, which may make it difficult for the meme coin to rebound from its current lows.
With lower market activity, price recovery could be a challenge as fewer traders are interacting with the token.
DOGS Price Prediction: Lower Lows
Based on the daily chart, the Bollinger Bands (BB) around DOGS have contracted. This suggests that volatility is currently low, and the price may remain range-bound without experiencing significant price swings.
When the bands expand, it typically indicates high volatility and the potential for more dramatic price movements. However, with the BB contracting, it seems the market is expecting stability or muted price action in the short term for DOGS.
Read more: Top 7 Telegram Tap-to-Earn Games to Play in 2024
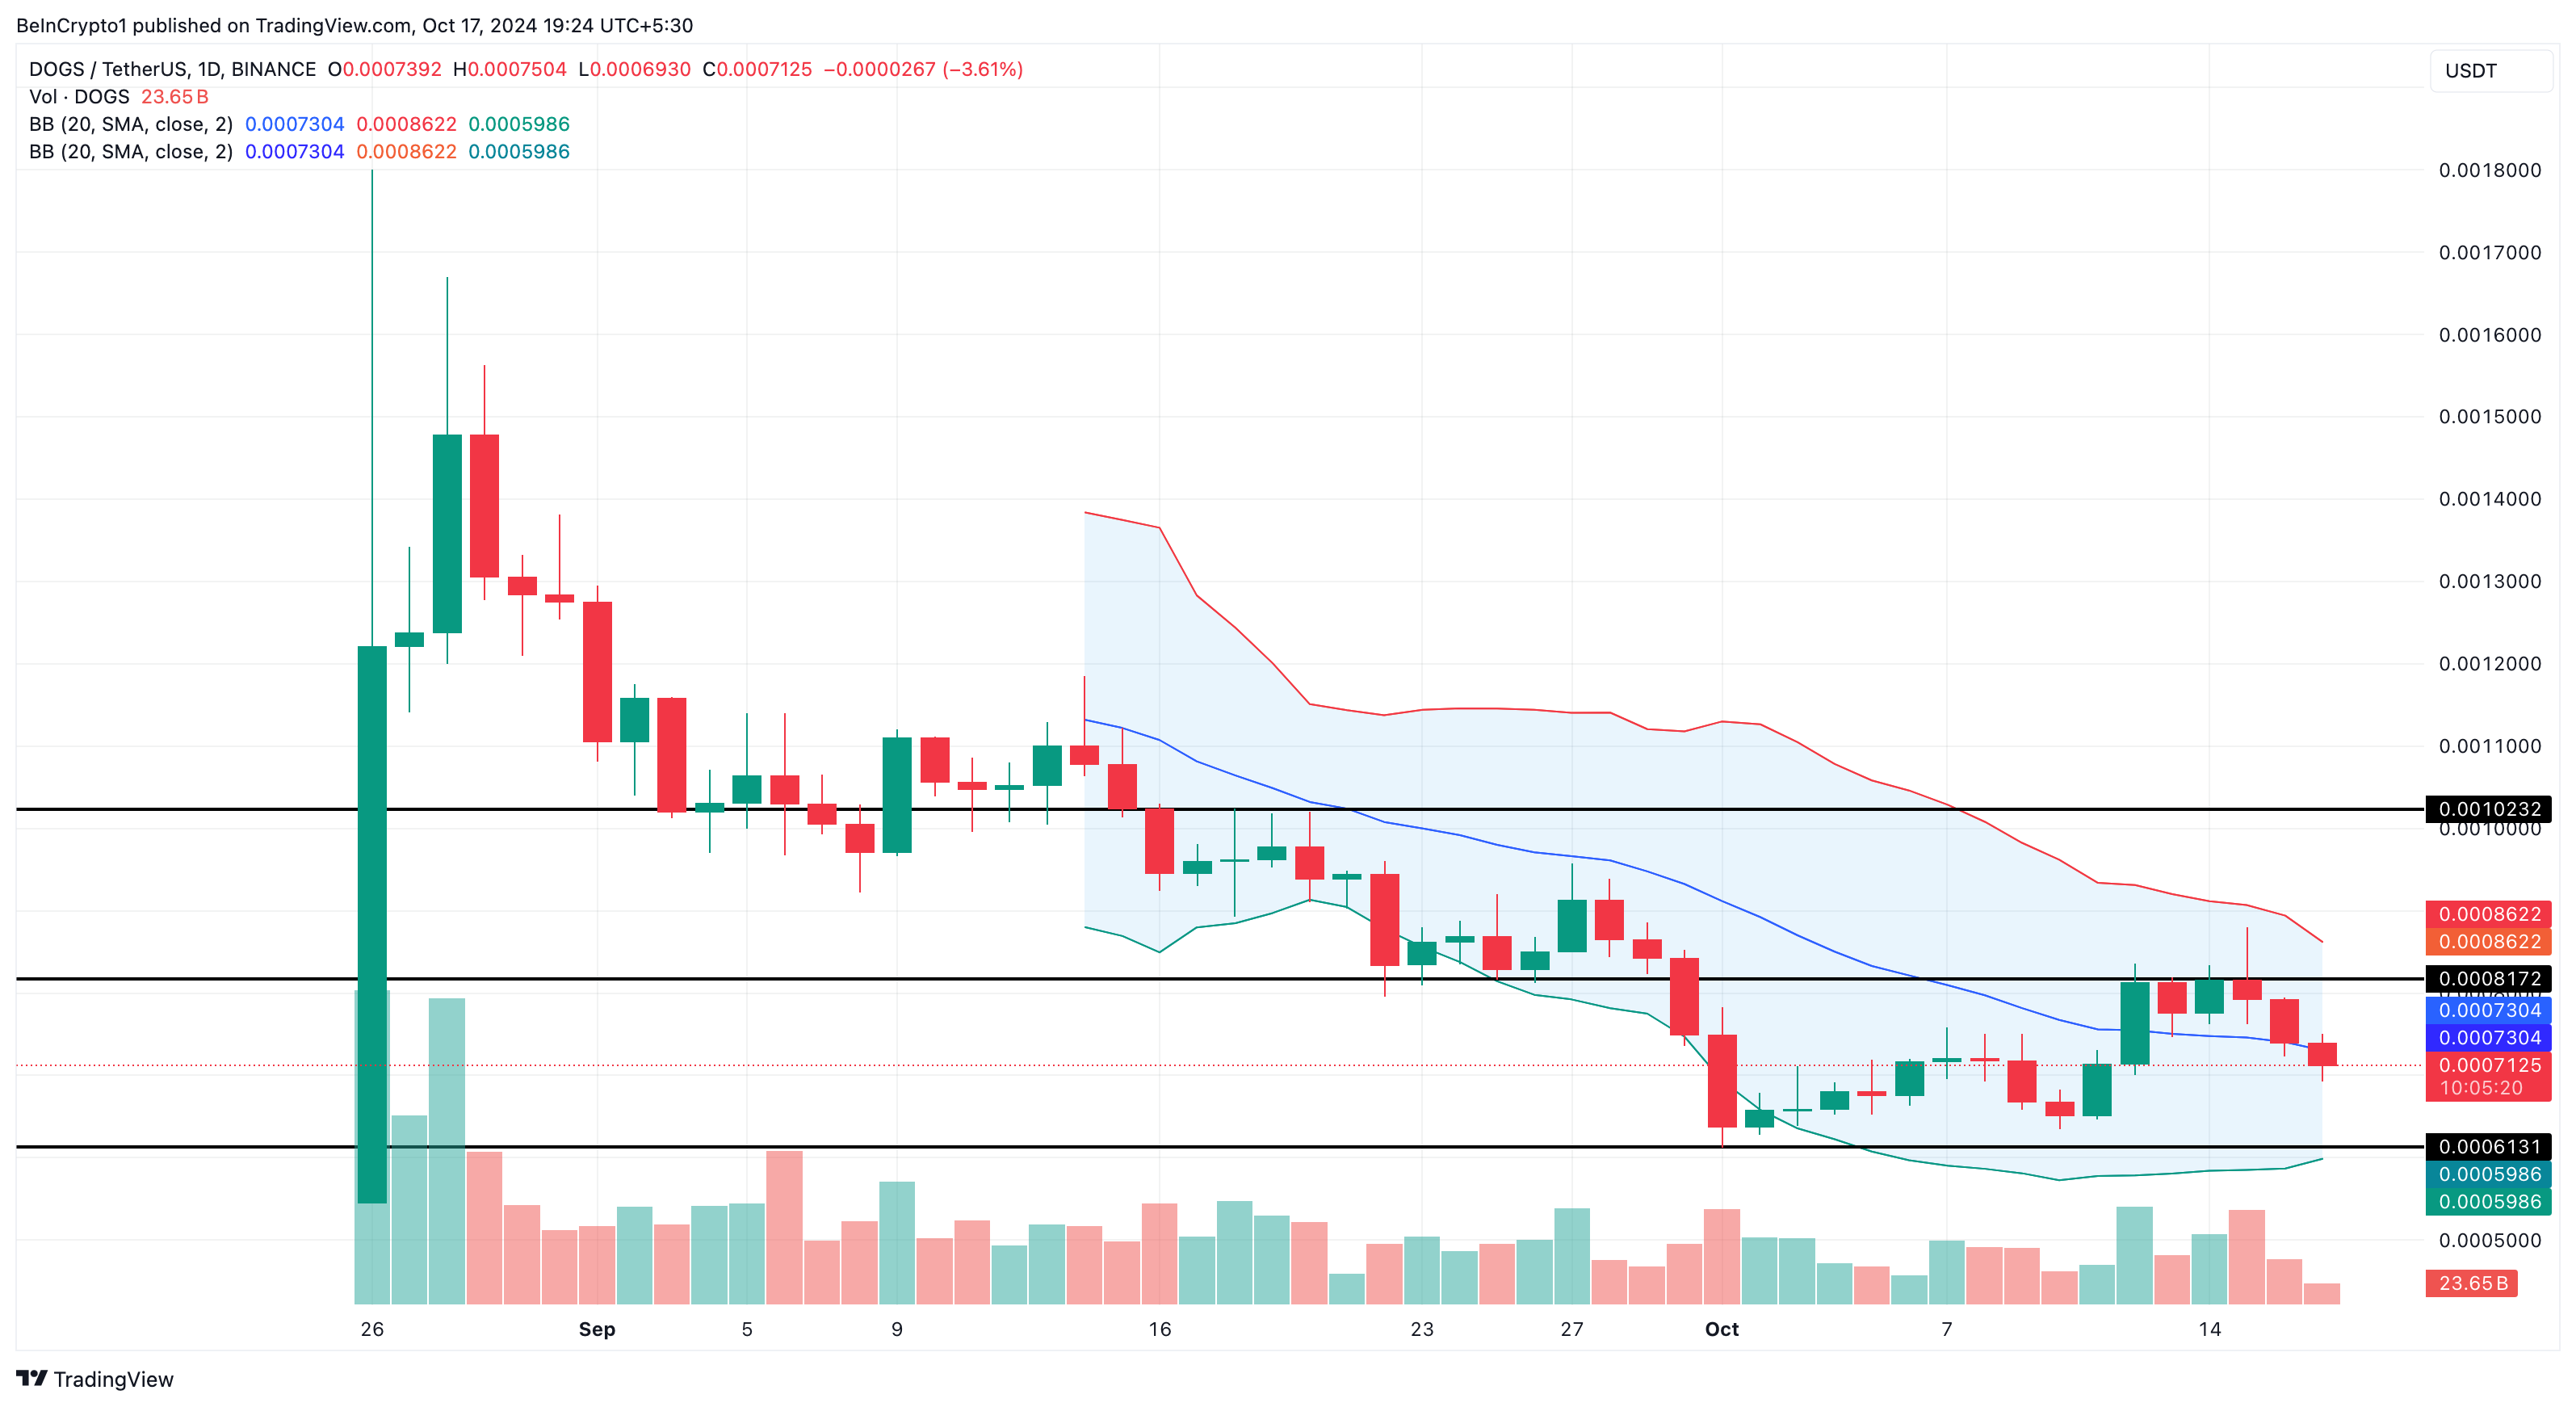
Considering DOGS’ current movement, the meme coin’s price is likely to drop below $0.00061. However, if investors step in and buy the dip in large volumes, the trend could reverse. In that scenario, the meme coin’s value might rise to $0.00081 or potentially even as high as $0.0010.
Disclaimer
In line with the Trust Project guidelines, this price analysis article is for informational purposes only and should not be considered financial or investment advice. BeInCrypto is committed to accurate, unbiased reporting, but market conditions are subject to change without notice. Always conduct your own research and consult with a professional before making any financial decisions. Please note that our Terms and Conditions, Privacy Policy, and Disclaimers have been updated.


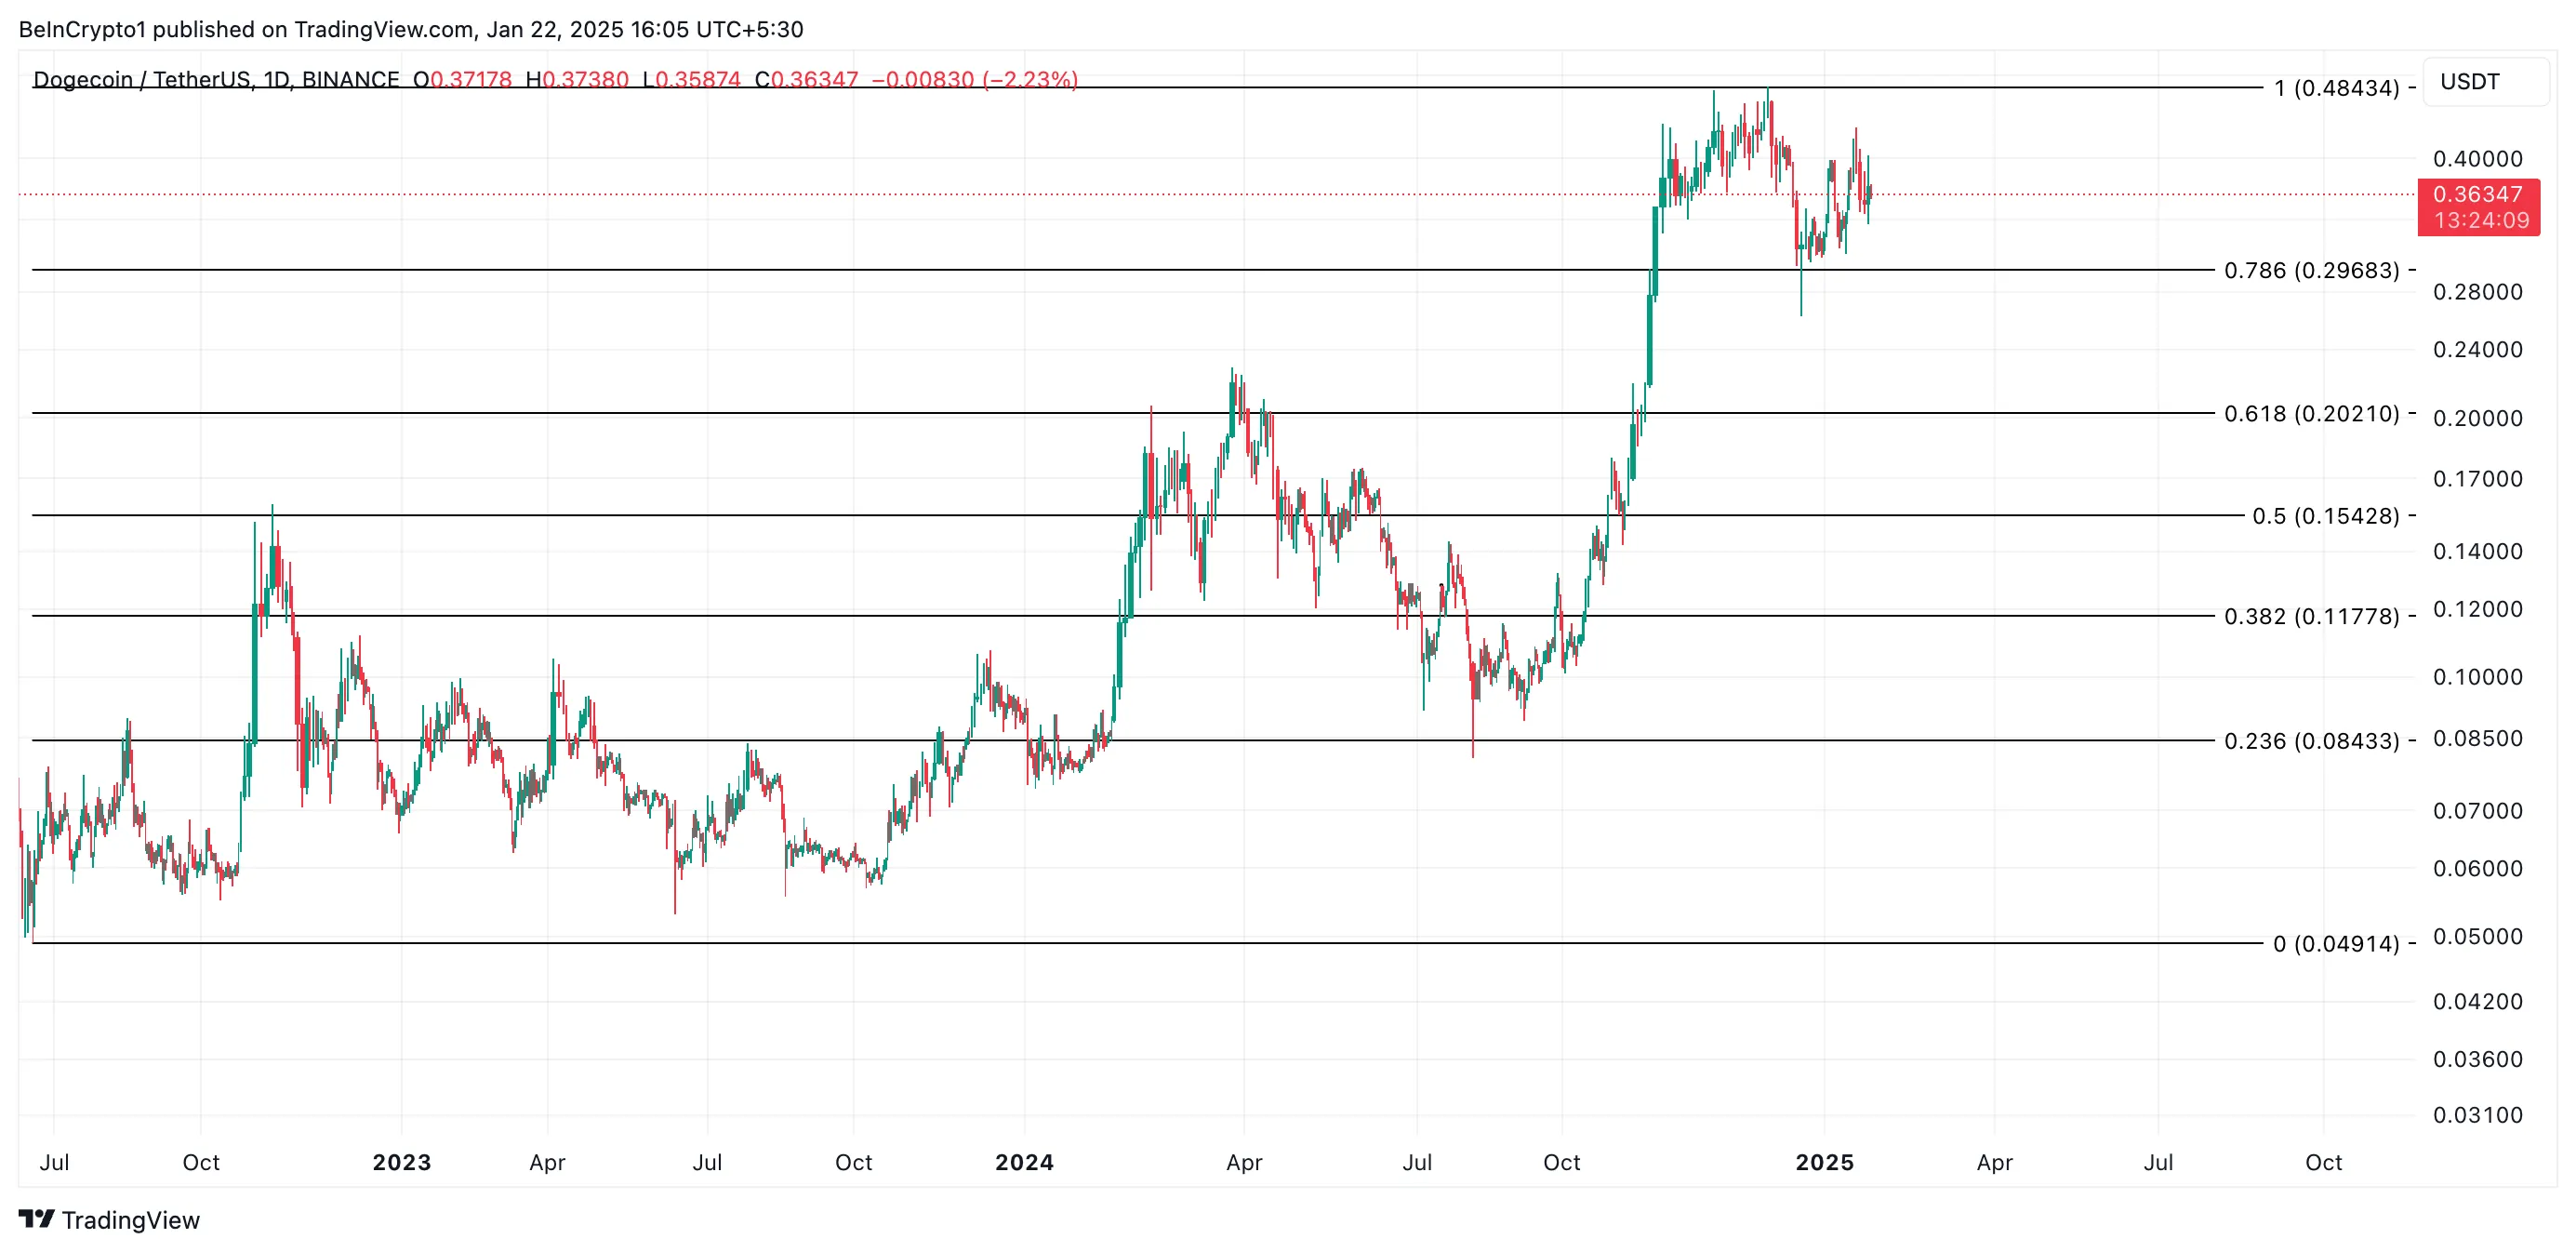
Dogecoin (DOGE), a leading meme coin, is signaling a potential breakout from its narrow trading range.
If this momentum continues, it could reclaim its multi-year high of $0.48, fueled by extended holding periods and increased accumulation by large holders.
Dogecoin Investors Reduce Distribution
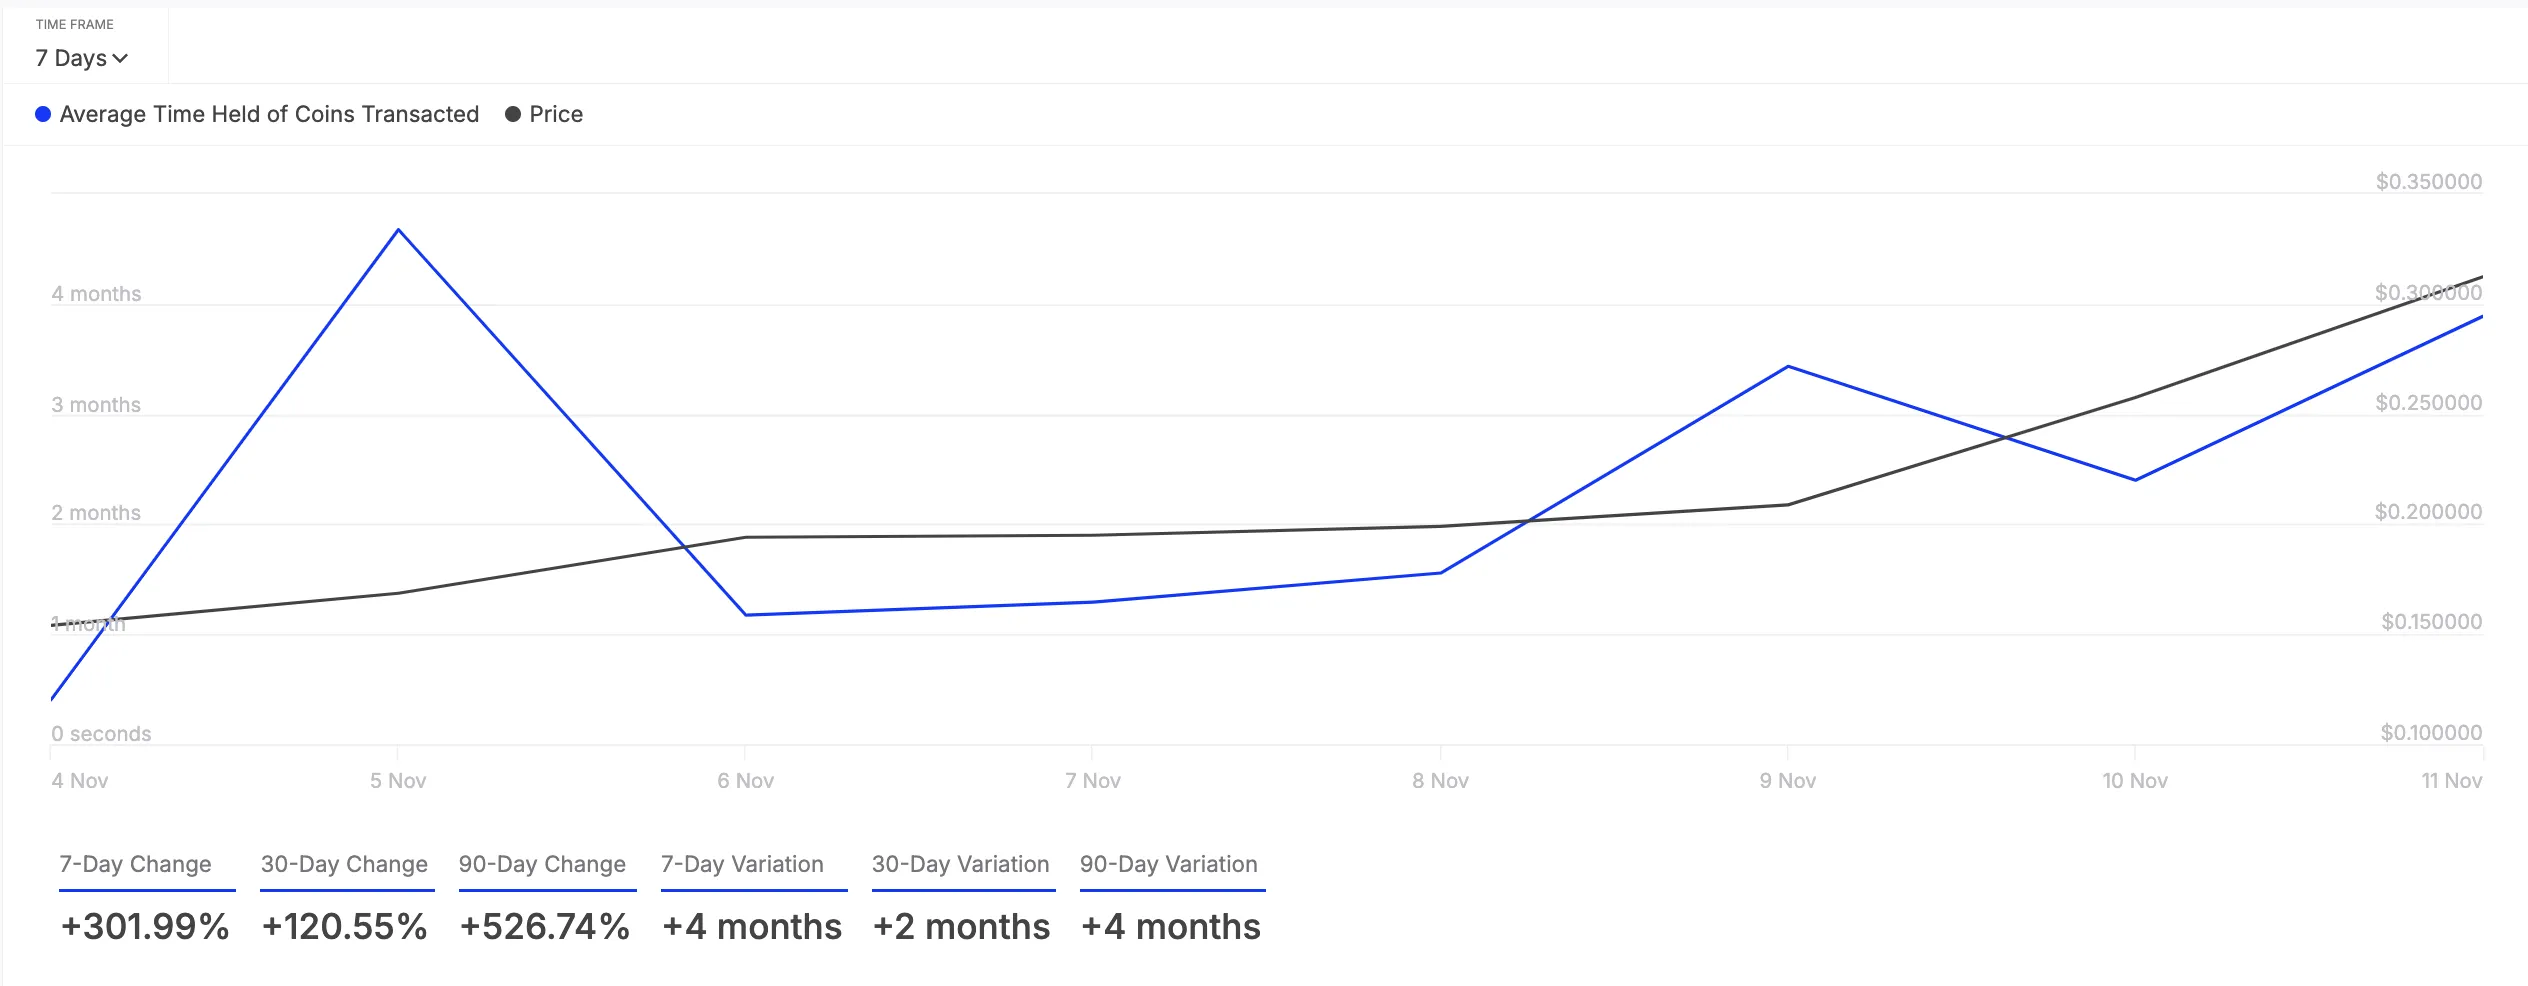
The on-chain assessment of DOGE’s performance has revealed a significant spike in the holding time of all its coins transacted in the past seven days. According to IntoTheBlock, this has climbed by 302% during the review period.
The holding time of an asset’s transacted coins represents the average duration tokens are kept in wallets before being sold or transferred.
Longer holding periods like this reduce selling pressure in the DOGE market. This reflects stronger investor conviction, as investors choose to keep their coins rather than sell them.
In addition to reducing selling activity, DOGE whales have increased their holdings over the past week. This is reflected by the 112% uptick in its large holders’ netflow during that period.
An asset’s large holders’ netflow metric tracks the movement of coins into and out of wallets controlled by whales or institutional investors. When this metric spikes, it suggests that these large holders are accumulating more of the asset, signaling increased confidence in its future price movement.
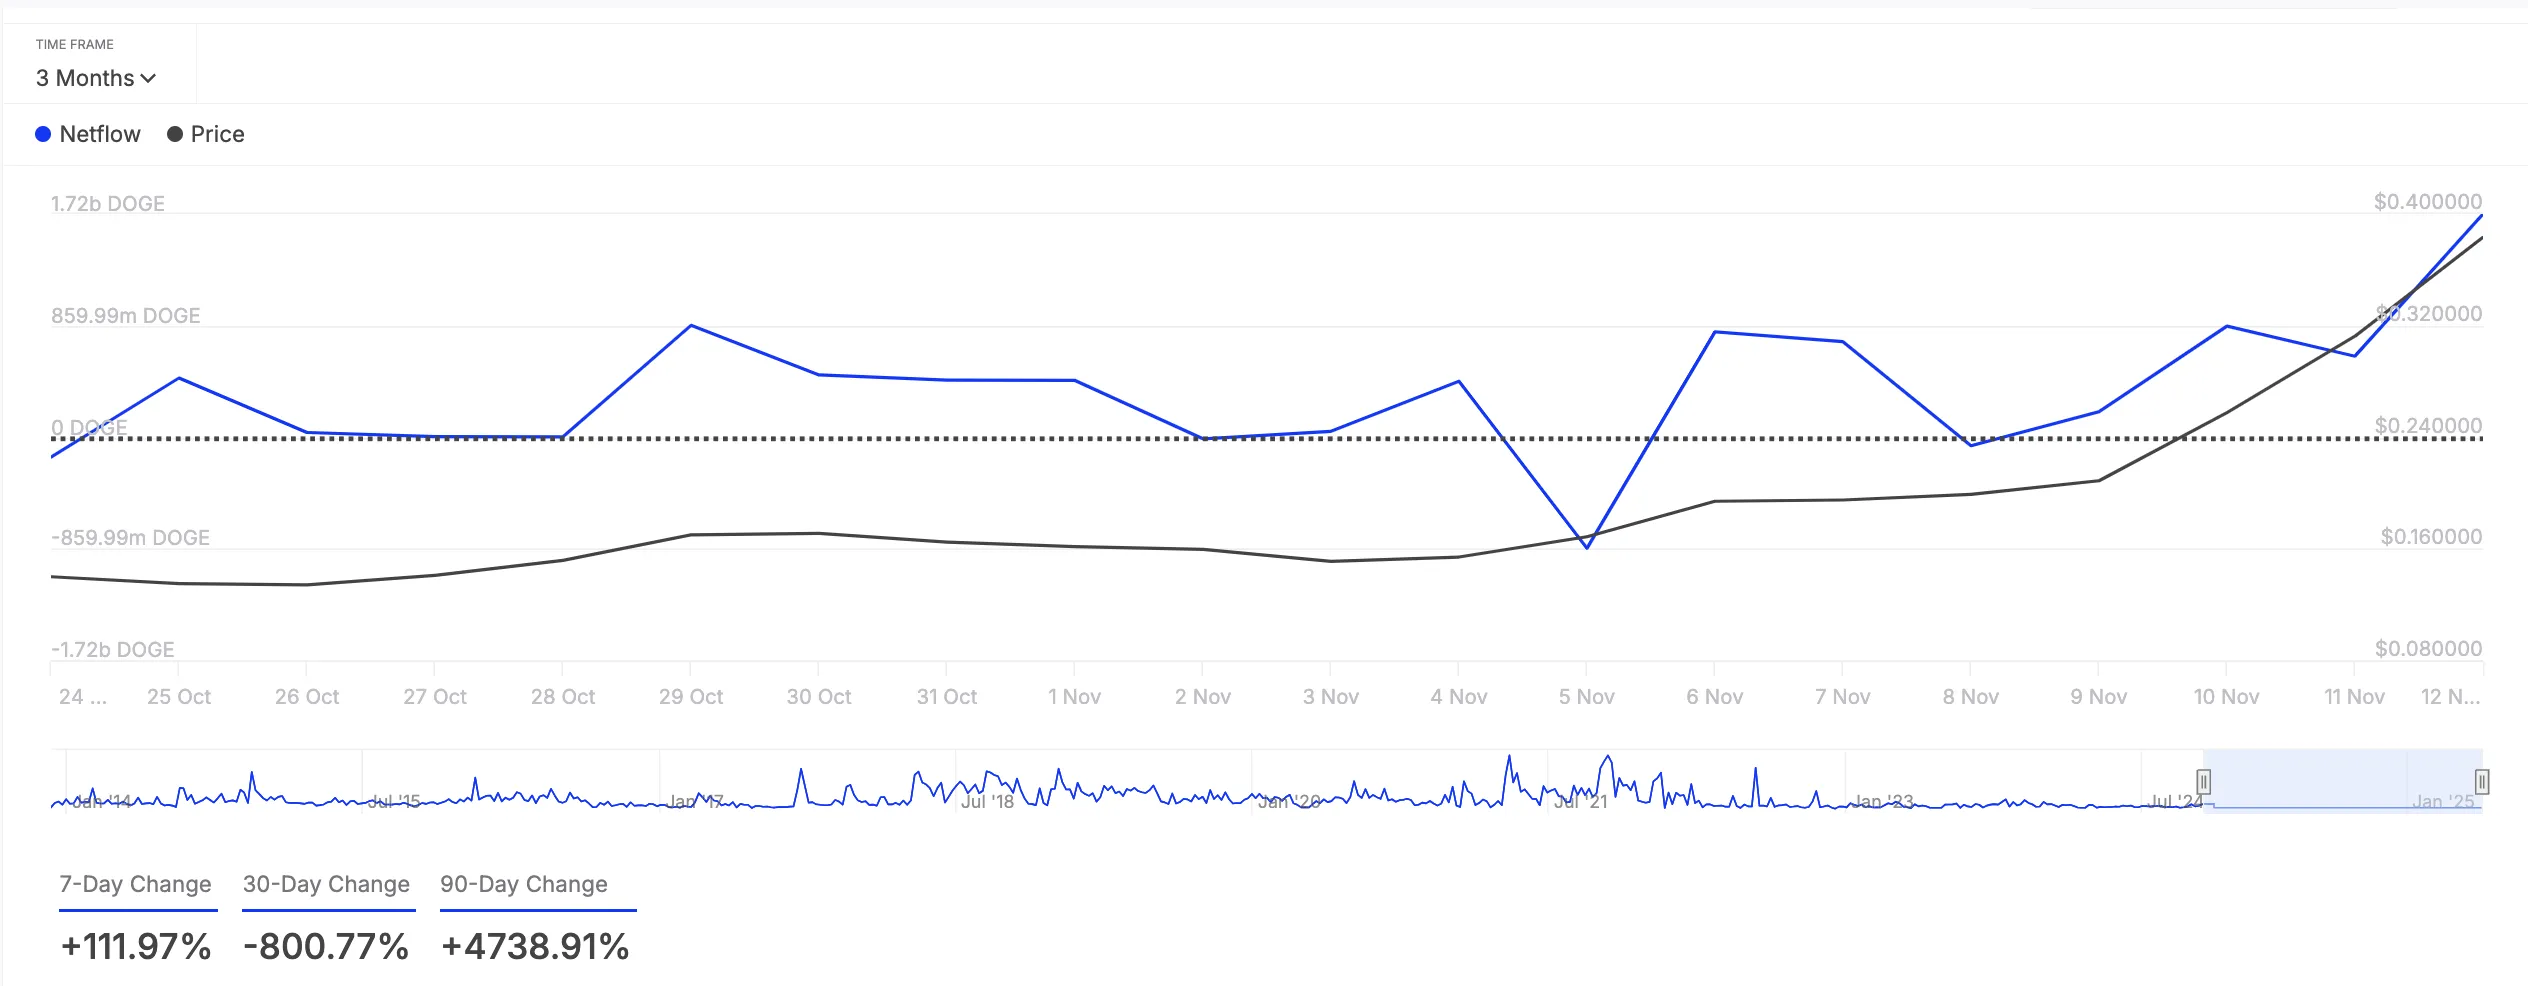
DOGE Price Prediction: Bullish Run Could Continue
If this bullish momentum is maintained, DOGE will extend its weekly 3% spike. As buying pressure strengthens, the meme coin could revisit its four-year high of $0.48.
However, this bullish outlook will be invalidated if accumulation stalls and selling activity recommences. In that scenario, DOGE’s price could slip to $0.29.
Disclaimer
In line with the Trust Project guidelines, this price analysis article is for informational purposes only and should not be considered financial or investment advice. BeInCrypto is committed to accurate, unbiased reporting, but market conditions are subject to change without notice. Always conduct your own research and consult with a professional before making any financial decisions. Please note that our Terms and Conditions, Privacy Policy, and Disclaimers have been updated.

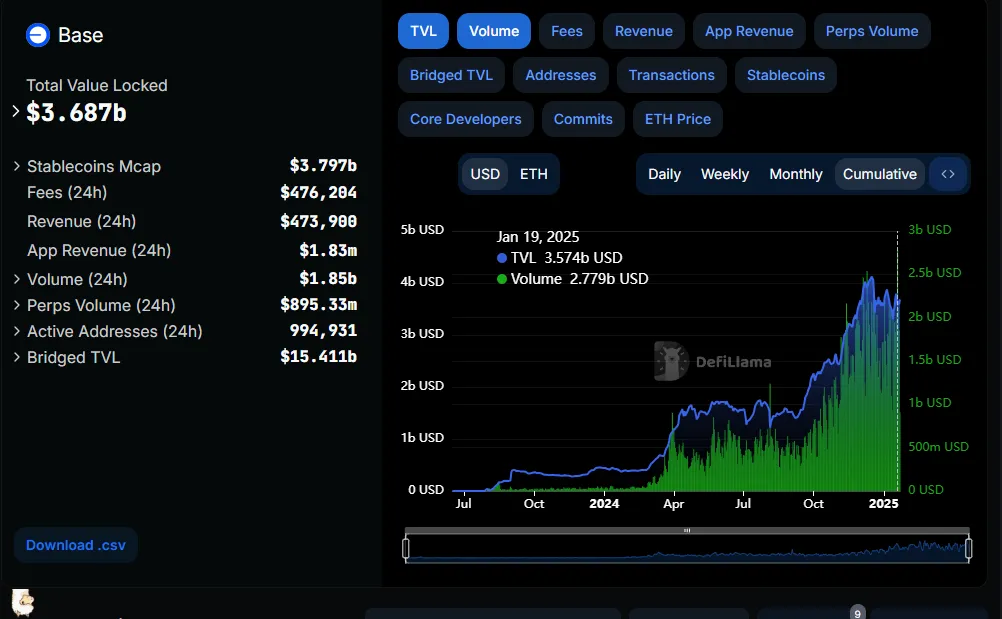
Base, Coinbase’s Layer-2 (L2) blockchain solution, has reached new heights, setting an all-time high daily decentralized exchange (DEX) trading volume near $3 billion.
This milestone reflects Base’s growing prominence in the L2 space and its role in scaling on-chain transactions for Coinbase users.
Base Hits New Milestone in DEX Volume
Blockchain analyst Dan Smith highlighted Base L2’s record-breaking volume of $2.9 billion, including $1.3 billion in ETH-USD trading, which also hit an all-time high. Other trading pairs, such as ETH-cbBTC and BTC-USD, were close to breaking their own records.
The $2.9 billion DEX volume reflects Base’s growing appeal among traders, particularly in ETH-USD pairs, which benefited from recent price volatility. Alexander, another blockchain enthusiast, noted that this milestone marked the first time Base nearly tagged $3 billion in daily volume, alluding to the development as evidence of L2’s growing adoption.
AerodromeFi, a liquidity-focused decentralized protocol on Base, also recorded an all-time high of $1.68 billion in volume, further emphasizing the ecosystem’s momentum.
“This is the first time Base nearly passed $3 billion and AerodromeFi set a new ATH of $1.68 billion in volume,” Alexander commented.
Base’s success is particularly notable because it operates without a native token. Coinbase explicitly ruled out launching a token for Base, prioritizing ecosystem growth and user adoption instead. This approach has likely contributed to its traction by focusing on utility and reducing speculative risks that could deter long-term users.
“There are no plans for a Base network token. We are focused on building, and we want to solve real problems that let you build better,” Base lead developer Jesse Pollak stated recently.
Consistent Growth in Transactions and TVL
The recent achievement follows Base’s earlier milestones, including reaching one billion transactions two months ago and surpassing six million daily transactions in October. More closely, the network recently outpaced Ethereum in user growth amid growing crypto markets.
Additionally, Base’s Total Value Locked (TVL) has seen consistent growth, indicating increased user participation, asset inflows, and liquidity within its ecosystem. A rising TVL signals greater confidence in the platform, fostering a stronger and more sustainable DeFi environment.
Despite its impressive growth, Base has faced some criticism. The network was accused of copying aspects of an NFT project, sparking concerns over originality and intellectual property. While this controversy did not deter adoption, it highlights the challenges of rapid innovation in the competitive blockchain space.
Base’s trajectory positions it as a serious contender in the L2 space, competing with established players like Arbitrum (ARB) and Optimism (OP). Its emphasis on utility, combined with rising user participation and liquidity, paints a promising picture for its future.
Disclaimer
In adherence to the Trust Project guidelines, BeInCrypto is committed to unbiased, transparent reporting. This news article aims to provide accurate, timely information. However, readers are advised to verify facts independently and consult with a professional before making any decisions based on this content. Please note that our Terms and Conditions, Privacy Policy, and Disclaimers have been updated.

Cardano’s recent sideways price action has led to a surge in demand for short positions among futures traders.
As the coin’s momentum slows, traders are increasingly betting on a price decline, signaling a bearish sentiment toward ADA.
Cardano Traders Bet on a Price Decline
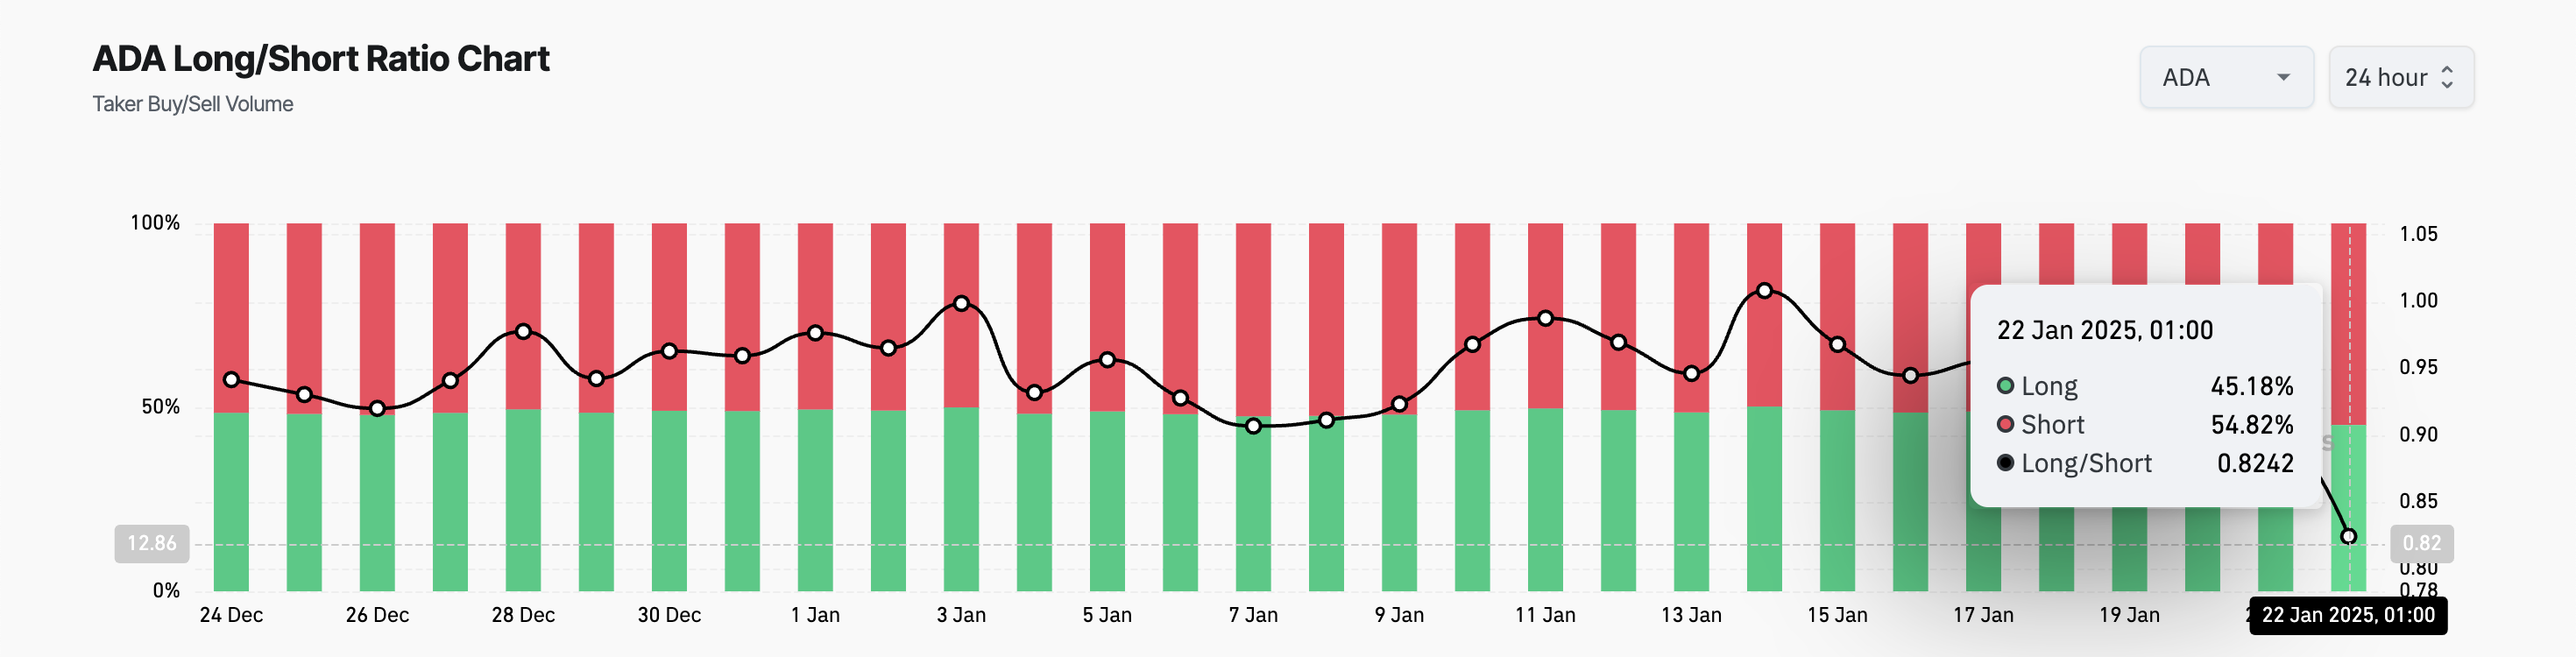
According to Coinglass, ADA’s Long/Short Ratio is at a monthly low of 0.82, indicating a high demand for short positions.
An asset’s Long/Short Ratio compares the number of its long (buy) positions to short (sell) positions in a market. As with ADA, when the ratio is below one, more traders are betting on the price falling (shorting) rather than rising. If short sellers continue to dominate, this can increase the downward pressure on the asset’s price.
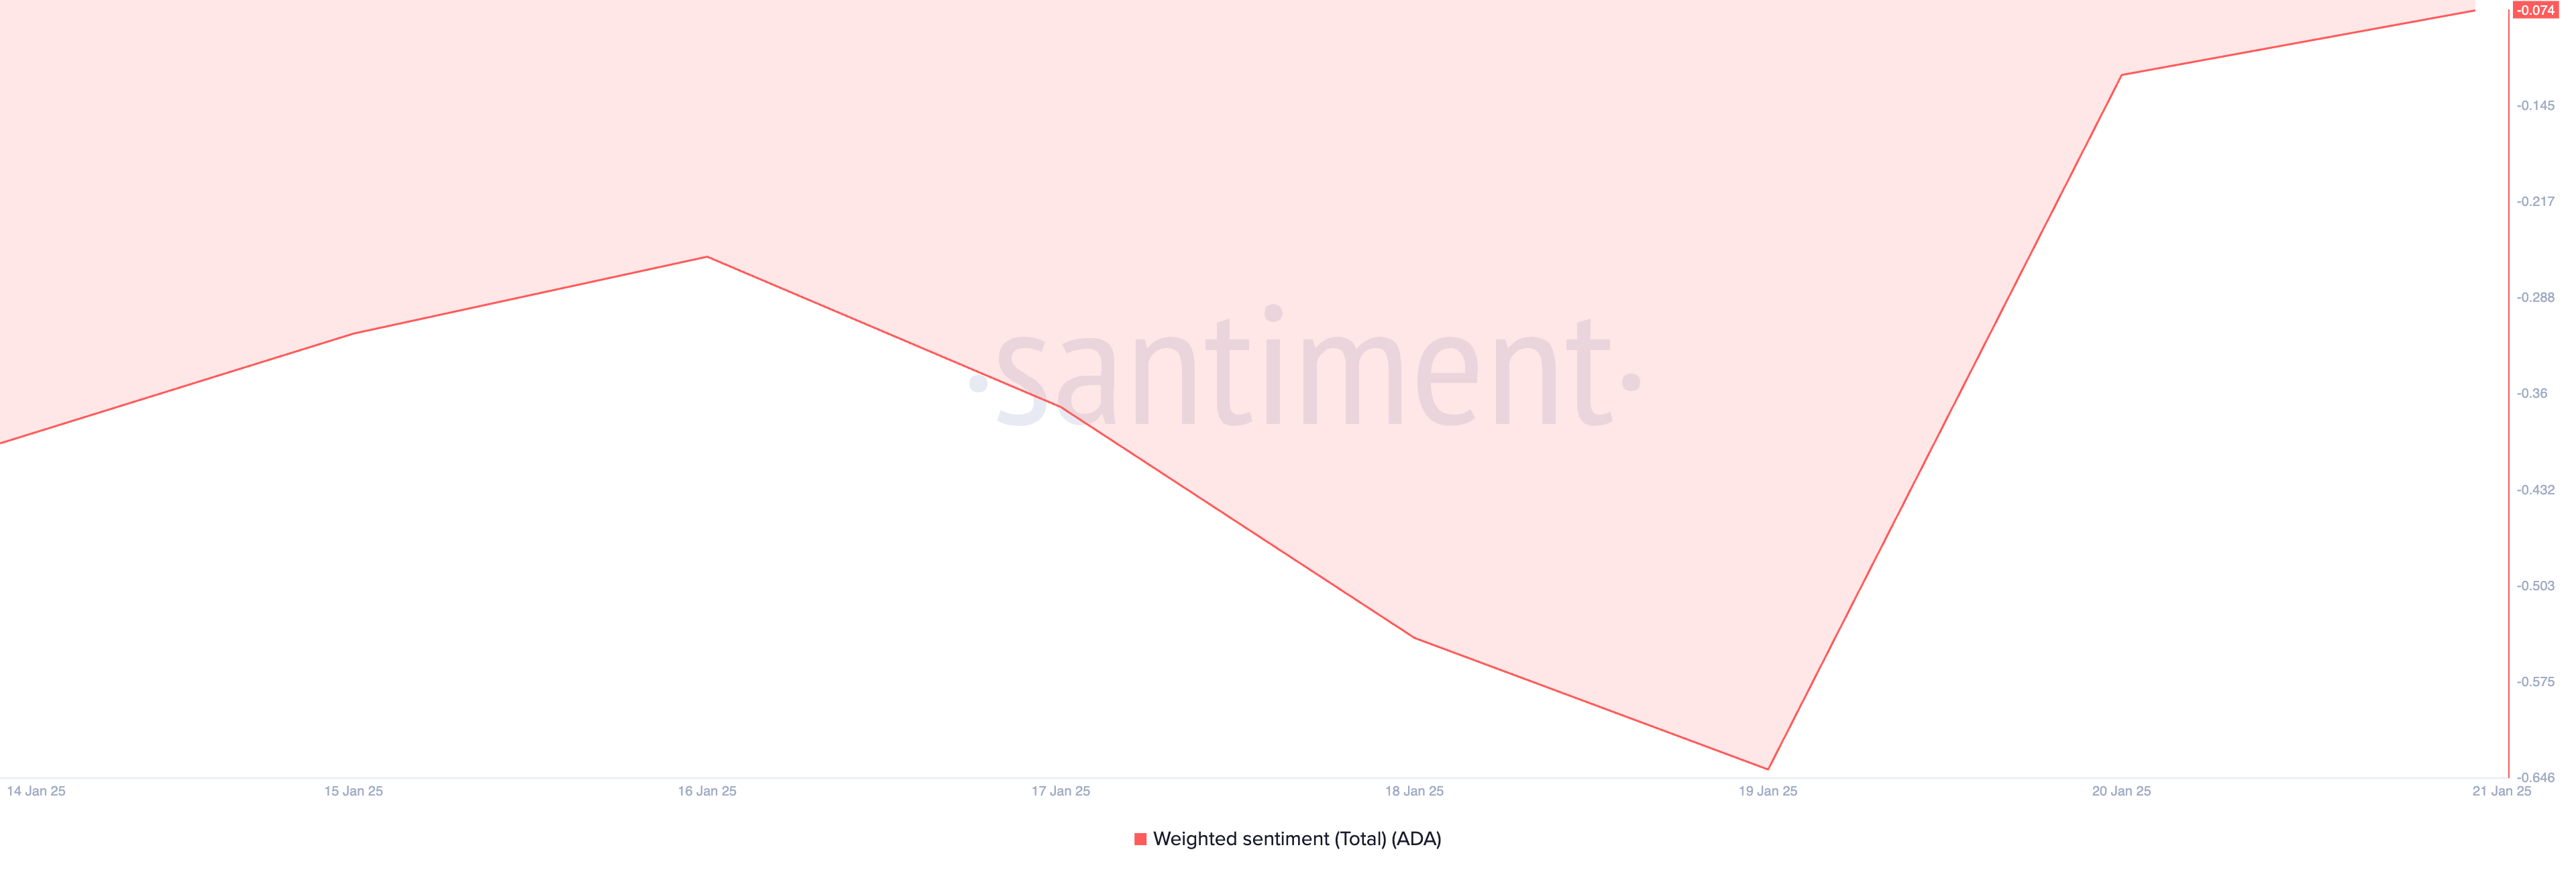
Additionally, ADA’s Weighted Sentiment remains negative, currently standing at -0.074, reinforcing the bearish outlook for the altcoin.
Weighted Sentiment gauges the overall market bias by analyzing the volume and tone of social media mentions. A negative value signals growing skepticism among investors, often leading to reduced trading activity and downward pressure on the asset’s price.
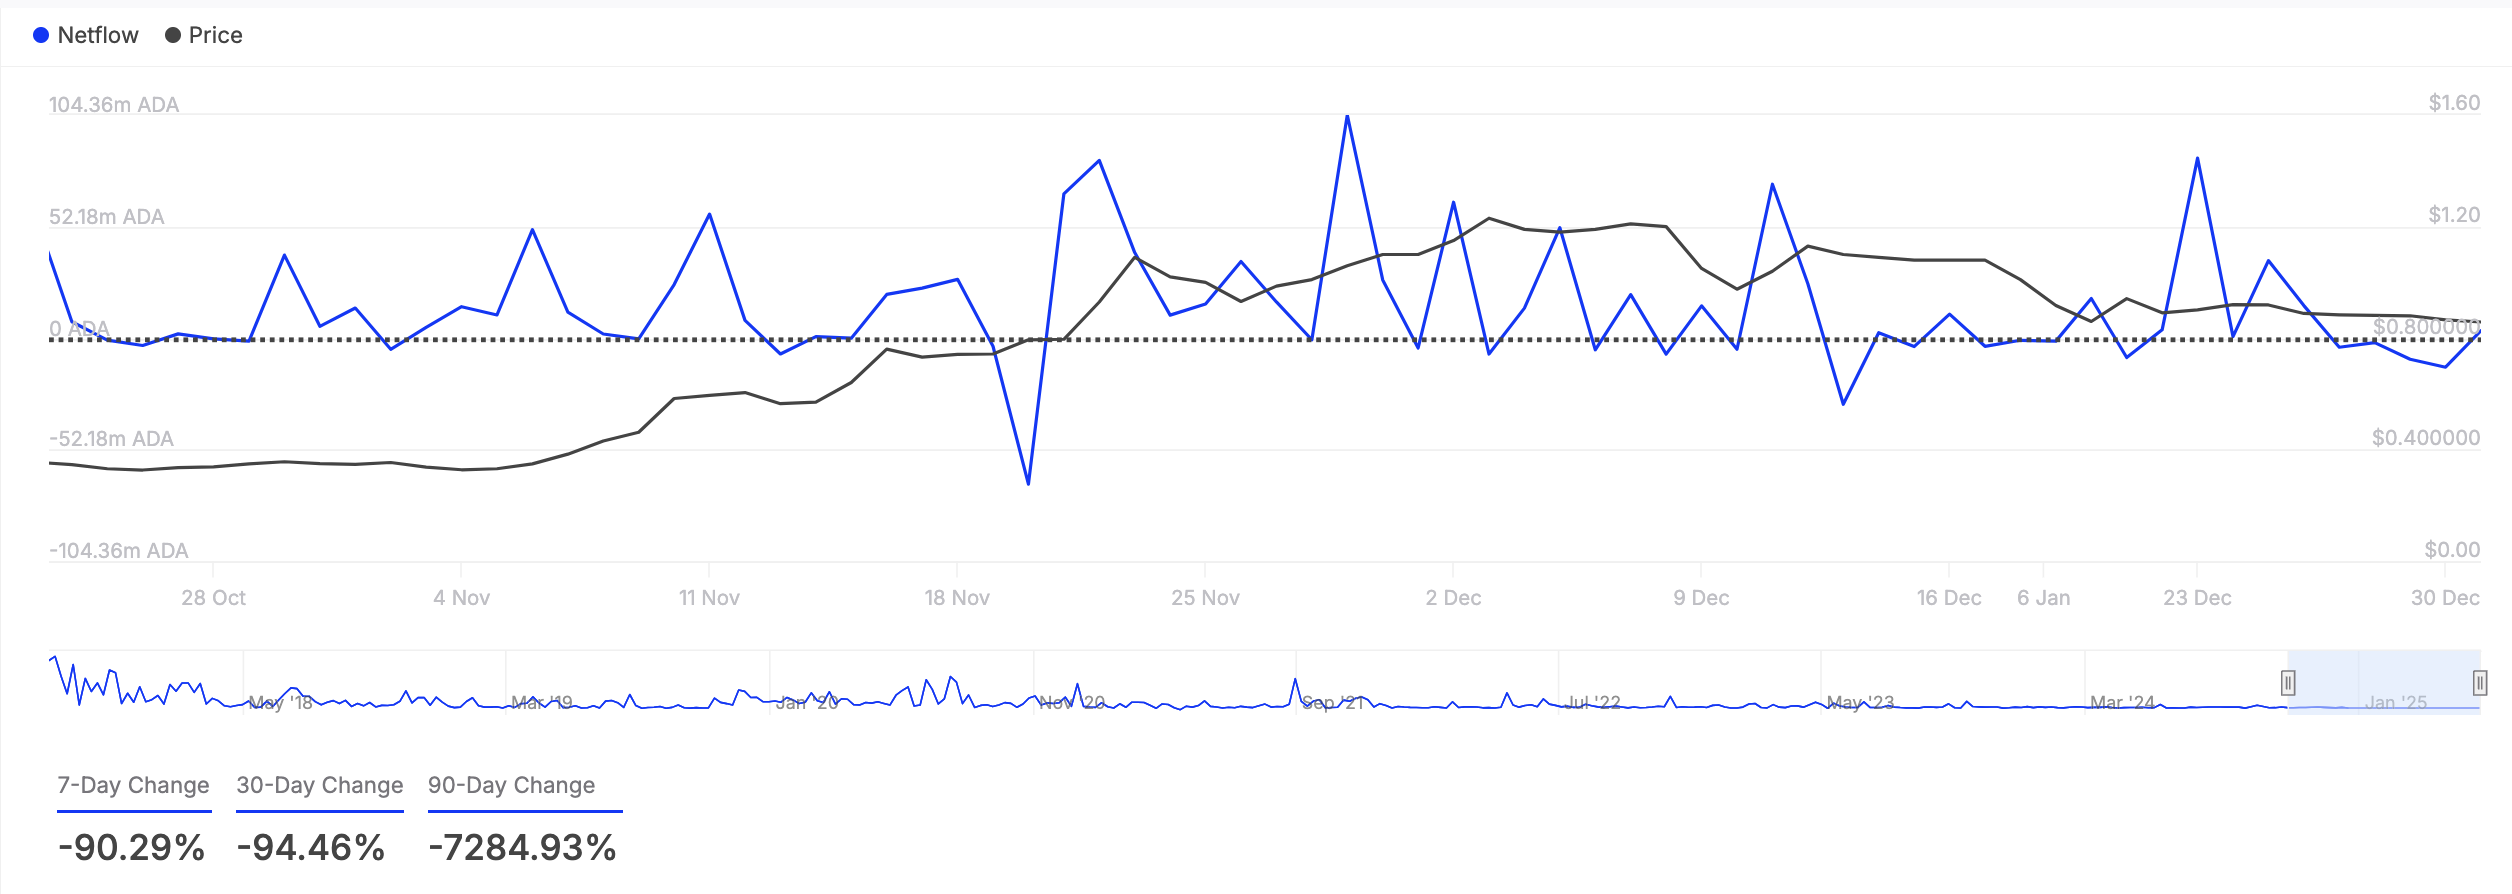
Notably, ADA whales have reduced their trading activity over the past week, with the coin’s large holders’ netflow dropping by 90.29%, according to IntoTheBlock.
Large holders, defined as addresses holding more than 0.1% of an asset’s circulating supply, play a significant role in market movements. A decline in their netflow indicates reduced buying activity, adding to the downward pressure on ADA’s price.
ADA Price Prediction: Recovery to $1 or Decline to $0.80?
ADA is currently trading at $0.98, hovering just above its support level of $0.90. If bearish pressure intensifies, the price may test this support. A failure to hold at $0.90 could see ADA’s decline extend further, potentially dropping to $0.80.
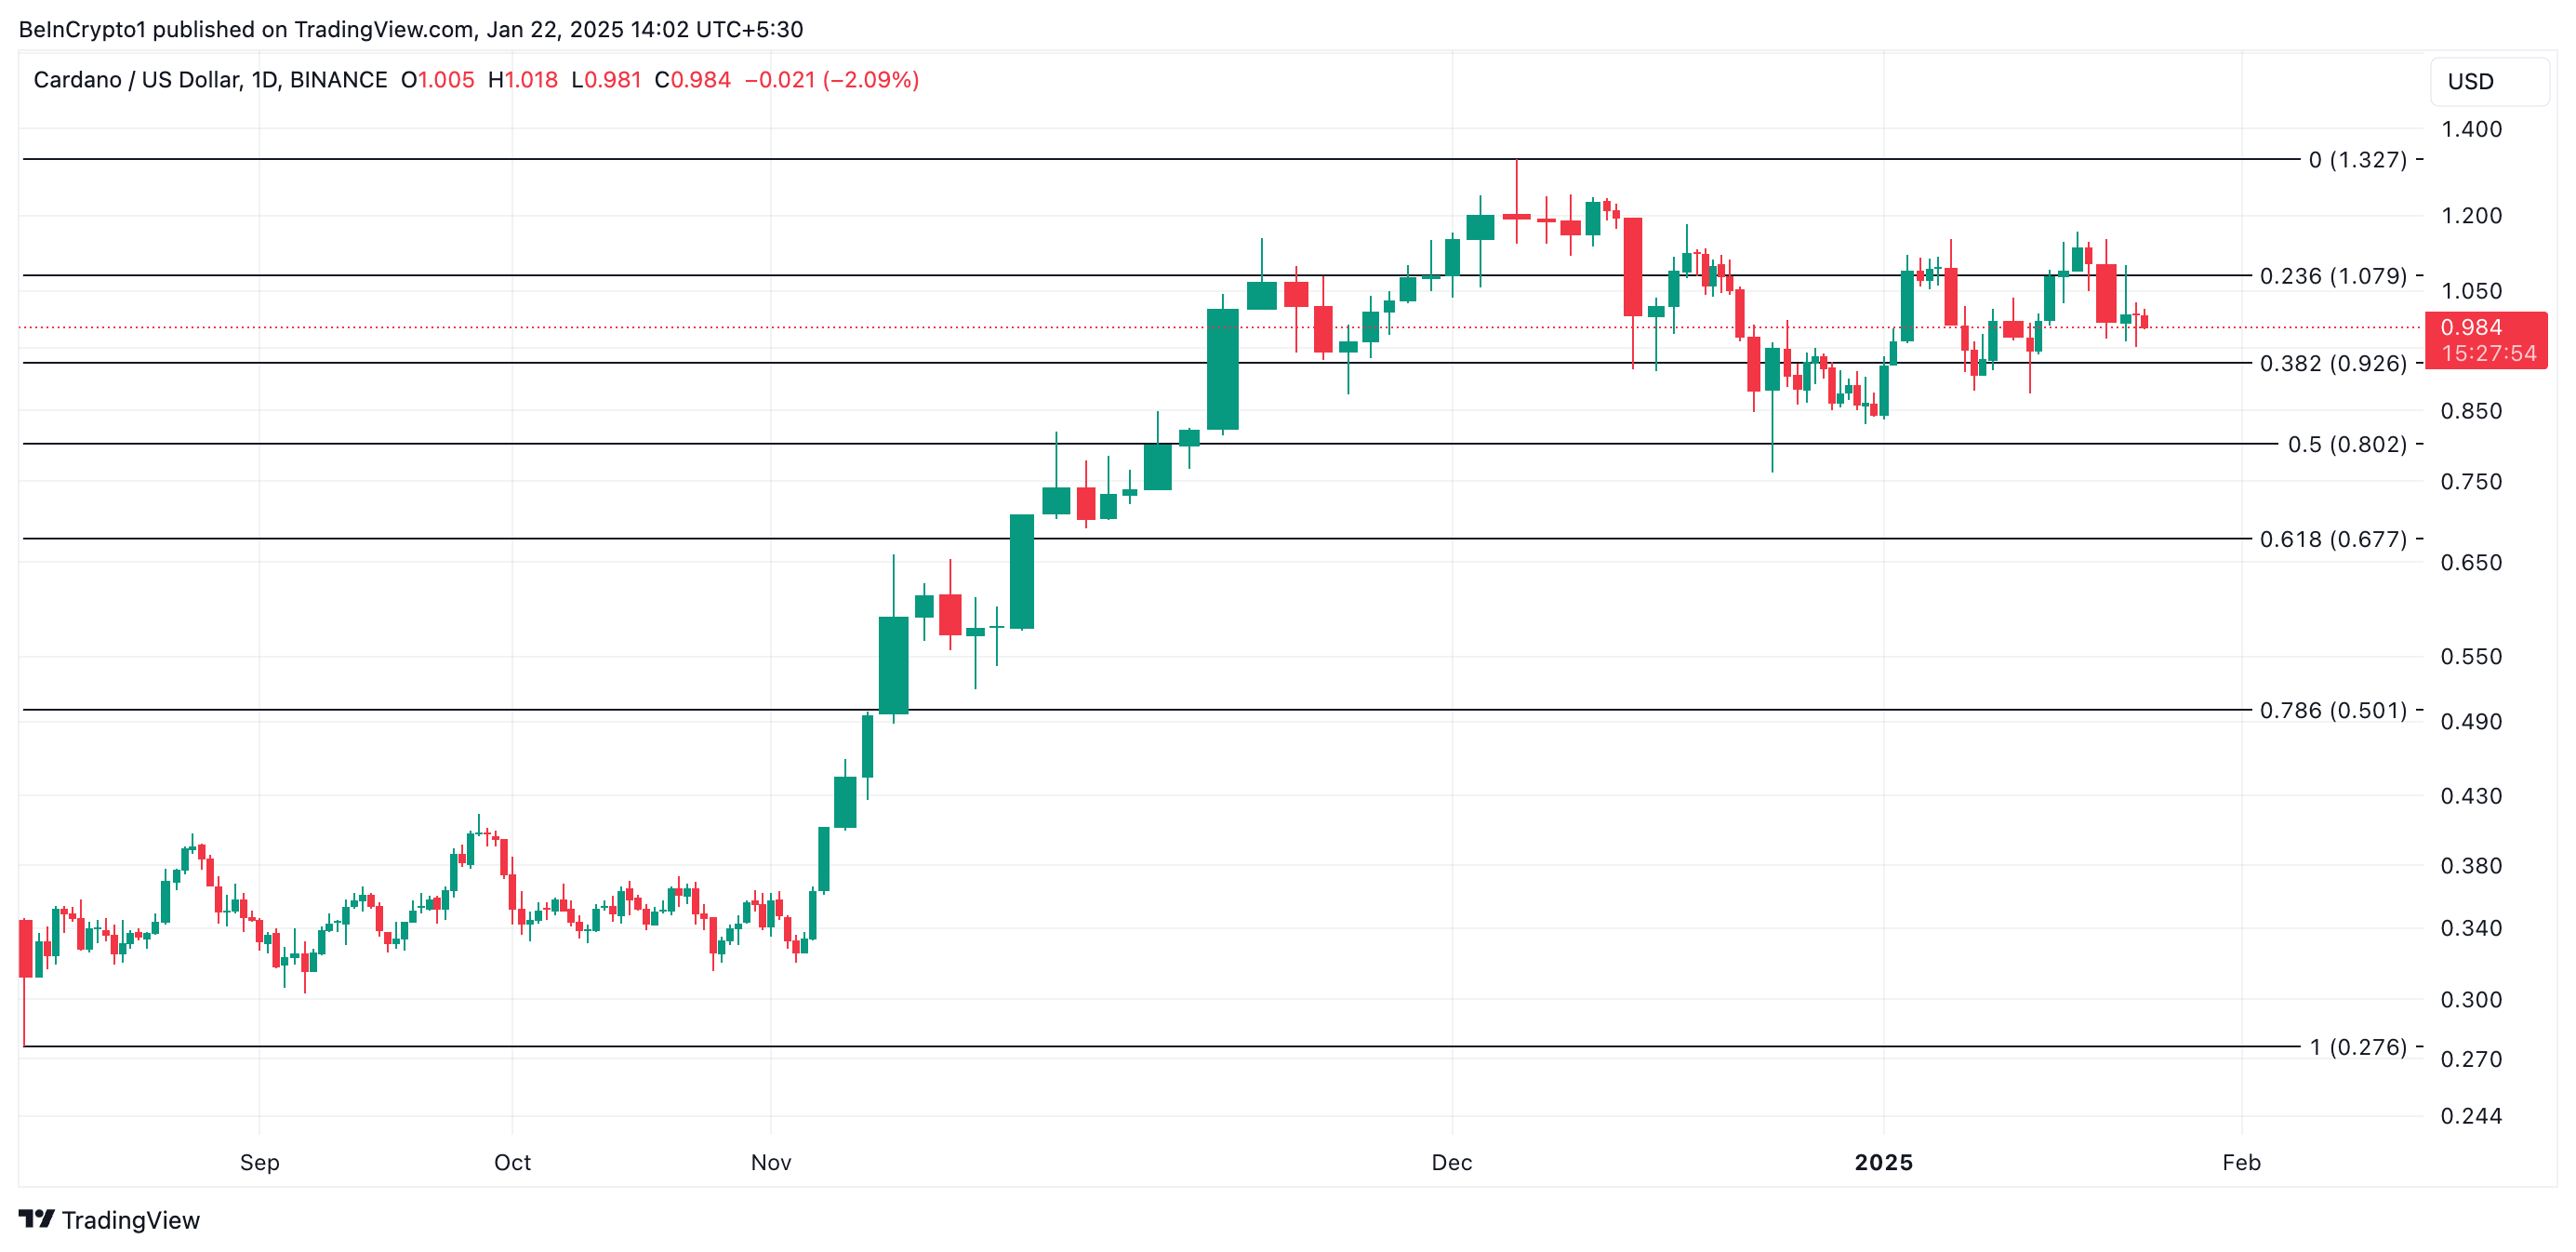
Conversely, if buying activity resurges, ADA’s price could stabilize above the $1 mark.
Disclaimer
In line with the Trust Project guidelines, this price analysis article is for informational purposes only and should not be considered financial or investment advice. BeInCrypto is committed to accurate, unbiased reporting, but market conditions are subject to change without notice. Always conduct your own research and consult with a professional before making any financial decisions. Please note that our Terms and Conditions, Privacy Policy, and Disclaimers have been updated.
Dogecoin Holding Time and Whale Activity Spikes
Ex-SEC Lawyer Says XRP Lawsuit Settlement Weeks Away
World Liberty Financial Purchases 14,403 Ethereum, ETH Price Rally Ahead?
Base DEX Volume Approaches $3 Billion Amid Growing Adoption

Coinbase CEO Reveals Plan To Offer ‘Tier-1 Support’ For Solana Alike BTC & Ether

Is a Drop Below $0.92 Inevitable?

2.52 Million Altcoins Are Ruining Crypto’s Future

Animoca Brands Valuation Tanks 75% In Two Years, Here’s Why

Crypto exchange BingX hacked for $43 million

Are The Big Players Losing Interest?

Hong Kong’s Securities Association Tips Authorities On Crypto Self-Regulation

Coinbase cbBTC Set to go Live on Solana
2.52 Million Altcoins Are Ruining Crypto’s Future
Animoca Brands Valuation Tanks 75% In Two Years, Here’s Why
Crypto exchange BingX hacked for $43 million
Are The Big Players Losing Interest?
Hong Kong’s Securities Association Tips Authorities On Crypto Self-Regulation
Coinbase cbBTC Set to go Live on Solana
-

 Regulation21 hours ago
Acting SEC Chair Uyeda announces new crypto task force
-

 Ethereum16 hours ago
ETH breaks $3,900 as Bitcoin spikes past $103k
-

 Regulation23 hours ago
Tether’s market capitalisation slips as MiCA regulations kick in
-

 Regulation19 hours ago
Turkey rolls out new crypto AML regulations
-

 Ethereum19 hours ago
Ethereum ETFs inflows surge as Bitcoin ETFs see major outflows
-

 Market12 hours ago
Weekly Price Analysis: Bitcoin Remains Rangebound while Altcoins Fly
-

 Market19 hours ago
Bitcoin price analysis: economic headwinds push price lower
-

 Ethereum22 hours ago
Ethereum to rebound as iDEGEN remains on track to a billion-dollar valuation