
Market
Can It Power Toward New Gains?

Bitcoin price climbed further higher above the $67,500 resistance zone. BTC is now consolidating and might clear the $68,350 resistance to continue higher.
- Bitcoin remained stable and extended gains above the $68,000 zone.
- The price is trading above $67,200 and the 100 hourly Simple moving average.
- There is a connecting bullish trend line forming with support at $66,800 on the hourly chart of the BTC/USD pair (data feed from Kraken).
- The pair could rally further if there is a close above the $68,000 resistance zone.
Bitcoin Price Remains Supported for More Upsides
Bitcoin price remained supported and extended its increase above the $67,500 resistance. BTC cleared the $67,800 resistance to move into a positive zone. The price even rallied above the $68,000 and $68,200 resistance levels.
The price traded as high as $68,328 and currently consolidating gains. There was a minor decline below the $68,000 level. The price dipped and tested the 23.6% Fib retracement level of the upward move from the $64,686 swing low to the $68,328 high.
Bitcoin price is now trading above $67,200 and the 100 hourly Simple moving average. There is also a connecting bullish trend line forming with support at $66,800 on the hourly chart of the BTC/USD pair.
On the upside, the price could face resistance near the $68,000 level. The first key resistance is near the $68,350 level. A clear move above the $68,350 resistance might send the price higher. The next key resistance could be $68,800.

A close above the $68,800 resistance might initiate more gains. In the stated case, the price could rise and test the $70,0200 resistance level. Any more gains might send the price toward the $72,000 resistance level.
Another Drop In BTC?
If Bitcoin fails to rise above the $68,000 resistance zone, it could start another decline. Immediate support on the downside is near the $66,800 level and the trend line.
The first major support is near the $66,500 level and the 50% Fib retracement level of the upward move from the $64,686 swing low to the $68,328 high. The next support is now near the $66,500 zone. Any more losses might send the price toward the $65,400 support in the near term.
Technical indicators:
Hourly MACD – The MACD is now losing pace in the bullish zone.
Hourly RSI (Relative Strength Index) – The RSI for BTC/USD is now above the 50 level.
Major Support Levels – $66,800, followed by $65,400.
Major Resistance Levels – $68,000, and $68,350.


Pi Network has been the subject of investor frustration due to its delayed mainnet launch and lack of Binance listing. Amidst all this, the token recently hit a new low before recovering sharply.
After a significant decline, the altcoin has surged by 36%, leaving investors to wonder if this marks the beginning of a reversal.
Pi Network Investors Are Optimistic
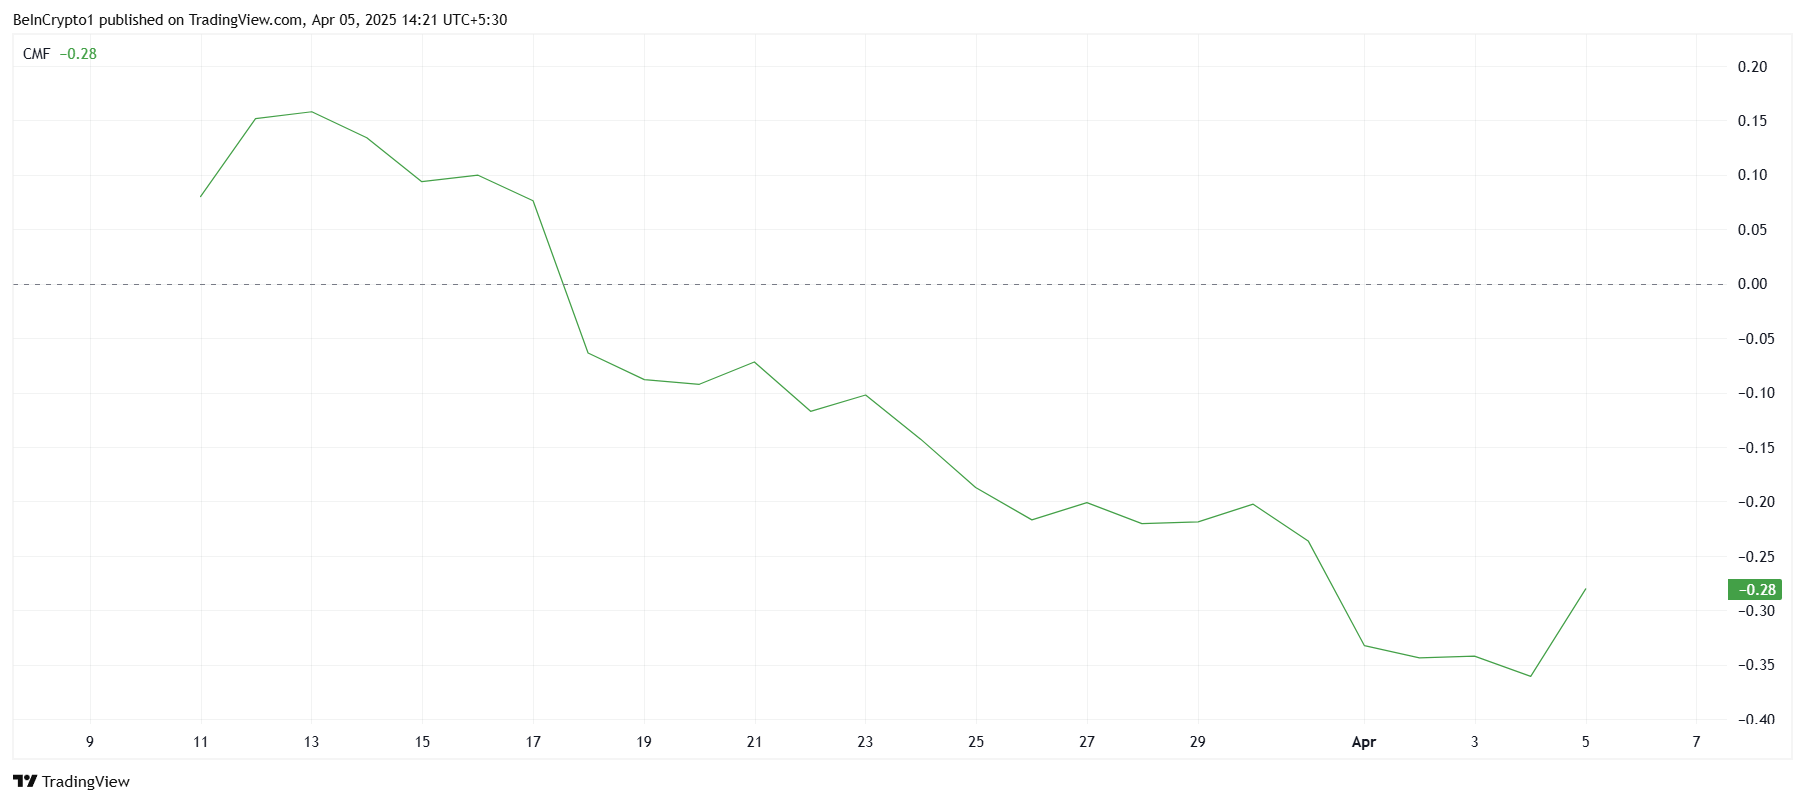
The Chaikin Money Flow (CMF) indicator is showing an uptick, signaling positive inflows into Pi Network at the time of writing. This shift suggests that investor confidence is returning, likely due to the altcoin hitting what seems to be its market bottom. With market conditions expected to improve, Pi Network appears to be positioned for a potential rally, with investors looking to capitalize on its current price.
Owing to the prolonged downtrend, these positive inflows indicate that market sentiment may be shifting. Investors who were previously hesitant may now be more willing to re-enter the market and seek profit.
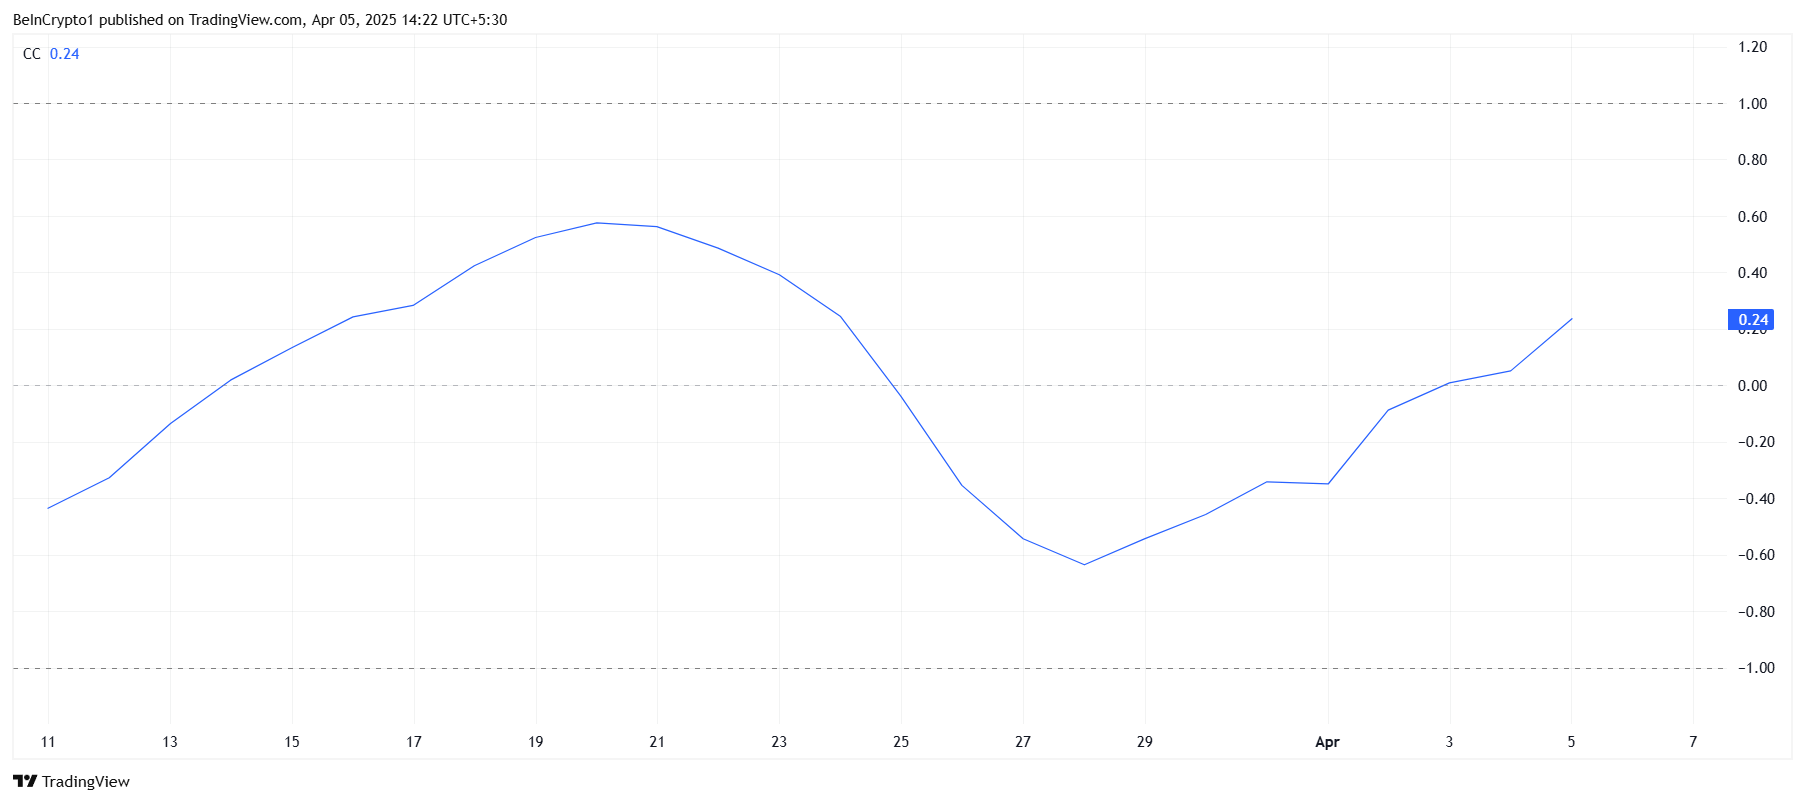
Pi Network’s correlation with Bitcoin has also shown signs of improvement, with the current correlation at 0.24. Although still low, this improvement suggests that Pi Network may begin to follow Bitcoin’s price movements. If Bitcoin experiences a significant rally, Pi Network could follow suit, benefiting from the broader market’s bullish momentum.
This increasing correlation could be crucial for Pi Network, as it indicates a stronger alignment with the larger crypto market. If Bitcoin’s price begins to surge, Pi Network’s recovery could gain additional momentum.
PI Price Is Bouncing Back
Pi Network’s price fell to a new all-time low of $0.40 during an intra-day low, marking a significant dip for the token. However, it quickly recovered, posting a 36% gain and reaching an intra-day high of $0.71.
This price movement shows that the altcoin is capable of rapid reversals, but it remains to be seen if this momentum will continue.
Given the positive indicators, Pi Network may continue its upward trajectory, potentially reaching the $0.87 level and even $1.00. These price points would represent a substantial recovery from its recent lows and may help restore investor confidence in the altcoin’s long-term viability.
However, the key factor will be whether it can maintain its upward movement.
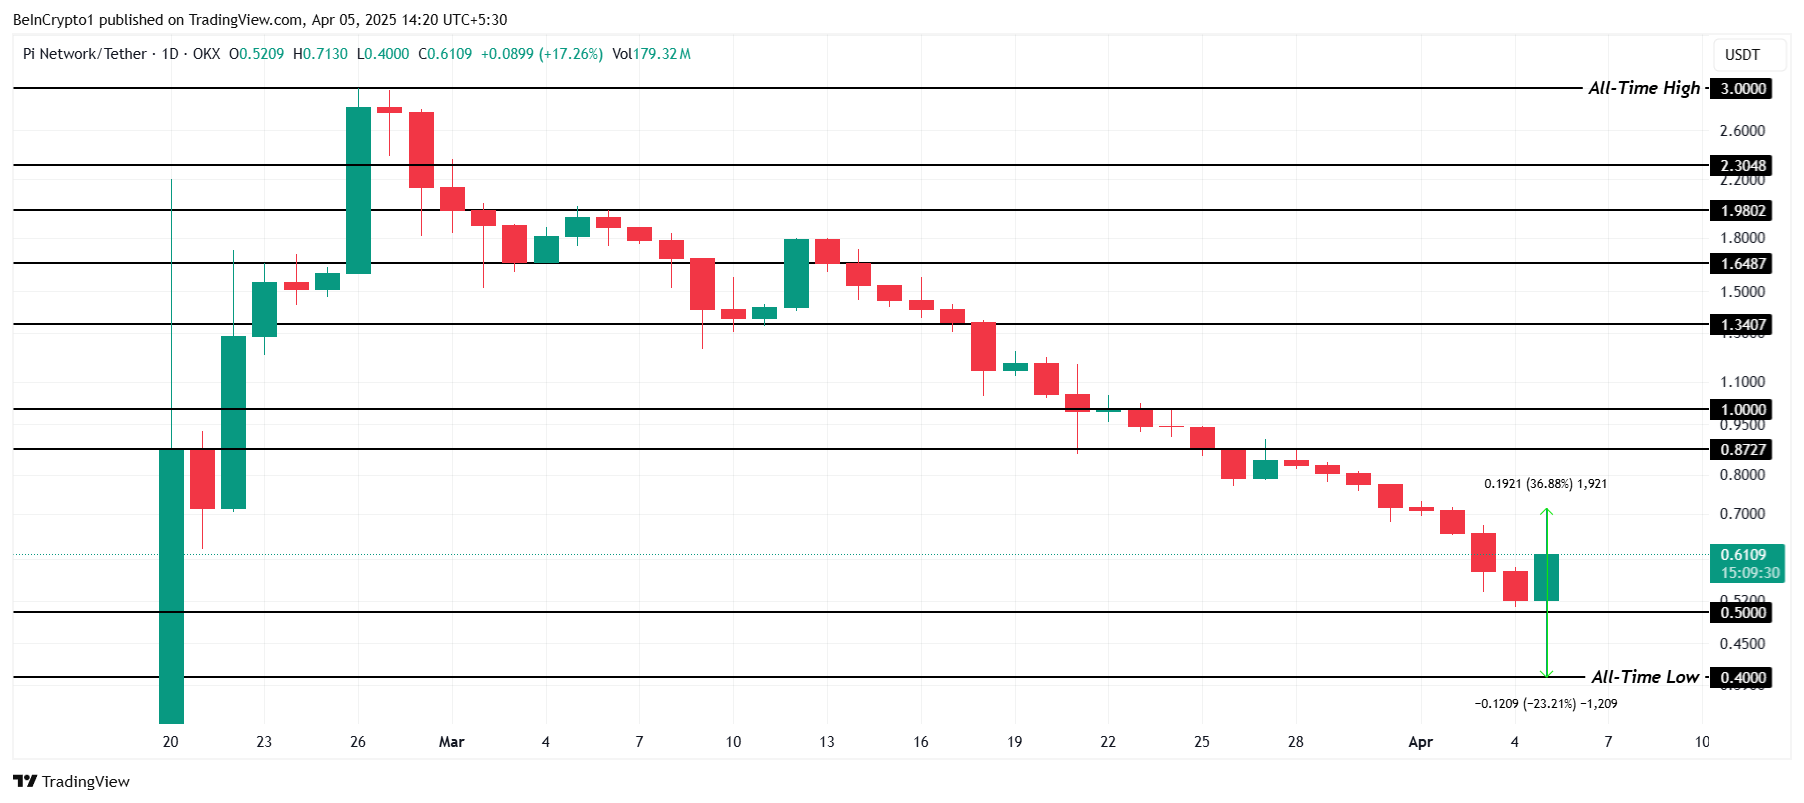
On the other hand, if bearish signals persist and Pi Network loses the support of $0.50, the altcoin may fall back to $0.40 or lower, invalidating the current bullish outlook. This scenario could bring further declines, extending the downtrend that investors have been watching closely.
Disclaimer
In line with the Trust Project guidelines, this price analysis article is for informational purposes only and should not be considered financial or investment advice. BeInCrypto is committed to accurate, unbiased reporting, but market conditions are subject to change without notice. Always conduct your own research and consult with a professional before making any financial decisions. Please note that our Terms and Conditions, Privacy Policy, and Disclaimers have been updated.
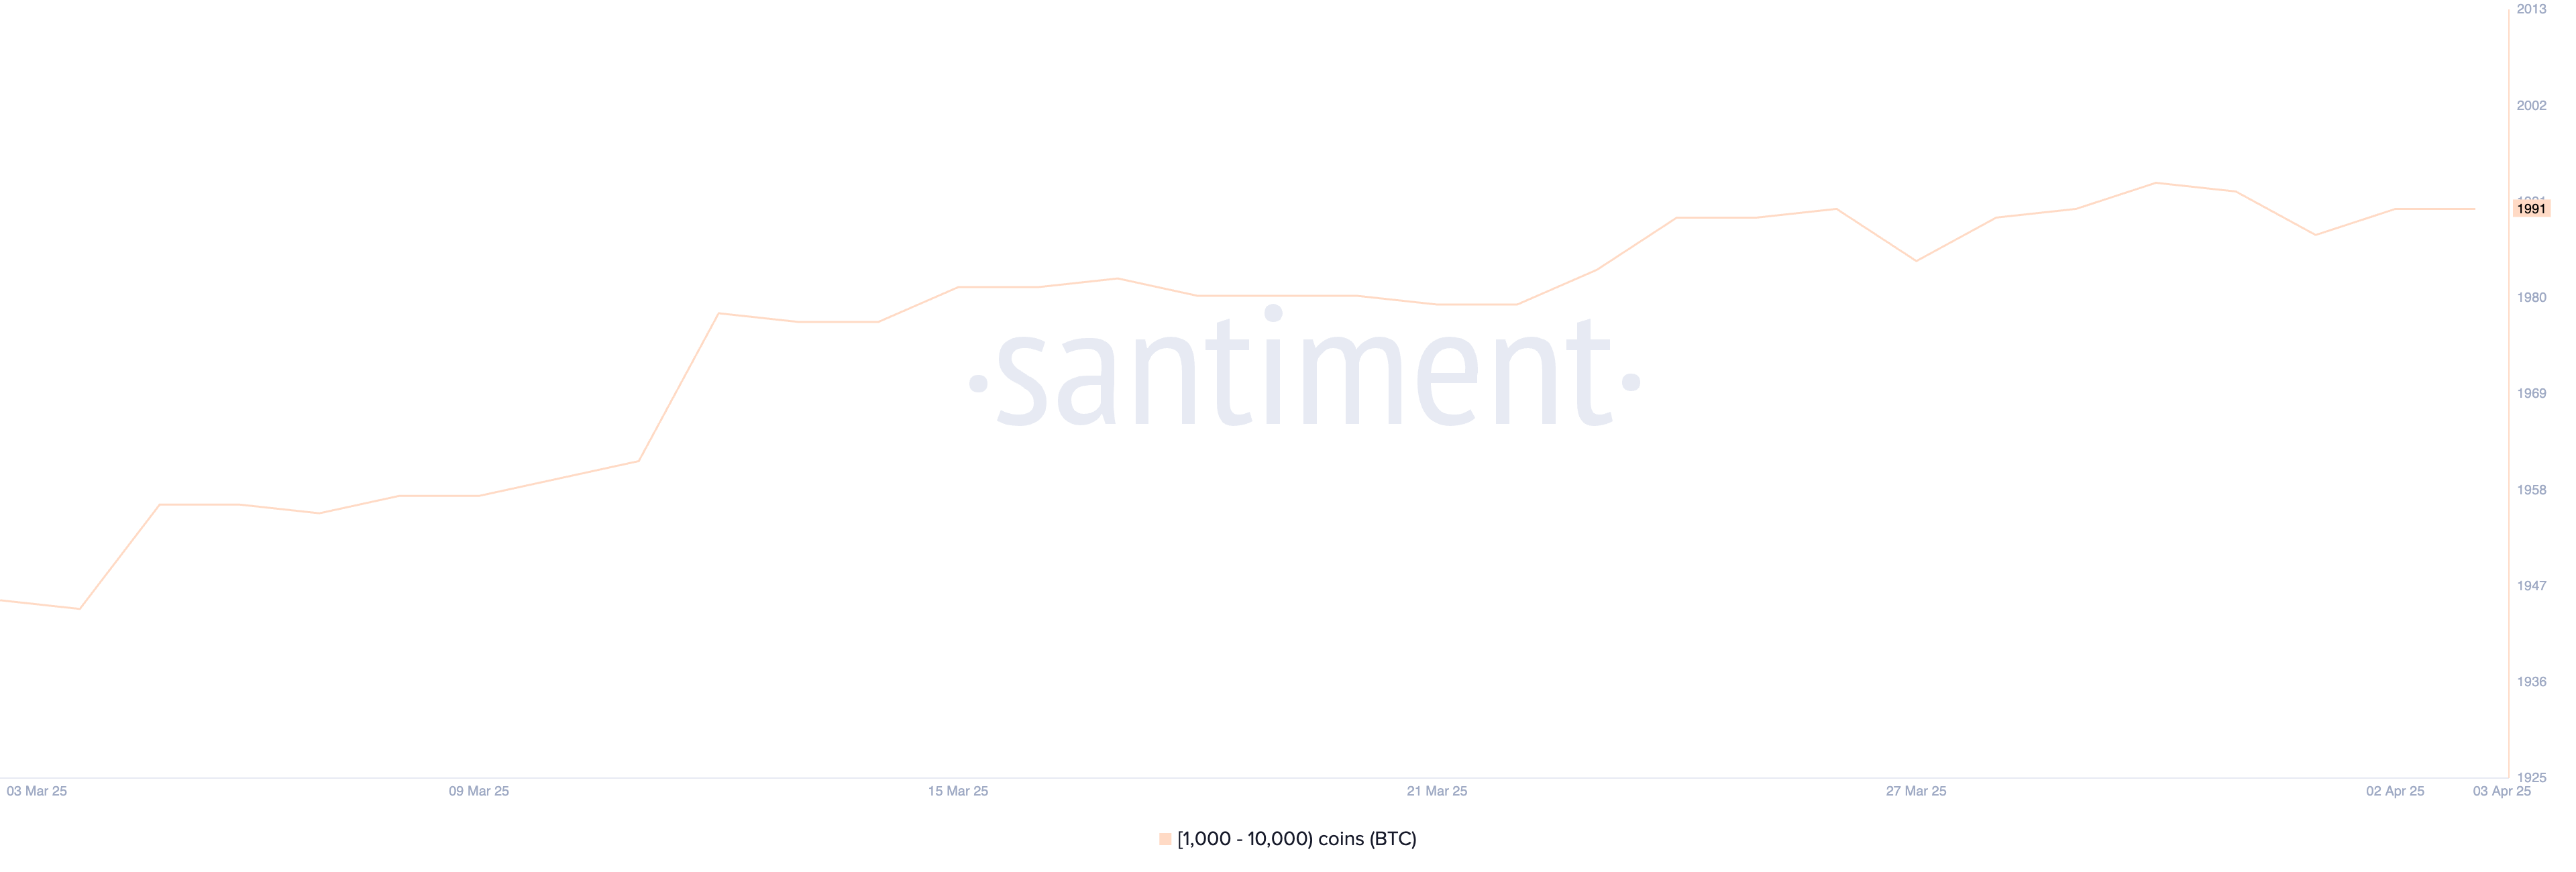
Bitcoin (BTC) continues to hover in a state of uncertainty as both whale activity and technical indicators point to a market lacking strong conviction. Large holders have remained inactive for over a week, with the number of whale wallets holding between 1,000 and 10,000 BTC steady at 1,991 since March 24.
Meanwhile, technical charts like the Ichimoku Cloud and EMA lines offer a mixed outlook, reflecting hesitation in both bullish and bearish directions. As BTC trades near key support and resistance levels, the coming days could determine whether April brings a breakout or deeper correction.
Bitcoin Whales Aren’t Accumulating
The number of Bitcoin whales—wallets holding between 1,000 and 10,000 BTC—currently stands at 1,991, a figure that has remained remarkably steady since March 24.
This level of consistency in large holder activity suggests that major players are neither aggressively accumulating nor offloading their positions.
Given the size of these holdings, even minor shifts in whale behavior can significantly impact the market. This stability is particularly noteworthy given recent volatility across the broader crypto market.
Tracking Bitcoin whales is crucial because these large holders often have the power to influence price action through their buying or selling decisions.
When whales accumulate BTC, it can signal confidence in future price appreciation, while large-scale selling can indicate upcoming downward pressure. The fact that the number of whales has remained stable for the last 11 days may suggest a period of consolidation, where big investors are waiting for a clearer macro or market signal before making their next move.
This could imply that major players see the current BTC price as fair value, potentially leading to a tightening of price action in the short term before a breakout in either direction.
BTC Ichimoku Cloud Shows A Mixed Picture
The current Ichimoku Cloud setup for Bitcoin shows a mixed but slightly cautious sentiment.
The price recently dipped below the red baseline (Kijun-sen), and despite a brief push into the cloud, it was rejected and fell back below it—indicating that bullish momentum lacked follow-through.
The blue conversion line (Tenkan-sen) is now trending downward and has crossed below the baseline, which often reflects short-term bearish momentum. Meanwhile, the Leading Span A (green cloud boundary) is starting to flatten, while Leading Span B (red boundary) remains relatively horizontal, forming a thin and neutral cloud ahead.
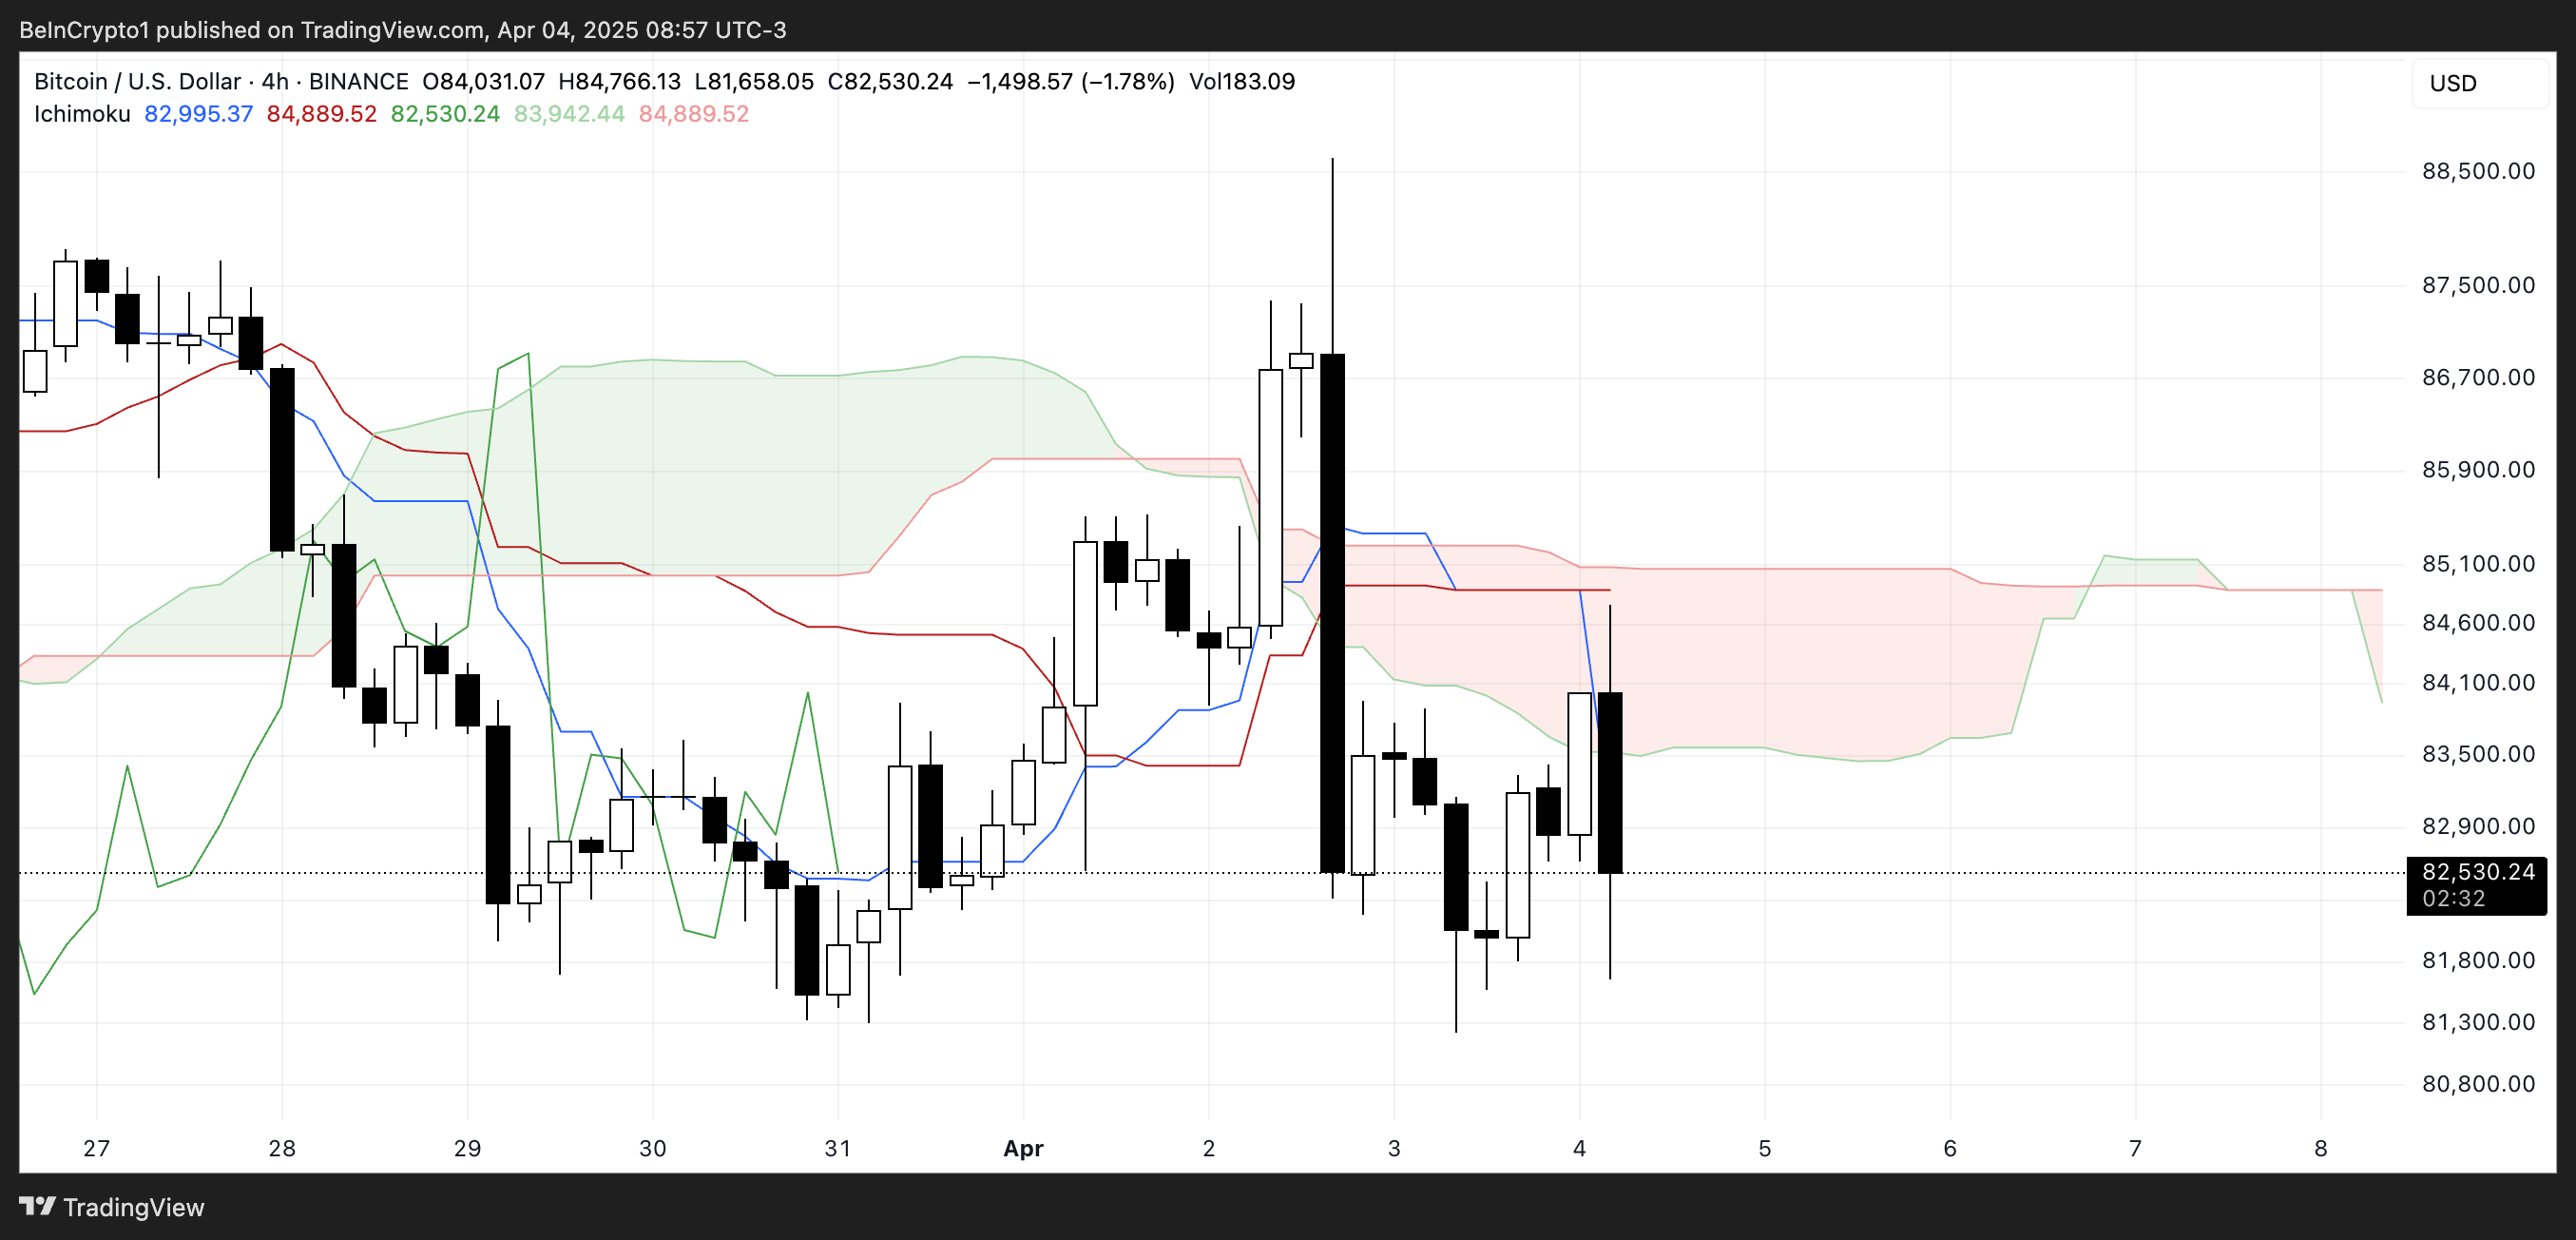
This type of thin, flat cloud suggests indecision in the market and a lack of strong trending momentum. The price hovering just below the cloud further reinforces the idea that BTC is in a consolidation phase rather than a clear trend.
If the price can break back above the cloud and maintain that level, it could signal renewed bullish strength.
However, continued rejection at the cloud and pressure from the falling Tenkan-sen could keep BTC in a corrective or sideways structure. For now, the Ichimoku setup reflects uncertainty, with no dominant trend confirmed in either direction.
Will Bitcoin Rise Back To $88,000 In April?
Bitcoin’s EMA structure still leans bearish overall, with longer-term EMAs positioned above the shorter-term ones. However, the recent upward movement in the short-term EMAs suggests that a rebound could be forming.
If this short-term strength develops into a sustained move, Bitcoin could first test the resistance at $85,103. A successful break above this level may signal a shift in momentum, opening the door to higher targets at $87,489. Recently, Standard Chartered predicted that BTC is likely to break $88,500 this weekend.
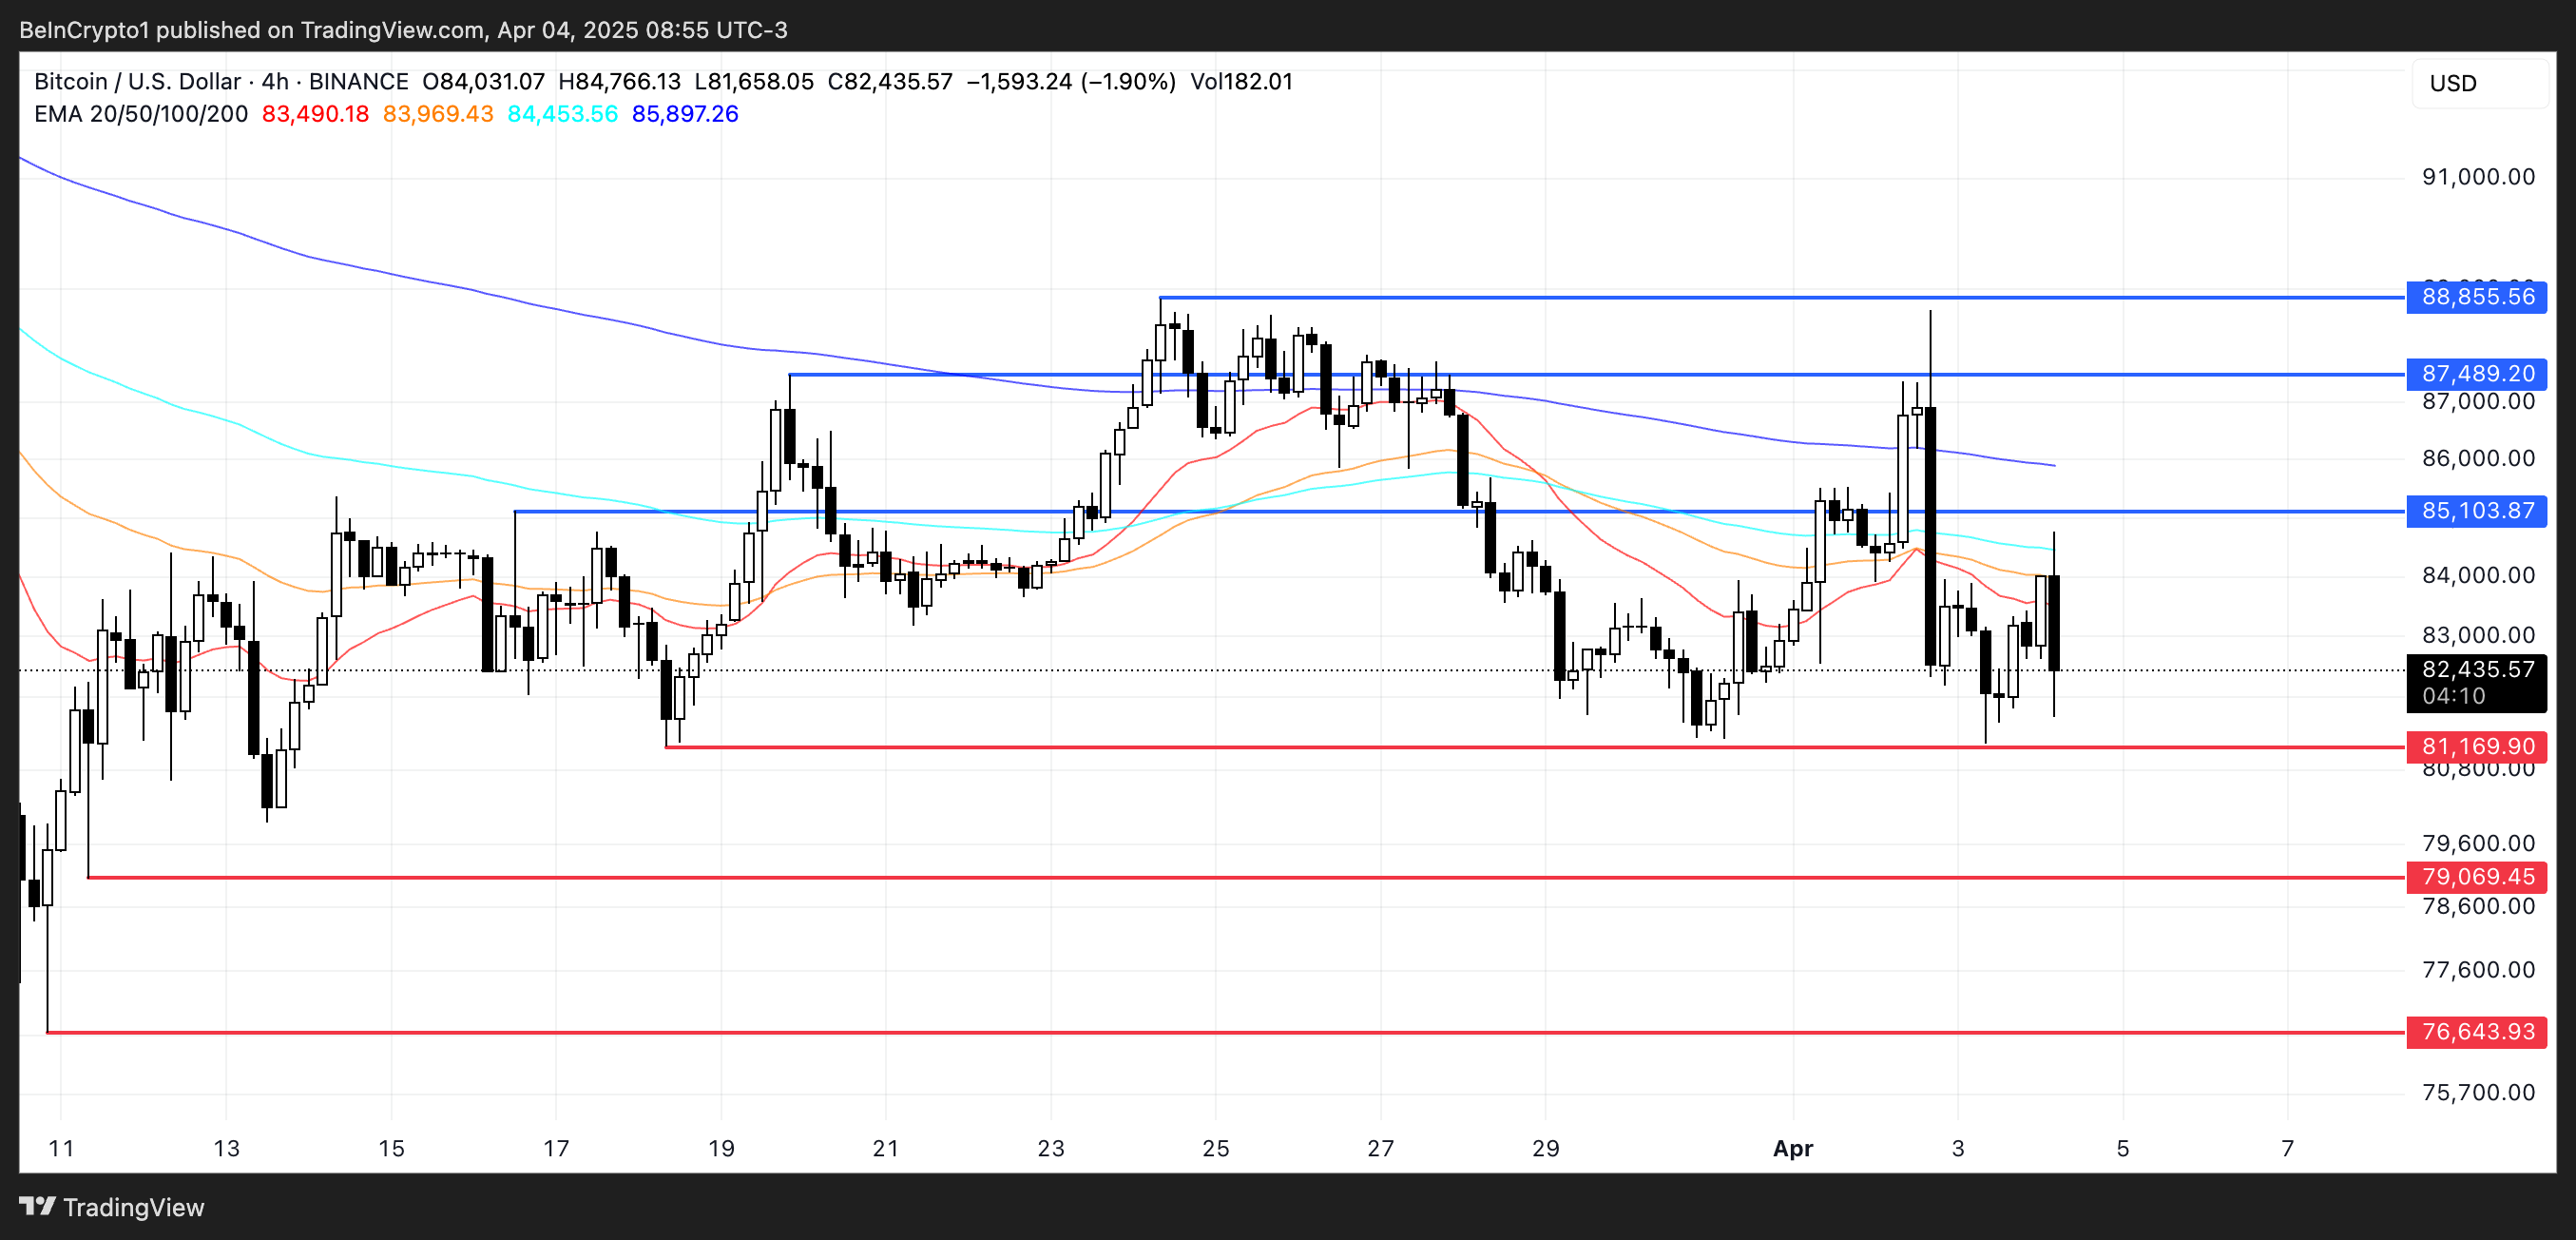
If bullish pressure remains strong beyond that point, Bitcoin price could push even further to challenge $88,855, a level that would mark a more convincing recovery from the recent pullback.
“(…) After Wednesday’s volatility, BTC has rebounded more than 4% and remains firmly above $79,000, with a key support level forming at $80,000 and slightly higher daily exchange volumes, which is a positive sign. On top of this, Bitcoin ETF flows suggest sentiment remains strong, with $220 million inflows on “Tariff Day”, April 2.,” Nic Puckrin, crypto analyst, investor, and founder of The Coin Bureau, told BeInCrypto.
However, if Bitcoin fails to build enough momentum for this rebound, downside risks remain. The first key level to watch is the support at $81,169.
As the trade war between China and the US escalates, a drop below this level could see BTC falling under the psychological $80,000 mark, with the next target around $79,069. If this zone is also lost, the bearish trend could intensify, sending BTC further down toward $76,643.
Disclaimer
In line with the Trust Project guidelines, this price analysis article is for informational purposes only and should not be considered financial or investment advice. BeInCrypto is committed to accurate, unbiased reporting, but market conditions are subject to change without notice. Always conduct your own research and consult with a professional before making any financial decisions. Please note that our Terms and Conditions, Privacy Policy, and Disclaimers have been updated.

Reason to trust
![]()
Strict editorial policy that focuses on accuracy, relevance, and impartiality
Created by industry experts and meticulously reviewed
The highest standards in reporting and publishing
Strict editorial policy that focuses on accuracy, relevance, and impartiality
Morbi pretium leo et nisl aliquam mollis. Quisque arcu lorem, ultricies quis pellentesque nec, ullamcorper eu odio.
A crypto analyst has shared insights into the recent strength in the XRP price, suggesting that South Korea may be the reason behind it. The analyst noted that the altcoin has been seeing high trading volume on South Korean exchanges, and this localized demand may be holding up its price while other altcoins struggle to gain traction.
How South Korea Is Bolstering The Price
According to XForceGlobal South Korea is currently one of the major drivers of the XRP price action. In a recent post on X (formerly Twitter), the analyst disclosed that the engagement and adoption from the crypto users in South Korea was a major contributor to XRP’s bullish performance.
Related Reading
Currently, South Korea is one of the most active crypto markets in the world, leading in global trading volume across multiple assets. However, among the numerous cryptocurrencies in the market, XRP stands out the most within the country. The analyst has revealed that even during low trading days, XRP frequently outpaces Bitcoin, underscoring its high demand and adoption in South Korea.
XForceGlobal has suggested that South Korea’s notable interest in XRP likely stems from its status as one of the most isolated countries in terms of crypto regulations. The analyst revealed that millions of citizens currently own the altcoin, making up about 20% of the cryptocurrency’s market cap valuation.
Moreover, due to a lack of large-scale cross-border payment solutions, most South Koreans opt to use cryptocurrencies like XRP to facilitate transactions. This, in turn, fuels adoption and strengthens the cryptocurrency’s utility, which positively influences its price action.
Compared to South Korea, the regulatory uncertainties and legal challenges in the United States (US) have slowed down XRP’s growth. XForceGlobal has stated that the active participation of retail institutions, strong community support, and early adoption in South Korea have helped prop up prices despite the difficulties it faced over the past years.
What The Future Holds For XRP In South Korea
While discussing the impact of South Korea’s support for XRP on its price action, XForceGlobal offered insights into the cryptocurrency’s future in the country. The analyst revealed that the market is at a pivotal moment where XRP has evolved from a speculative asset to a symbol of Korea’s dominance in the crypto market.
Related Reading
Currently, Upbit, the largest crypto exchange in South Korea, holds the most significant market share of XRP in terms of total supply. The exchange reportedly has about 6 billion XRP, accounting for roughly 5% of the entire supply.
XForceGlobal has revealed that the continued demand from retail investors combined with Upbit’s massive XRP reserve will make South Korea a key driver to the cryptocurrency’s global future price action.
Moving forward, the analyst has discussed XRP’s price movements on the Korean won chart, suggesting that its current action may be foreshadowing upcoming events. He pointed out that the altcoin has already formed a lower low on the chart, possibly hinting at a more controlled pullback rather than an impulsive decline — an outlook he described as “arguably bearish”.
The crypto analyst also noted that XRP may be forming a potential bottom on the Korean won chart, indicating a possible impulse to the upside and a bullish continuation.
Featured image from Adobe Stock, chart from Tradingview.com

Pi Network Hits New Low, Then Rallies 36%—What’s Next?

Ethereum Risks 15% Drop If It Doesn’t Reclaim Key Resistance

Bitcoin Hovers Over $80,000 as Whale Activity Drops

Big-Money Traders Buying ETH Dip

Pi Network on Free Fall, 4 Reasons Pi Coin Price Going to $0.1
5 Facts About Bitcoin’s Creator

2.52 Million Altcoins Are Ruining Crypto’s Future

Animoca Brands Valuation Tanks 75% In Two Years, Here’s Why

Crypto exchange BingX hacked for $43 million

Are The Big Players Losing Interest?

Hong Kong’s Securities Association Tips Authorities On Crypto Self-Regulation

Coinbase cbBTC Set to go Live on Solana
2.52 Million Altcoins Are Ruining Crypto’s Future
Animoca Brands Valuation Tanks 75% In Two Years, Here’s Why
Crypto exchange BingX hacked for $43 million
Are The Big Players Losing Interest?
Hong Kong’s Securities Association Tips Authorities On Crypto Self-Regulation
Coinbase cbBTC Set to go Live on Solana
-
 Market24 hours ago
Standard Chartered Calls for Bitcoin Push Above $88,500
-

 Bitcoin22 hours ago
Bitcoin Drops as China Escalates Trade War With 34% Tariff on US
-

 Market22 hours ago
Bitcoin is Far From a Bear Market But not Altcoins, Analysts Claim
-
 Bitcoin21 hours ago
Why Bitcoin Is Gaining Appeal Amid Falling US Treasury Yields
-
 Altcoin14 hours ago
Analyst Predicts XRP Price To Reach Double Digits By July 21 Cycle Peak
-

 Market19 hours ago
Will the SEC Approve Grayscale’s Solana ETF?
-

 Ethereum17 hours ago
Ethereum Whales Buy the Dip – Over 130K ETH Added In A Single Day
-

 Bitcoin17 hours ago
Vitalik’s L2 Roadmap, XRP Unlock and More