
Market
Which Ones Are the Top 3?

Several altcoins are trending today, despite prices being lower than at the week’s start. While the reasons may seem unclear to some, CoinGecko has identified the top three trending altcoins as (WELSH), Turbo (TURBO), and MAGA Hat (MAGA).
This analysis by BeInCrypto explores the factors behind the growing attention these altcoins are attracting, offering insights into their market movements and underlying trends.
Welshcorgicoin (WELSH) Leads the Trending Altcoins List
WELSH is trending primarily due to its impressive price action. Over the past 30 days, the altcoin has surged by 96%, catching the attention of investors.
Although it remains relatively unknown in the broader market, WELSH has carved out a niche for itself. The project claimed it is the first dog-themed Bitcoin meme coin secured on the Stacks network. This unique positioning has contributed to its rising popularity and price momentum.
Currently, WELSH’s price is $0.0033, and its self-reported market cap is $31.55 million. The altcoin experienced a significant rally, climbing by 110% between September 18 and Monday, September 14. However, in the last 24 hours, it has given back 2% of those gains.
Read more: Top 9 Safest Crypto Exchanges in 2024
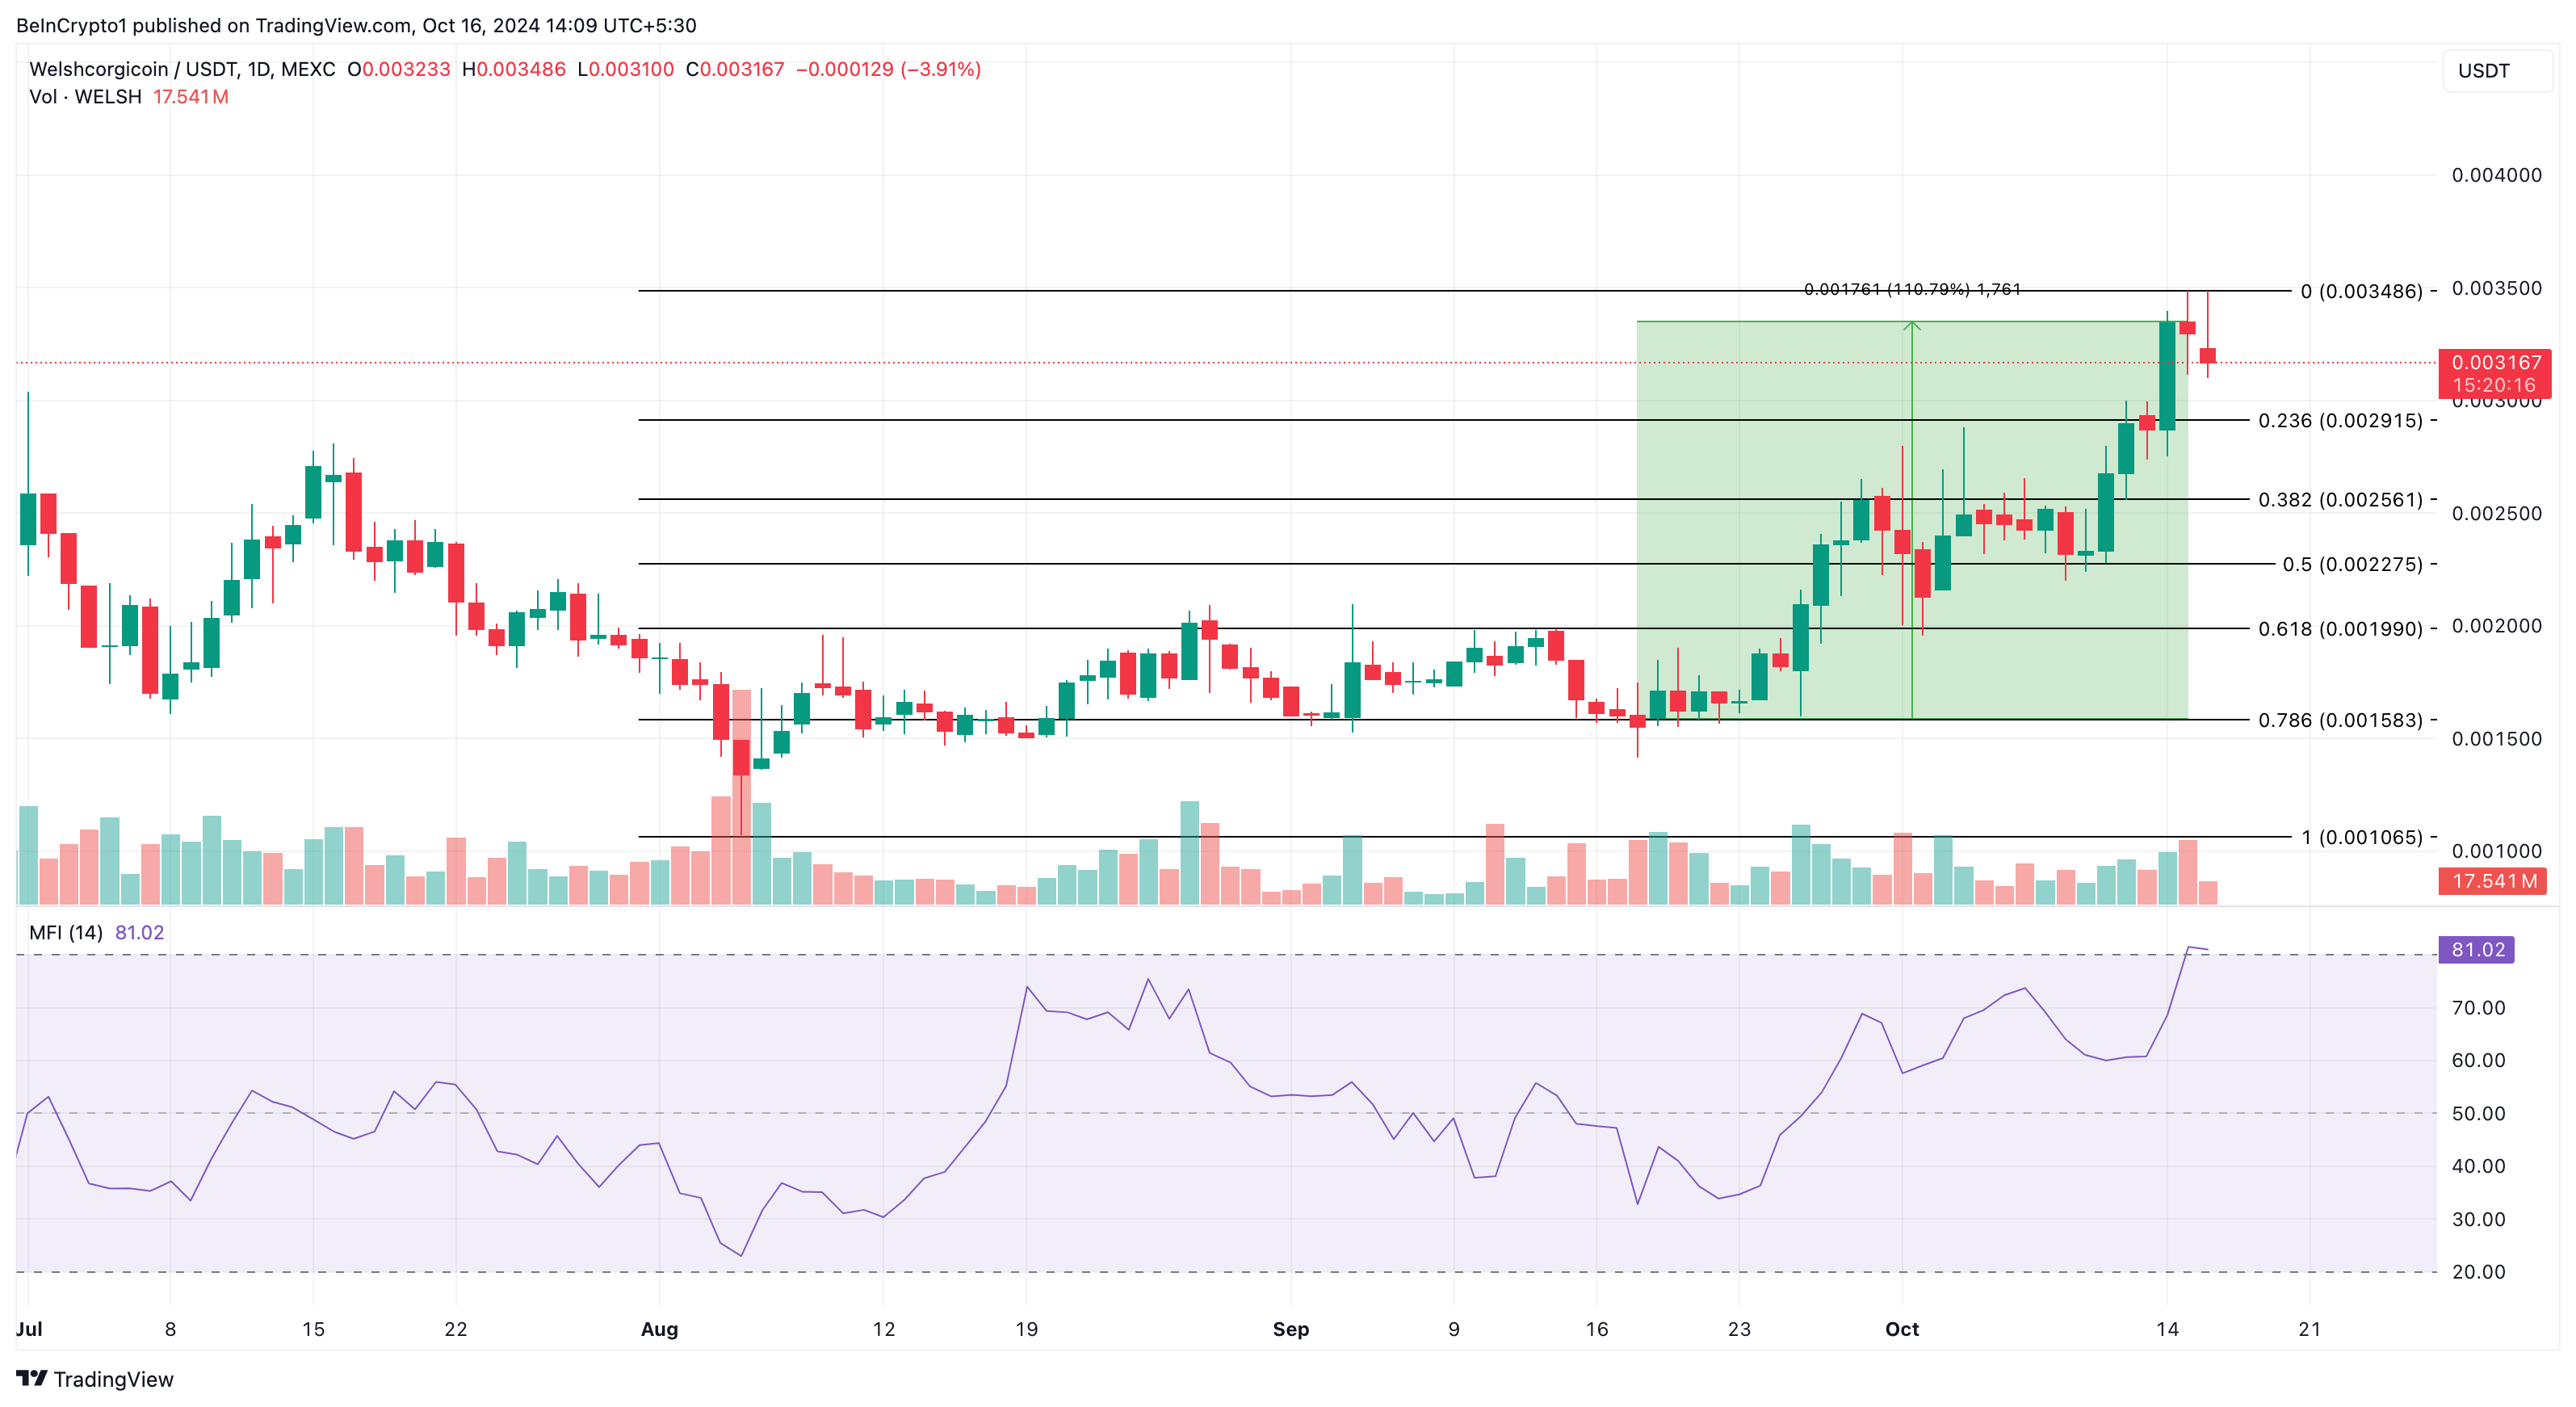
One possible reason for this recent drawdown is the Money Flow Index (MFI). The MFI is a technical indicator that measures buying and selling pressure. Beyond that, it also indicates whether an asset is overbought or oversold.
When the Money Flow Index (MFI) is below 20.00, the asset is considered oversold. Readings above 80.00 indicate an overbought condition. Given the current MFI readings, WELSH could be approaching an overbought territory. This suggests the possibility of a short-term decline. If this trend continues, the price might drop to $0.0026 in the near term.
On the other hand, if buying pressure picks up and profit-taking eases, the cryptocurrency could see a price rally beyond the $0.0035 mark, potentially resuming its upward momentum.
Turbo (TURBO) Has to Thank Binance
TURBO, which brands itself as “the first meme coin created by AI,” is gaining attention as one of the top trending altcoins today. The surge in interest comes after Binance announced the expansion of trading pairs for TURBO on October 15, fueling speculation about its potential in the market.
However, TURBO’s price movement also contributes to its trending status, with a 47.45% increase over the past week. Currently trading at $0.011, the cryptocurrency has seen an 8% decline in the last 24 hours.
This pullback may be attributed to increasing selling pressure. Spot On Chain, in a post on X earlier today, revealed that a wallet linked to the project deposited 810 million tokens to Binance and OKX exchanges. While this move has fueled speculation, the platform indicated that such transfers appear to be a regular occurrence whenever TURBO reaches new price peaks.
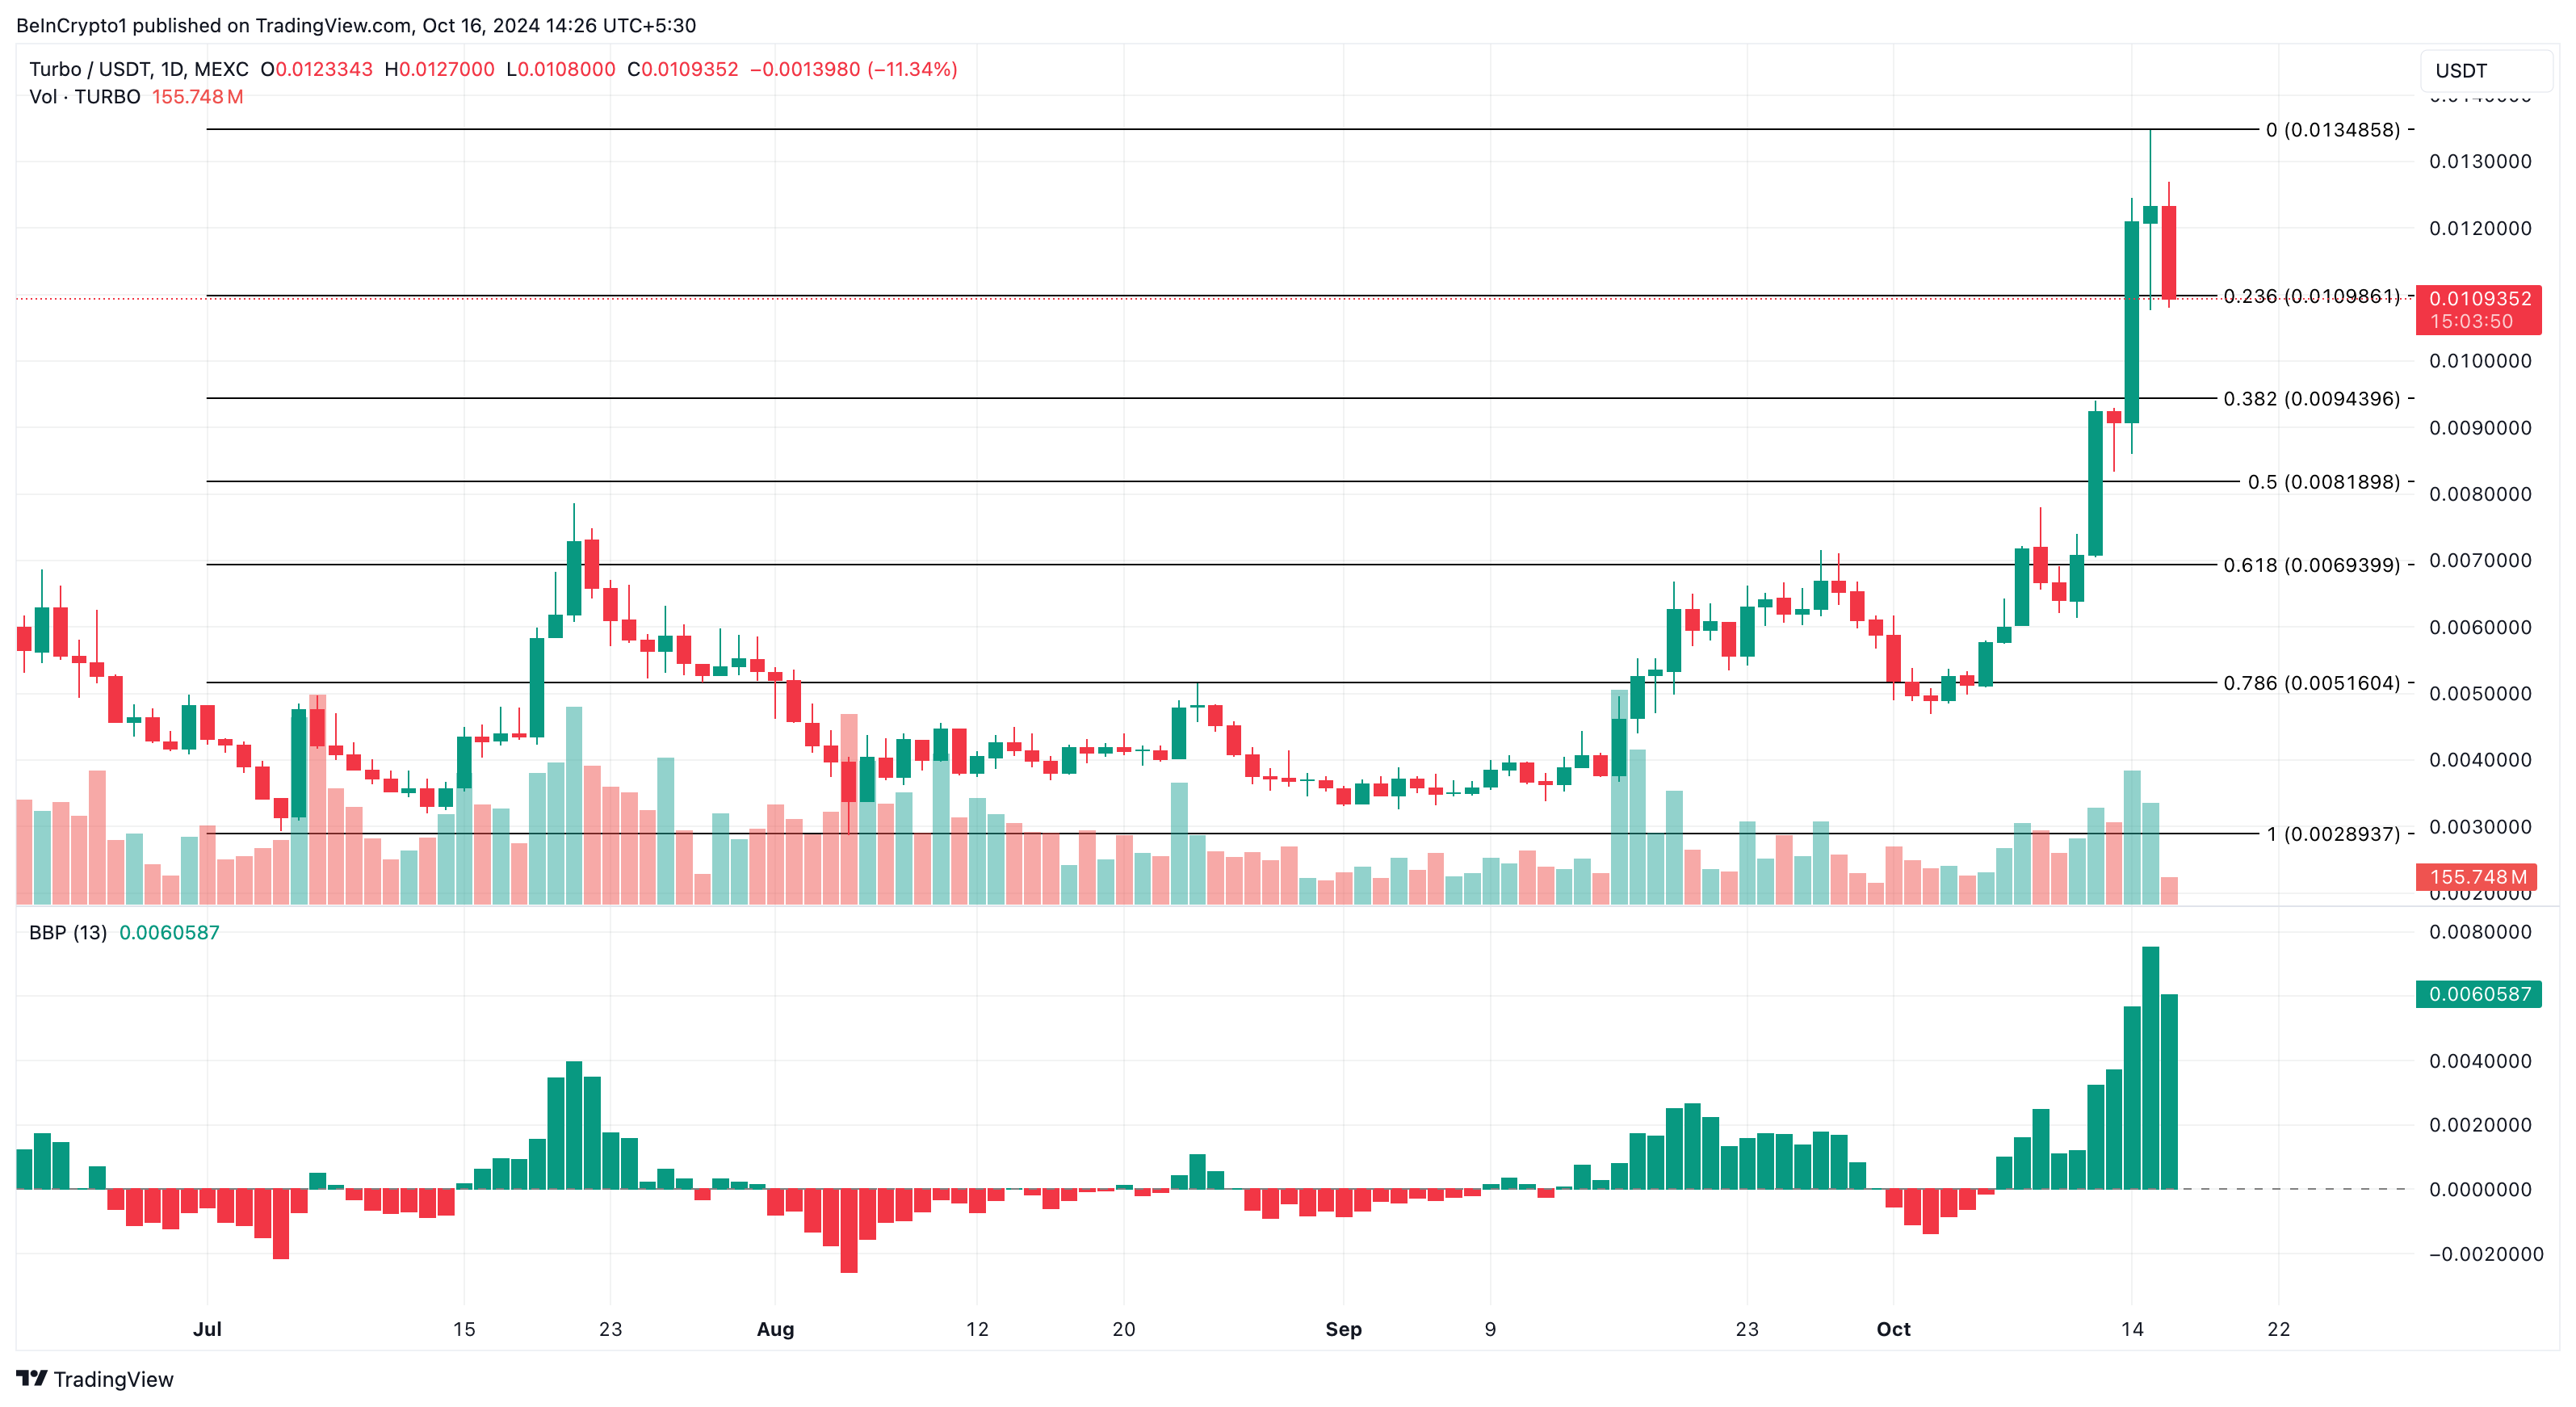
From a technical perspective, the Bull Bear Power (BBP) shows that bulls appear determined to send the altcoin back higher. This is because the BBP reading is green, showing the rising strength of buyers in the market.
If sustained, TURBO’s price could climb to $0.013. However, if bears overpower bullish power, this prediction might be invalidated. Instead, the altcoin’s price might decline to $0.0069.
MAGA Hat (MAGA) Gets More Attention as US Elections Near
The upcoming US election and the possibility of a Trump victory have made MAGA one of the top-trending cryptocurrencies today. With the election just 20 days away and Trump leading in the polls, MAGA and related altcoins have garnered significant attention.
However, MAGA’s price has dropped 17% in the past seven days, currently trading at $0.00013. It is now hovering near the 20-day Exponential Moving Average (EMA), which often signals a bearish trend when breached. If MAGA’s price falls below this key support level, the next target could be $0.00010, indicating a deeper correction and further bearish momentum.
Conversely, if MAGA’s price holds above the 20 EMA, which is still above the 50 EMA, the downward trend might reverse. In that case, MAGA could climb to $0.00019, signaling potential recovery.
Read more: Which Are the Best Altcoins To Invest in October 2024?
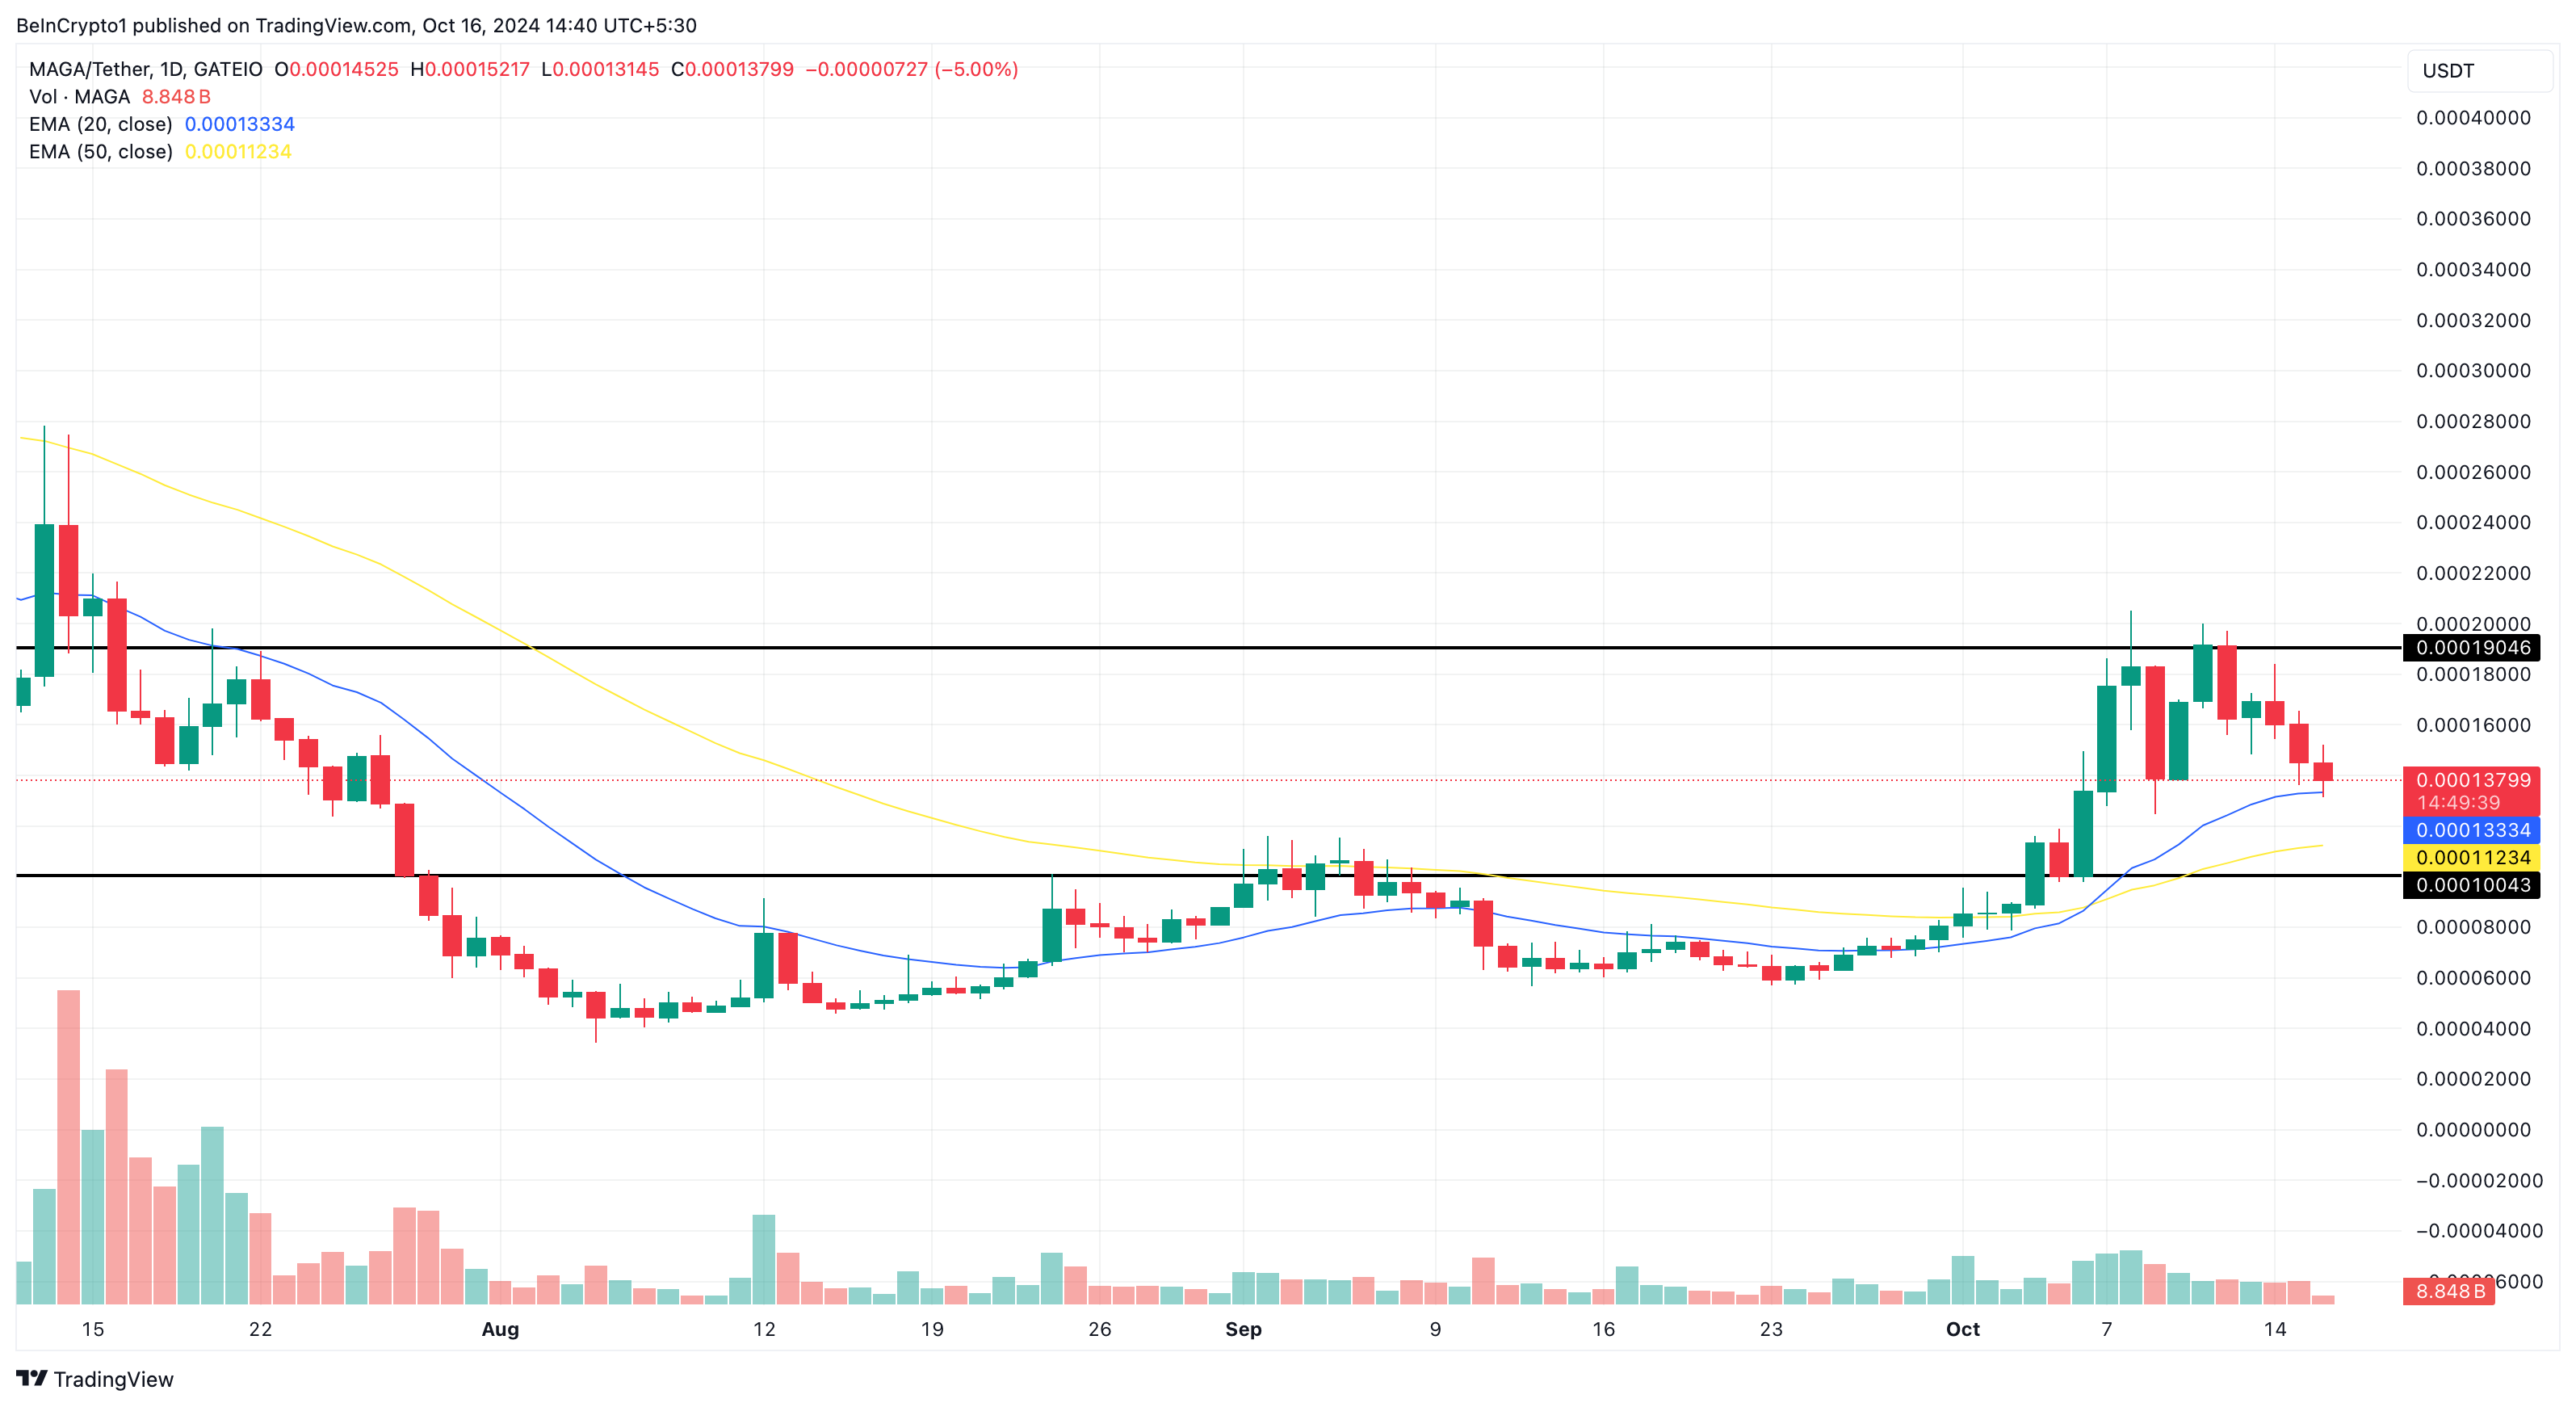
On the other hand, if the 20 EMA remains above the 50 EMA (yellow) and MAGA’s price stays above both indicators, the forecast might not come to pass. Instead, the price might climb to $0.00019.
Disclaimer
In line with the Trust Project guidelines, this price analysis article is for informational purposes only and should not be considered financial or investment advice. BeInCrypto is committed to accurate, unbiased reporting, but market conditions are subject to change without notice. Always conduct your own research and consult with a professional before making any financial decisions. Please note that our Terms and Conditions, Privacy Policy, and Disclaimers have been updated.


Dogecoin declined heavily below the $0.280 support against the US Dollar. DOGE is now recovering and might face hurdles near $0.270.
- DOGE price started a fresh decline below the $0.2850 and $0.2650 support levels.
- The price is trading below the $0.280 level and the 100-hourly simple moving average.
- There is a major bearish trend line forming with resistance at $0.270 on the hourly chart of the DOGE/USD pair (data source from Kraken).
- The price could start another increase if it clears the $0.250 and $0.270 resistance levels.
Dogecoin Price Dives 30%
Dogecoin price started a fresh decline from the $0.3250 resistance zone, like Bitcoin and Ethereum. DOGE dipped below the $0.300 and $0.2750 support levels. It even spiked below $0.220.
The price declined over 25% and tested the $0.20 zone. A low was formed at $0.20 and the price is now rising. There was a move above the 23.6% Fib retracement level of the downward move from the $0.3416 swing high to the $0.20 low.
Dogecoin price is now trading above the $0.280 level and the 100-hourly simple moving average. Immediate resistance on the upside is near the $0.250 level. The first major resistance for the bulls could be near the $0.260 level.
The next major resistance is near the $0.270 level or the 50% Fib retracement level of the downward move from the $0.3416 swing high to the $0.20 low. There is also a major bearish trend line forming with resistance at $0.270 on the hourly chart of the DOGE/USD pair.

A close above the $0.270 resistance might send the price toward the $0.2880 resistance. Any more gains might send the price toward the $0.30 level. The next major stop for the bulls might be $0.320.
Another Decline In DOGE?
If DOGE’s price fails to climb above the $0.250 level, it could start another decline. Initial support on the downside is near the $0.2250 level. The next major support is near the $0.2150 level.
The main support sits at $0.20. If there is a downside break below the $0.20 support, the price could decline further. In the stated case, the price might decline toward the $0.1880 level or even $0.1650 in the near term.
Technical Indicators
Hourly MACD – The MACD for DOGE/USD is now gaining momentum in the bearish zone.
Hourly RSI (Relative Strength Index) – The RSI for DOGE/USD is now below the 50 level.
Major Support Levels – $0.2250 and $0.2150.
Major Resistance Levels – $0.2500 and $0.2700.
Senator Cynthia Lummis has stated that the Strategic Bitcoin Reserve could serve as a financial safeguard and a means to address past generations’ fiscal mismanagement.
Lummis believes such a reserve could help rectify the economic burdens placed on younger generations, particularly the national debt.
Senator Lummis’ Bitcoin Reserve Push
In a recent interview, Lummis explained that a Strategic Bitcoin Reserve could cut the current debt in half. In 2025, the US national debt is over $36 trillion.
Lummis suggested the US could leverage Bitcoin’s appreciation to support the US dollar as the world’s reserve currency. She considers it crucial for maintaining economic stability and favorable trade advantages.
“It ensures that the US dollar is the most accepted currency worldwide, and then with Bitcoin underpinning it and being also a global means of exchange and store of value, gives us that double support for the US dollar,” Lummis said.
In addition, she referenced Bitcoin’s historical annual growth rate of approximately 55%. However, she acknowledged that this rate will gradually decline. According to Lummis, it could decrease to 45%, 35%, 25%, and so on over the next two decades.
Despite a declining growth curve, the Senator believes a $1 million Bitcoin reserve today could be worth roughly half of the US national debt in 20 years. She also noted that Robert F. Kennedy Jr. used a similar model. Therefore, Lummis projected that a larger reserve could potentially eliminate the entire debt.
“I look at a Strategic Bitcoin Reserve and its ability to grow and help me right the wrongs that my generation did by driving us into this terrible debt. It’s the only vehicle I see that can have that consequential effect,” she said.
On July 31, 2024, Senator Lummis introduced the BITCOIN Act, proposing the establishment of a 1 million Bitcoin reserve. Last month, she also became the first chair of the Senate Banking Subcommittee on Digital Assets.
Meanwhile, support for a Strategic Bitcoin Reserve is growing. At the state level, 15 states have publicly endorsed it, Satoshi Action Fund’s founder, Dennis Porter, shared on X (formerly Twitter).
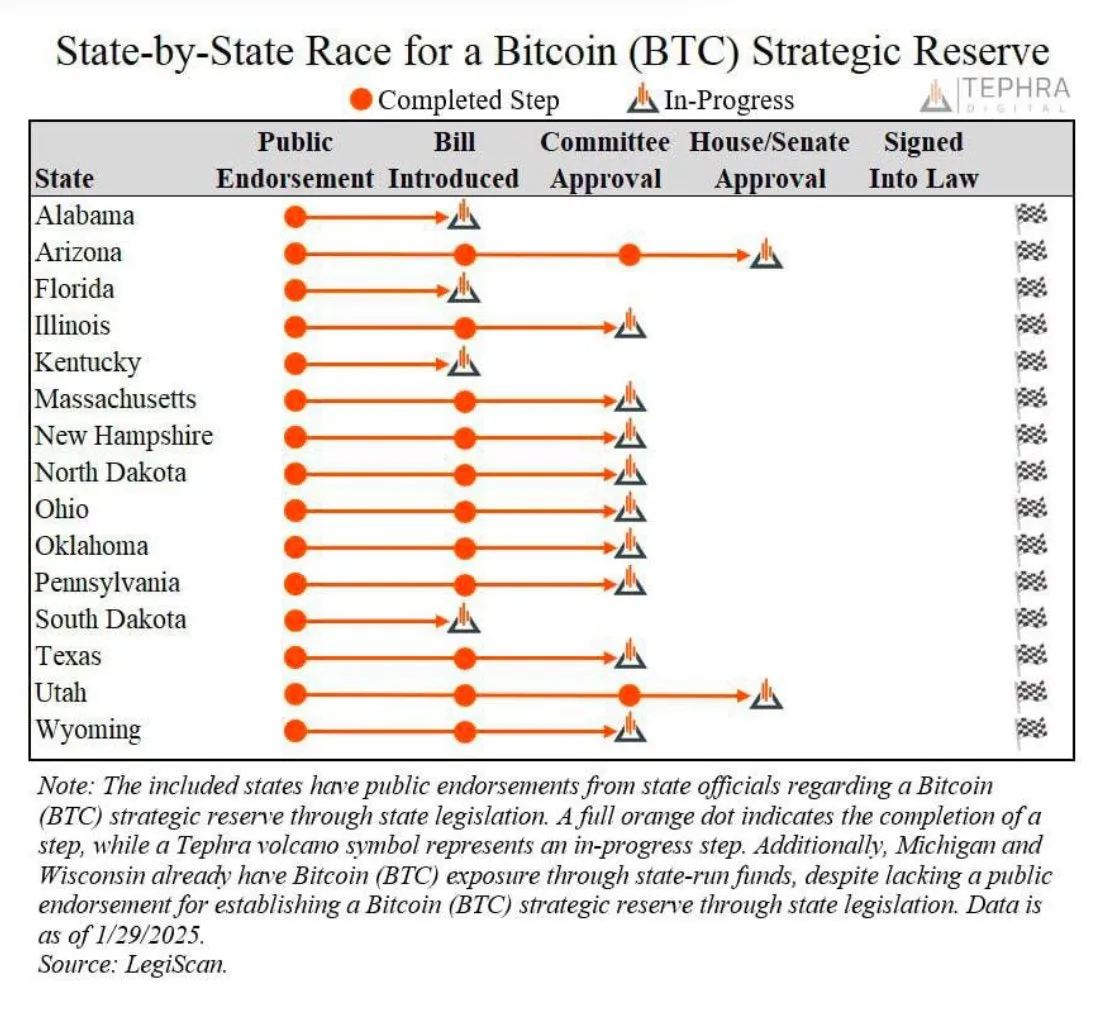
At least 11 states have introduced bills to establish a Strategic Bitcoin Reserve. Furthermore, Arizona and Utah have approved their proposals through committees.
According to Porter, more than 3,300 letters have been sent to Members of Congress advocating for Bitcoin to be recognized as part of a strategic stockpile. This comes after President Donald Trump signed an executive order to establish a “national digital asset stockpile” without specifying Bitcoin.
Disclaimer
In adherence to the Trust Project guidelines, BeInCrypto is committed to unbiased, transparent reporting. This news article aims to provide accurate, timely information. However, readers are advised to verify facts independently and consult with a professional before making any decisions based on this content. Please note that our Terms and Conditions, Privacy Policy, and Disclaimers have been updated.

XRP price started a major decline below the $3.00 zone. The price is down over 25% and there was a spike below the $2.00 support zone.
- XRP price started a fresh decline below the $2.80 and $2.50 levels.
- The price is now trading below $2.60 and the 100-hourly Simple Moving Average.
- There is a connecting bearish trend line forming with resistance at $2.45 on the hourly chart of the XRP/USD pair (data source from Kraken).
- The pair might start a fresh increase if it clears the $2.50 resistance zone.
XRP Price Eyes Recovery
XRP price started a fresh decline below the $3.00 zone, like Bitcoin and Ethereum. The price declined heavily below the $2.80 and $2.50 support levels. The bears even pushed it below $2.00.
There was a sharp drop of over 25% and the price tested the $1.75 zone. A low was formed at $1.75 and the price is now correcting some losses. There was a move above the $2.00 level. The price surpassed the 23.6% Fib retracement level of the downward move from the $3.155 swing high to the $1.750 low.
The price is now trading below $2.750 and the 100-hourly Simple Moving Average. On the upside, the price might face resistance near the $2.30 level. The first major resistance is near the $2.40 level.
The next resistance is $2.450. There is also a connecting bearish trend line forming with resistance at $2.45 on the hourly chart of the XRP/USD pair. It is close to the 50% Fib retracement level of the downward move from the $3.155 swing high to the $1.750 low.

A clear move above the $2.450 resistance might send the price toward the $2.50 resistance. Any more gains might send the price toward the $2.650 resistance or even $2.720 in the near term. The next major hurdle for the bulls might be $3.00.
Another Decline?
If XRP fails to clear the $2.40 resistance zone, it could start another decline. Initial support on the downside is near the $2.10 level. The next major support is near the $2.00 level.
If there is a downside break and a close below the $2.00 level, the price might continue to decline toward the $1.850 support. The next major support sits near the $1.750 zone.
Technical Indicators
Hourly MACD – The MACD for XRP/USD is now gaining pace in the bearish zone.
Hourly RSI (Relative Strength Index) – The RSI for XRP/USD is now below the 50 level.
Major Support Levels – $2.10 and $2.00.
Major Resistance Levels – $2.40 and $2.50.

Dogecoin (DOGE) Plunges to $0.20: Is This the Bottom or More Pain Ahead?

Why Are Dogecoin and Shiba Inu Price Crashing Over 25% Today?
Cutting US Debt? Senator Lummis Bets on Bitcoin Reserve

Bitcoin Crashes To $93K In Market Shake-Up

Dogecoin Price Bullish Ahead Of Important Date, Why Is February 4th So Important?

XRP Price Crashes Hard: Is There a Recovery in Sight?

2.52 Million Altcoins Are Ruining Crypto’s Future

Animoca Brands Valuation Tanks 75% In Two Years, Here’s Why

Crypto exchange BingX hacked for $43 million

Are The Big Players Losing Interest?

Hong Kong’s Securities Association Tips Authorities On Crypto Self-Regulation

Coinbase cbBTC Set to go Live on Solana
2.52 Million Altcoins Are Ruining Crypto’s Future
Animoca Brands Valuation Tanks 75% In Two Years, Here’s Why
Crypto exchange BingX hacked for $43 million
Are The Big Players Losing Interest?
Hong Kong’s Securities Association Tips Authorities On Crypto Self-Regulation
Coinbase cbBTC Set to go Live on Solana
-

 Ethereum21 hours ago
Ethereum Remains Largely Uncorrelated To Bitcoin – Data Shows ETH Tied To Other Coins
-

 Bitcoin21 hours ago
El Salvador Purchased 50 Bitcoin in a Month Amid Changing Laws
-

 Market21 hours ago
Crypto AI Agents Tumble as Market Cap Shrinks 15% In 24 Hours
-
 Altcoin23 hours ago
TRUMP Price Crashes 13% Despite Donald Trump’s Pump Attempt, What’s Next?
-
 Bitcoin17 hours ago
Bitcoin Slips to $98,000 Amid Market Sell-Off and Declining Activity
-

 Market20 hours ago
XRP At Critical Juncture As Price Restests 21 EMA
-
 Altcoin24 hours ago
Why Is Crypto Market Down Today, Will Trade War Trigger Major Crash Ahead?
-
 Market17 hours ago
Sam Bankman-Fried Demands Retrial Under a New Judge