
Market
Can SUI Price Reclaim All-Time High?

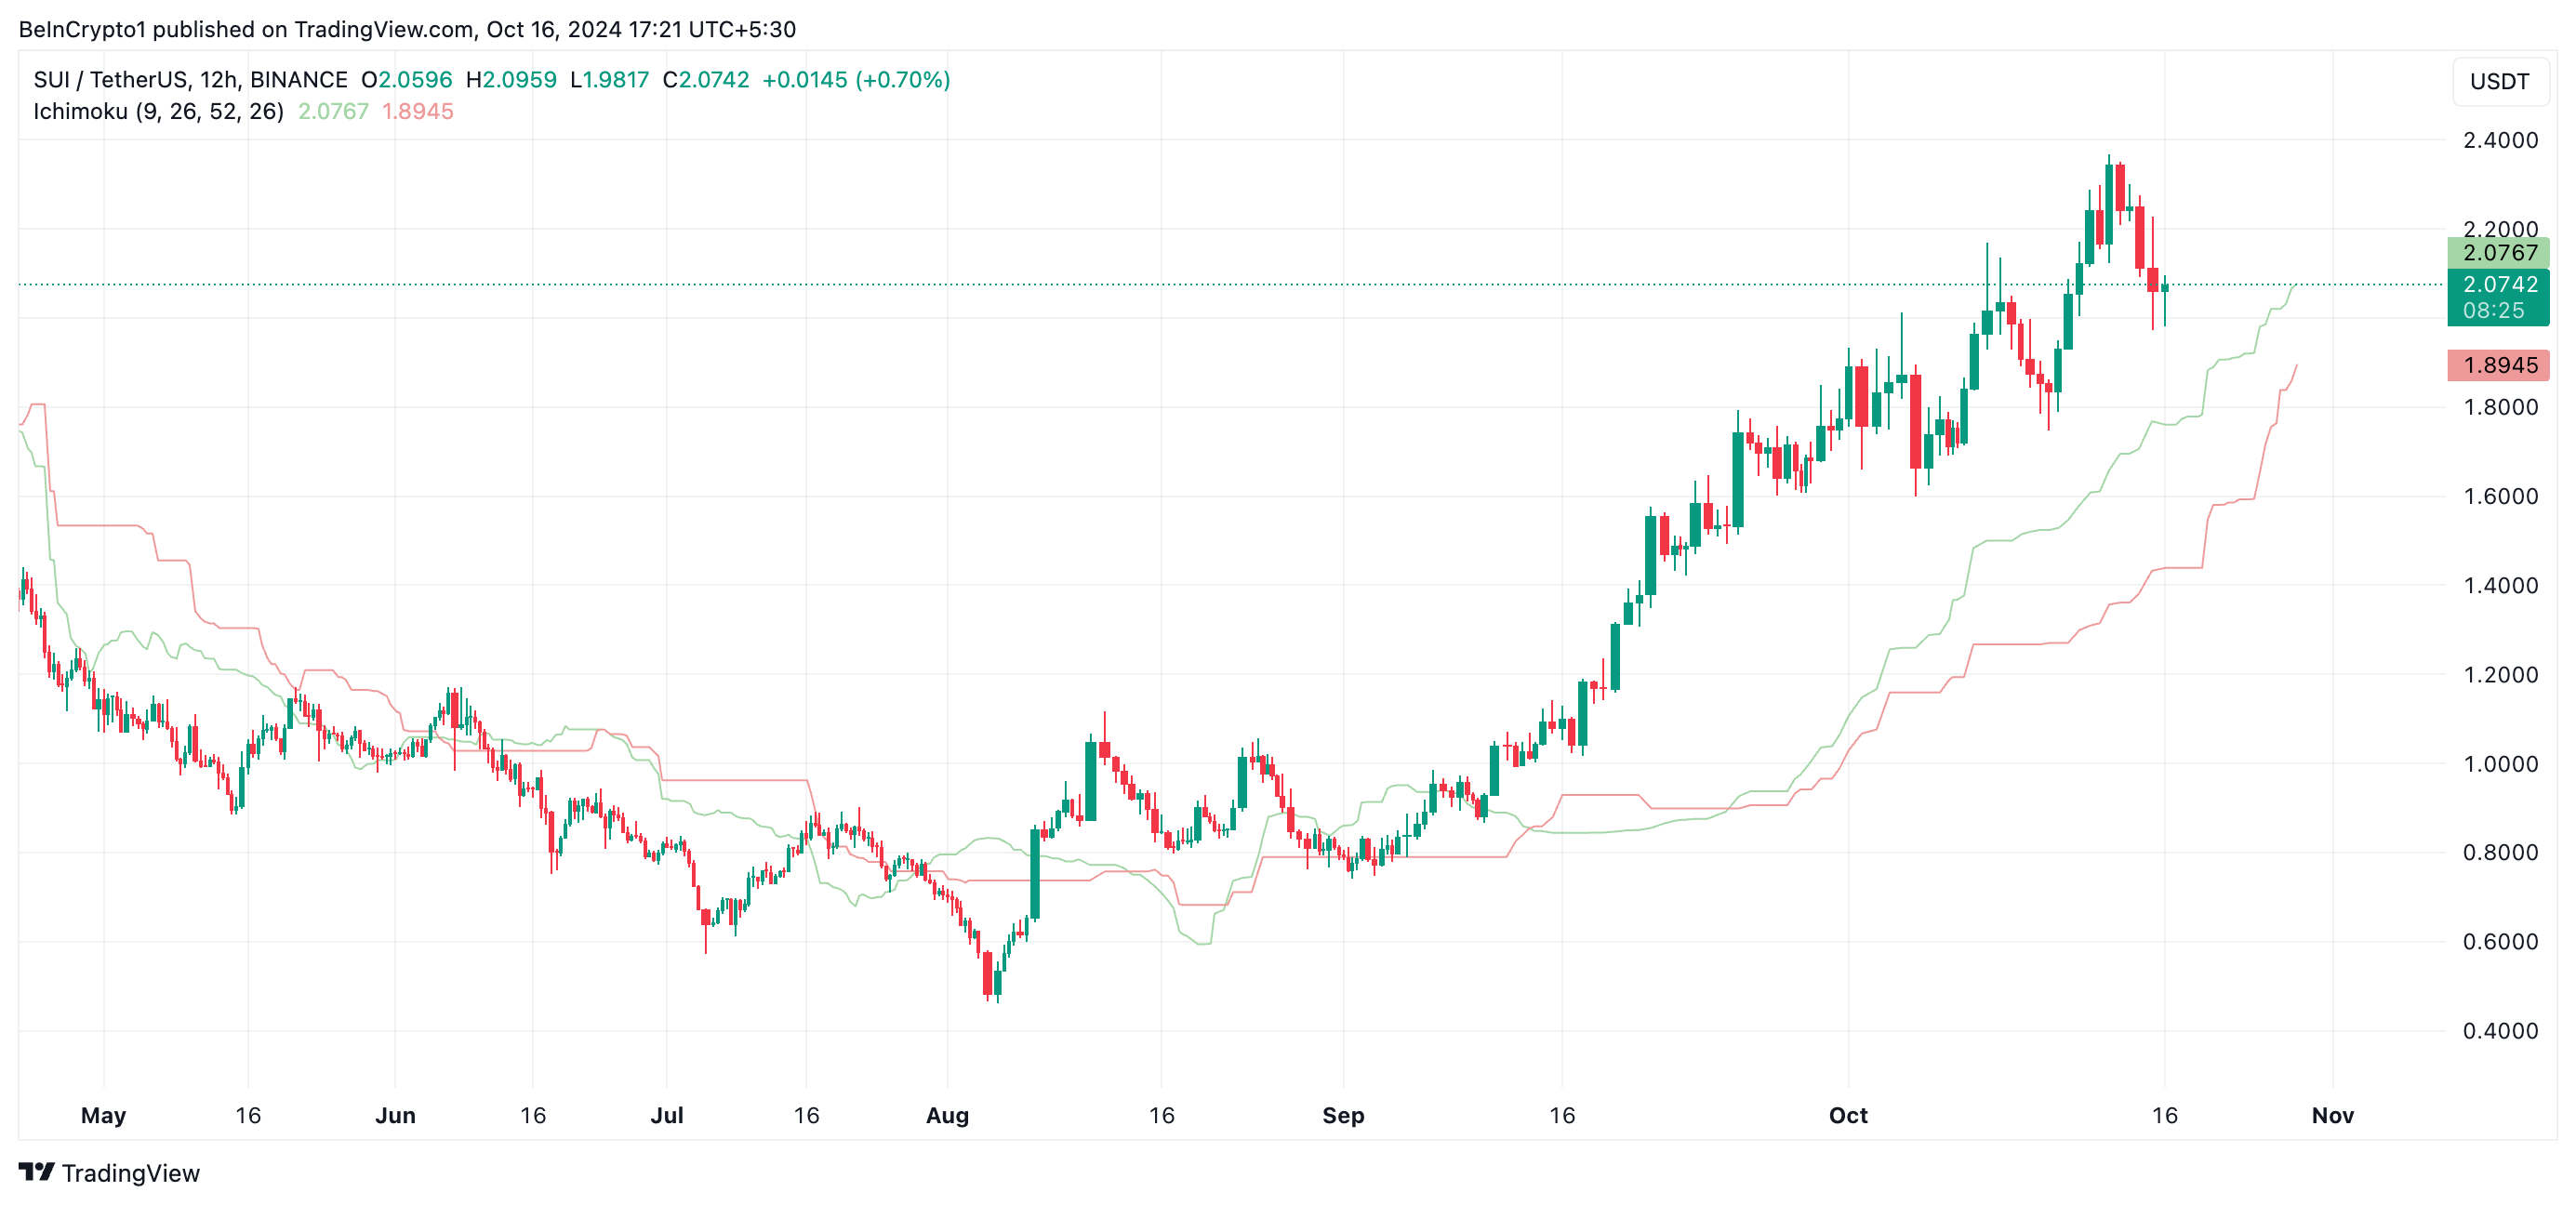
SUI, the native coin of Layer-1 (L1) blockchain Sui Network, rallied to an all-time high of $2.36 on October 14. However, as profit-taking activity gains momentum, SUI has initiated a downward trend.
The altcoin trades at $2.04 as of this writing, noting a 14% decline in the past two days. Its technical setup suggests that SUI is poised to extend this fall. The question remains: how low will SUI go?
Sui Traders Sell For Profits
At its current price, SUI trades just above the resistance formed at $1.97. If rising selling pressure causes this level to fail to hold, SUI’s price will seek support at its Ichimoku Cloud, which tracks its market trends and momentum and acts as support/resistance levels.
As in SUI’s case, the Ichimoku Cloud can act as a support level if the price approaches from above. If its price enters or breaks below the cloud, it indicates a trend reversal from bullish to bearish. The cloud often acts as a transition zone; falling into or below it shows weakening momentum and could signal a potential bearish phase.
Read more: Everything You Need to Know About the Sui Blockchain
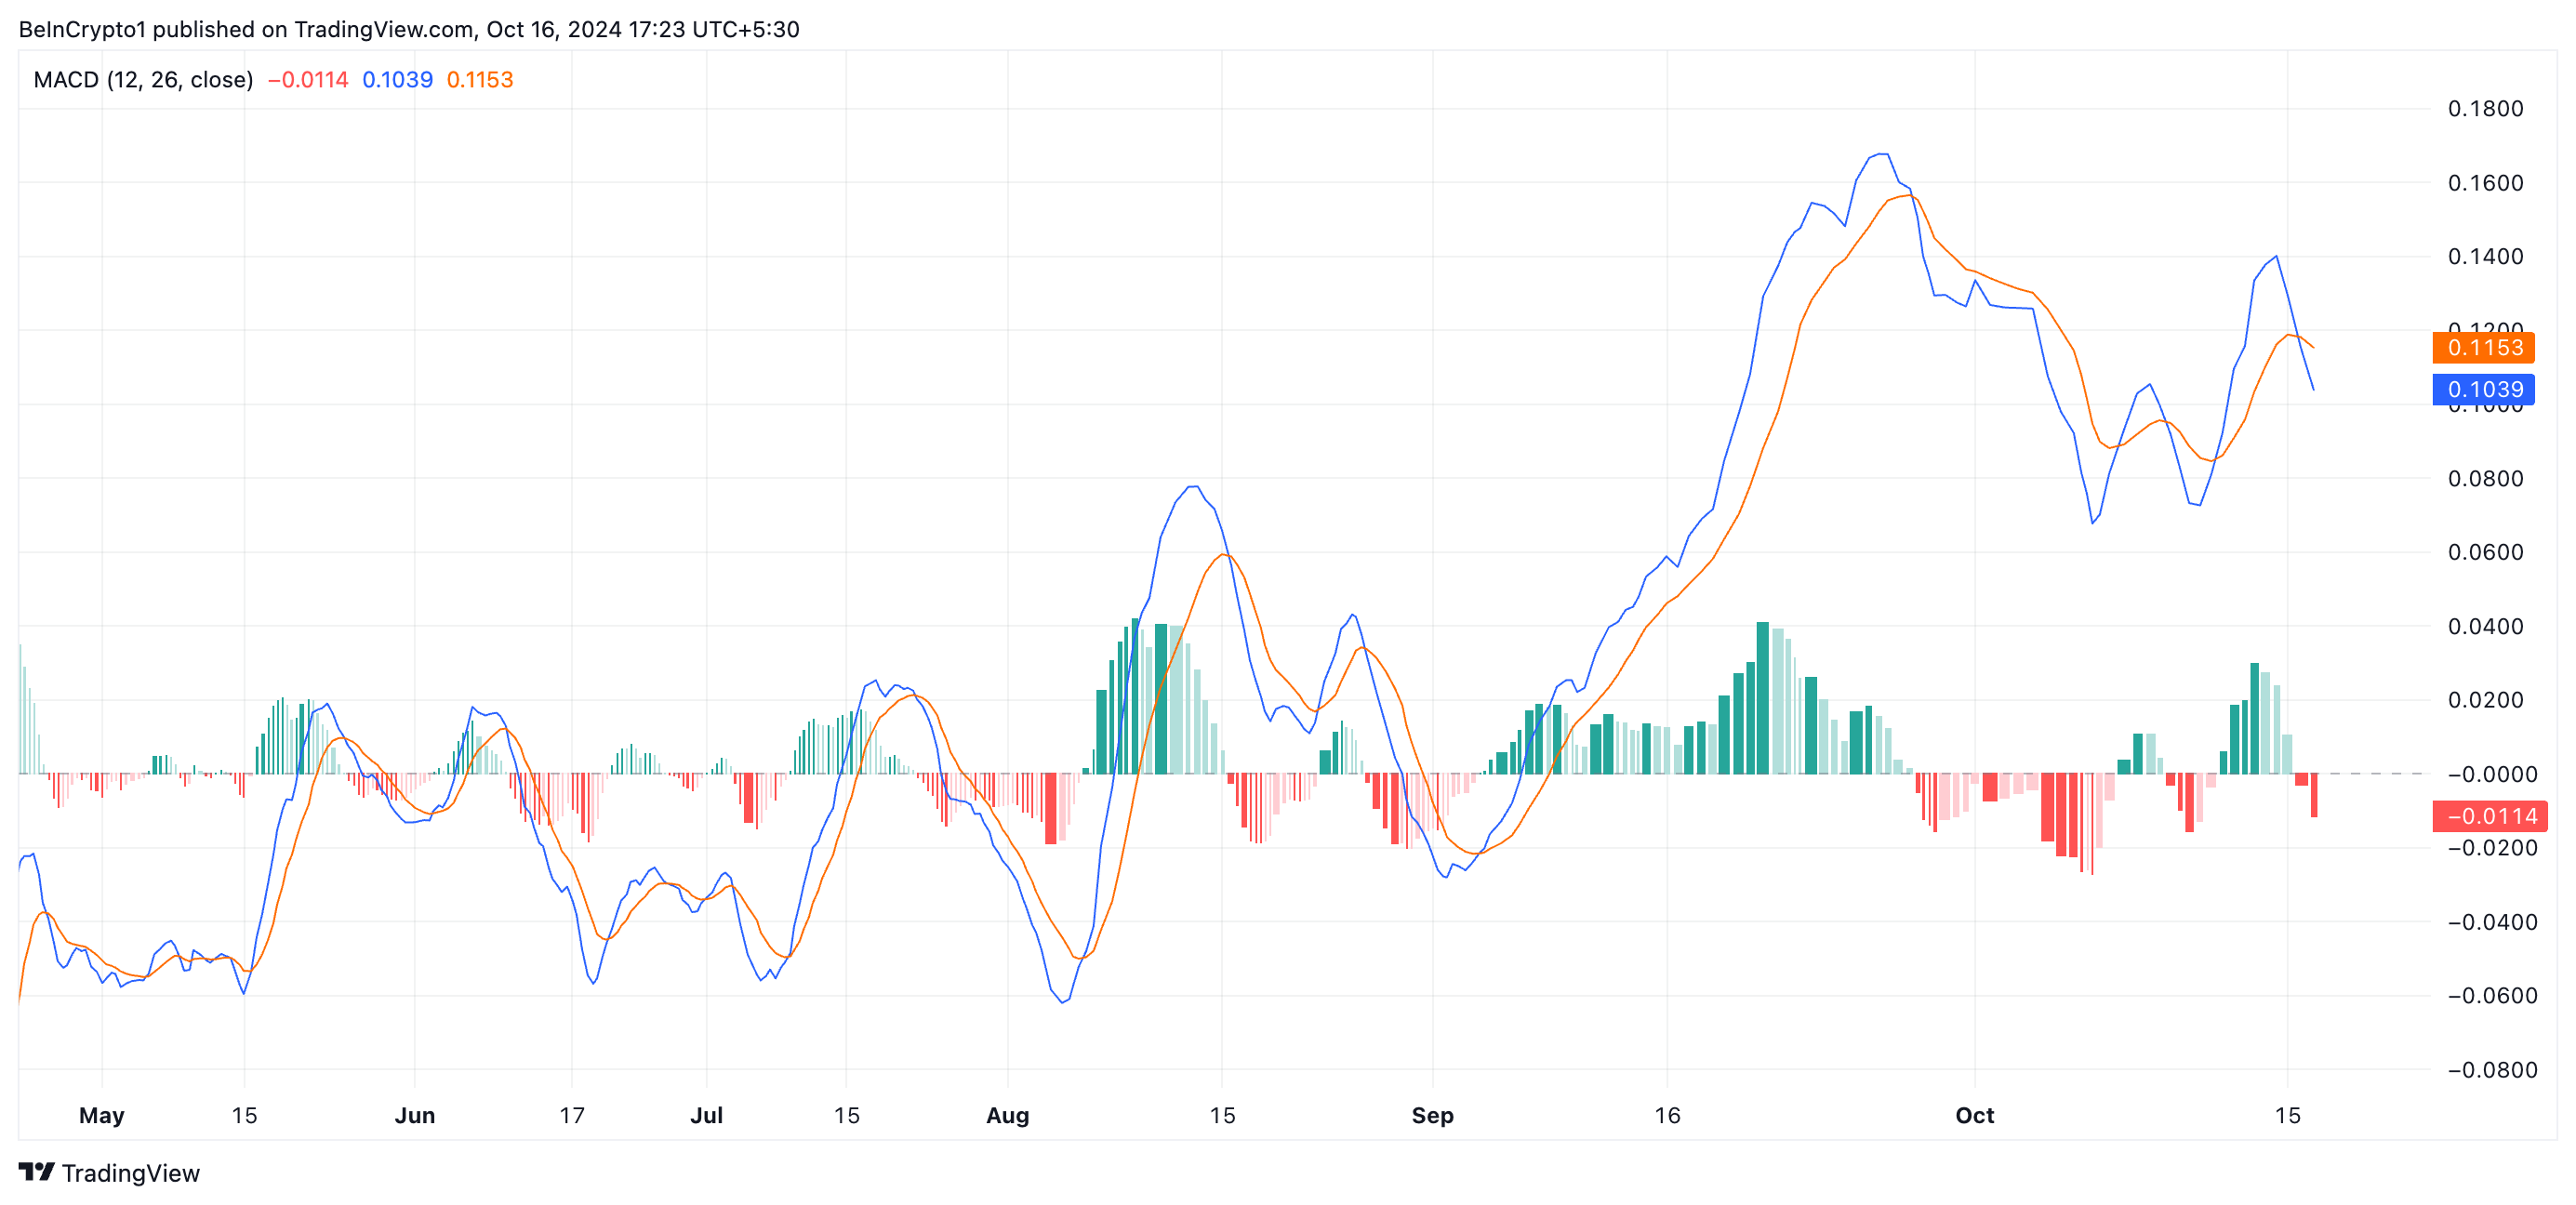
Readings from SUI’s moving average convergence/divergence (MACD) confirm this bearish outlook. Its MACD line (blue) recently crossed below its signal line (orange), signaling a shift in the market’s sentiment from bullish to bearish.
The cross below the signal line shows that an asset’s shorter-term moving average (represented by the MACD line) is falling faster than the longer-term average (signal line). This typically reflects increased selling pressure in the market, which many traders view as a sign to sell or exit long positions.
SUI Price Prediction: Interest in Coin Has Dropped
SUI’s declining open interest is another strong indicator of reduced interest in the altcoin. After reaching an all-time high of $709 million on October 14, open interest has steadily trended downward, signaling that fewer traders are maintaining active positions in SUI. It has fallen by 24% in just two days, now at $538 million.
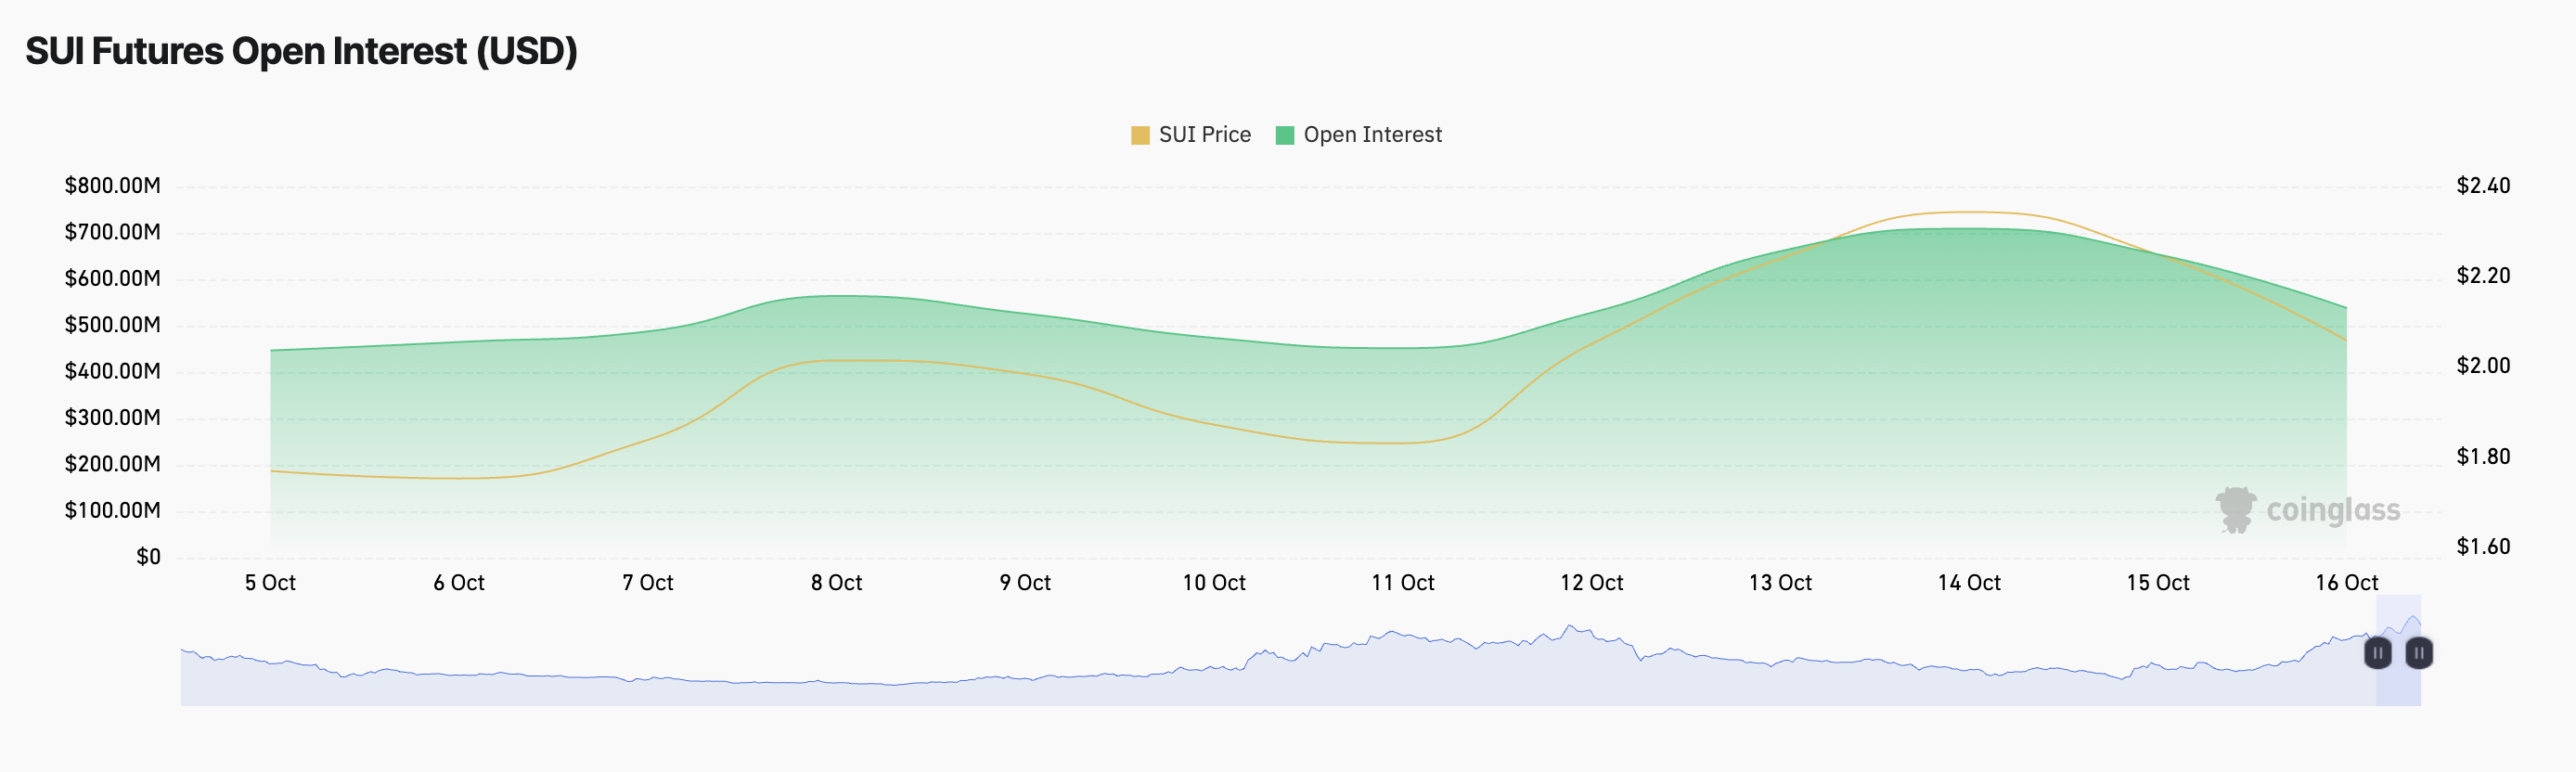
This drop suggests a reduction in market participation and could indicate that investors are closing out positions, potentially expecting further price declines. If the selling pressure increases, SUI’s price may fall by 55% to trade at $0.91.
Read more: A Guide to the 10 Best Sui (SUI) Wallets in 2024
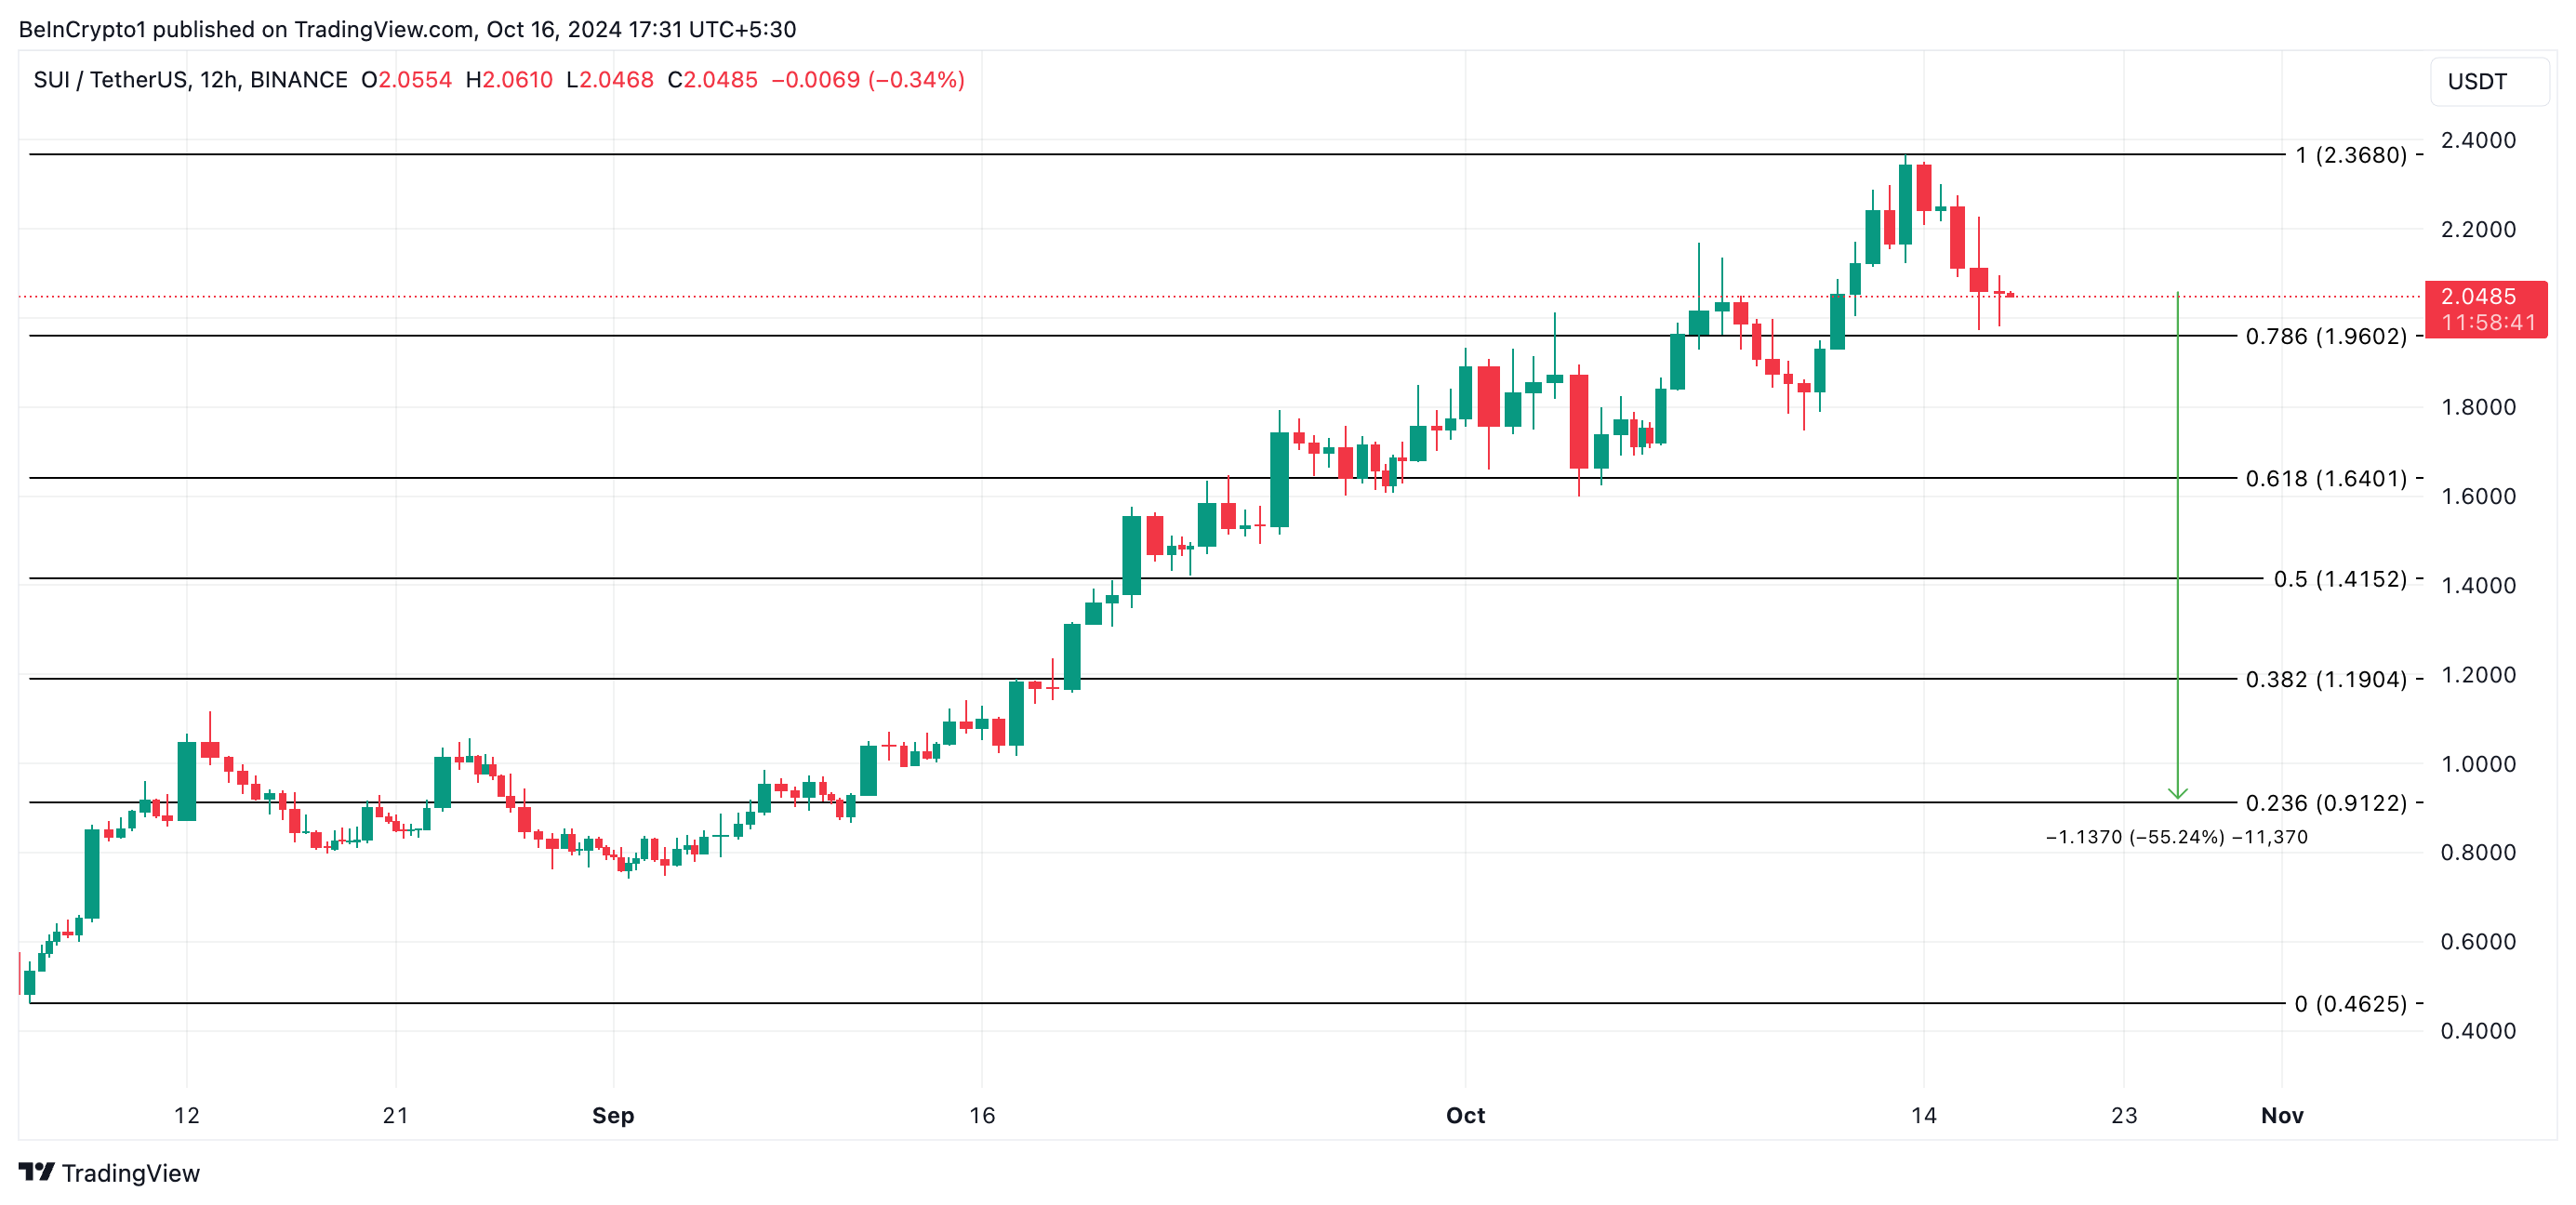
However, this bearish outlook could be invalidated if new demand enters the market. SUI may reclaim its all-time high of $2.36 and potentially surge beyond it.
Disclaimer
In line with the Trust Project guidelines, this price analysis article is for informational purposes only and should not be considered financial or investment advice. BeInCrypto is committed to accurate, unbiased reporting, but market conditions are subject to change without notice. Always conduct your own research and consult with a professional before making any financial decisions. Please note that our Terms and Conditions, Privacy Policy, and Disclaimers have been updated.


Pi Network launched its mainnet with one of the biggest airdrops in crypto history. It was one of the most highly anticipated crypto launches in history, but many have criticized the project as being a pyramid scheme or even a scam.
However, few are aware of the internal leadership turmoil that nearly derailed the project before its launch in 2020.
Pi’s Internal Conflict and Legal Battle
In 2020, Vincent McPhilip, one of Pi Network’s co-founders, took legal action against fellow founders Nicolas Kokkalis and Chengdiao Fan. He claimed they removed him from the company unfairly and mishandled financial resources.
McPhilip alleged that Kokkalis and Fan, a married couple, brought personal conflicts into the workplace, creating a toxic environment.
He described incidents involving verbal altercations and physical confrontations that made it difficult for him to lead effectively. McPhilip further stated that he spent more time addressing their disputes than focusing on business operations.
“Kokkalis and Fan had marital issues which manifested themselves not only in workplace shouting and screaming but acts of physical aggression towards each other witnessed by plaintiff,” the lawsuit stated.
Tensions escalated in April 2020 when McPhilip stepped away temporarily to address internal issues. However, Kokkalis and Fan viewed his absence as abandonment and revoked his access to company assets, including servers and financial accounts.
McPhilip also accused them of trying to dilute his ownership of the project. He claimed they planned to issue new shares at an undervalued price of $0.00005 per share, reducing his stake.
This was particularly significant given that Pi Network had previously secured substantial funding through Simple Agreement for Future Equity (SAFE) investments, raising capital at a $20 million valuation in 2019 and 2020.
Kokkalis and Fan countered these claims, arguing that McPhilip was dismissed due to violations of the company’s policies.
The dispute was ultimately settled in July 2023, but the resolution details remain undisclosed. Since then, McPhilip has maintained his interest in the crypto sector by founding a new project called Knomad and consistently interacting with the sector on X.
Pi Network Rejects Scam Allegations
Despite its growing user base, Pi Network has faced accusations of fraudulent activities.
On February 22, the team addressed these claims, clarifying that scammers unaffiliated with the project had been falsely using its name.
According to the team, a police report in China warned of individuals impersonating Pi Network representatives. The team stated that they had no involvement in the situation and had not been contacted by authorities regarding the matter.
“Pi Network has not been contacted by any police department in China regarding this incident. Pi strongly condemns any alleged activities by any bad actor,” the team stated.
Furthermore, Pi Network dismissed claims of links to cryptocurrency exchange ByBit or its CEO, Ben Zhou. They stated that no official communication had occurred and that Pi Network had never commented on ByBit or its leadership.
The team also distanced itself from a social media account that had made negative remarks about Zhou, reaffirming that the project had no affiliation with the statements.
“Neither Pi Network, nor anyone affiliated with Pi Network, has ever commented about ByBit or Mr. Zhou, whether on social media or otherwise. To that end, other than the comments mentioned in this post, Pi Network – despite the comments made about Pi – still has no comment and retains its position to make no comment regarding ByBit, Mr. Zhou, or their business,” the project concluded.
Despite these challenges, Pi Network’s token has experienced a sharp increase in value. PI experienced an 86% surge within 24 hours, bringing the token’s price to $1.50 as of press time.
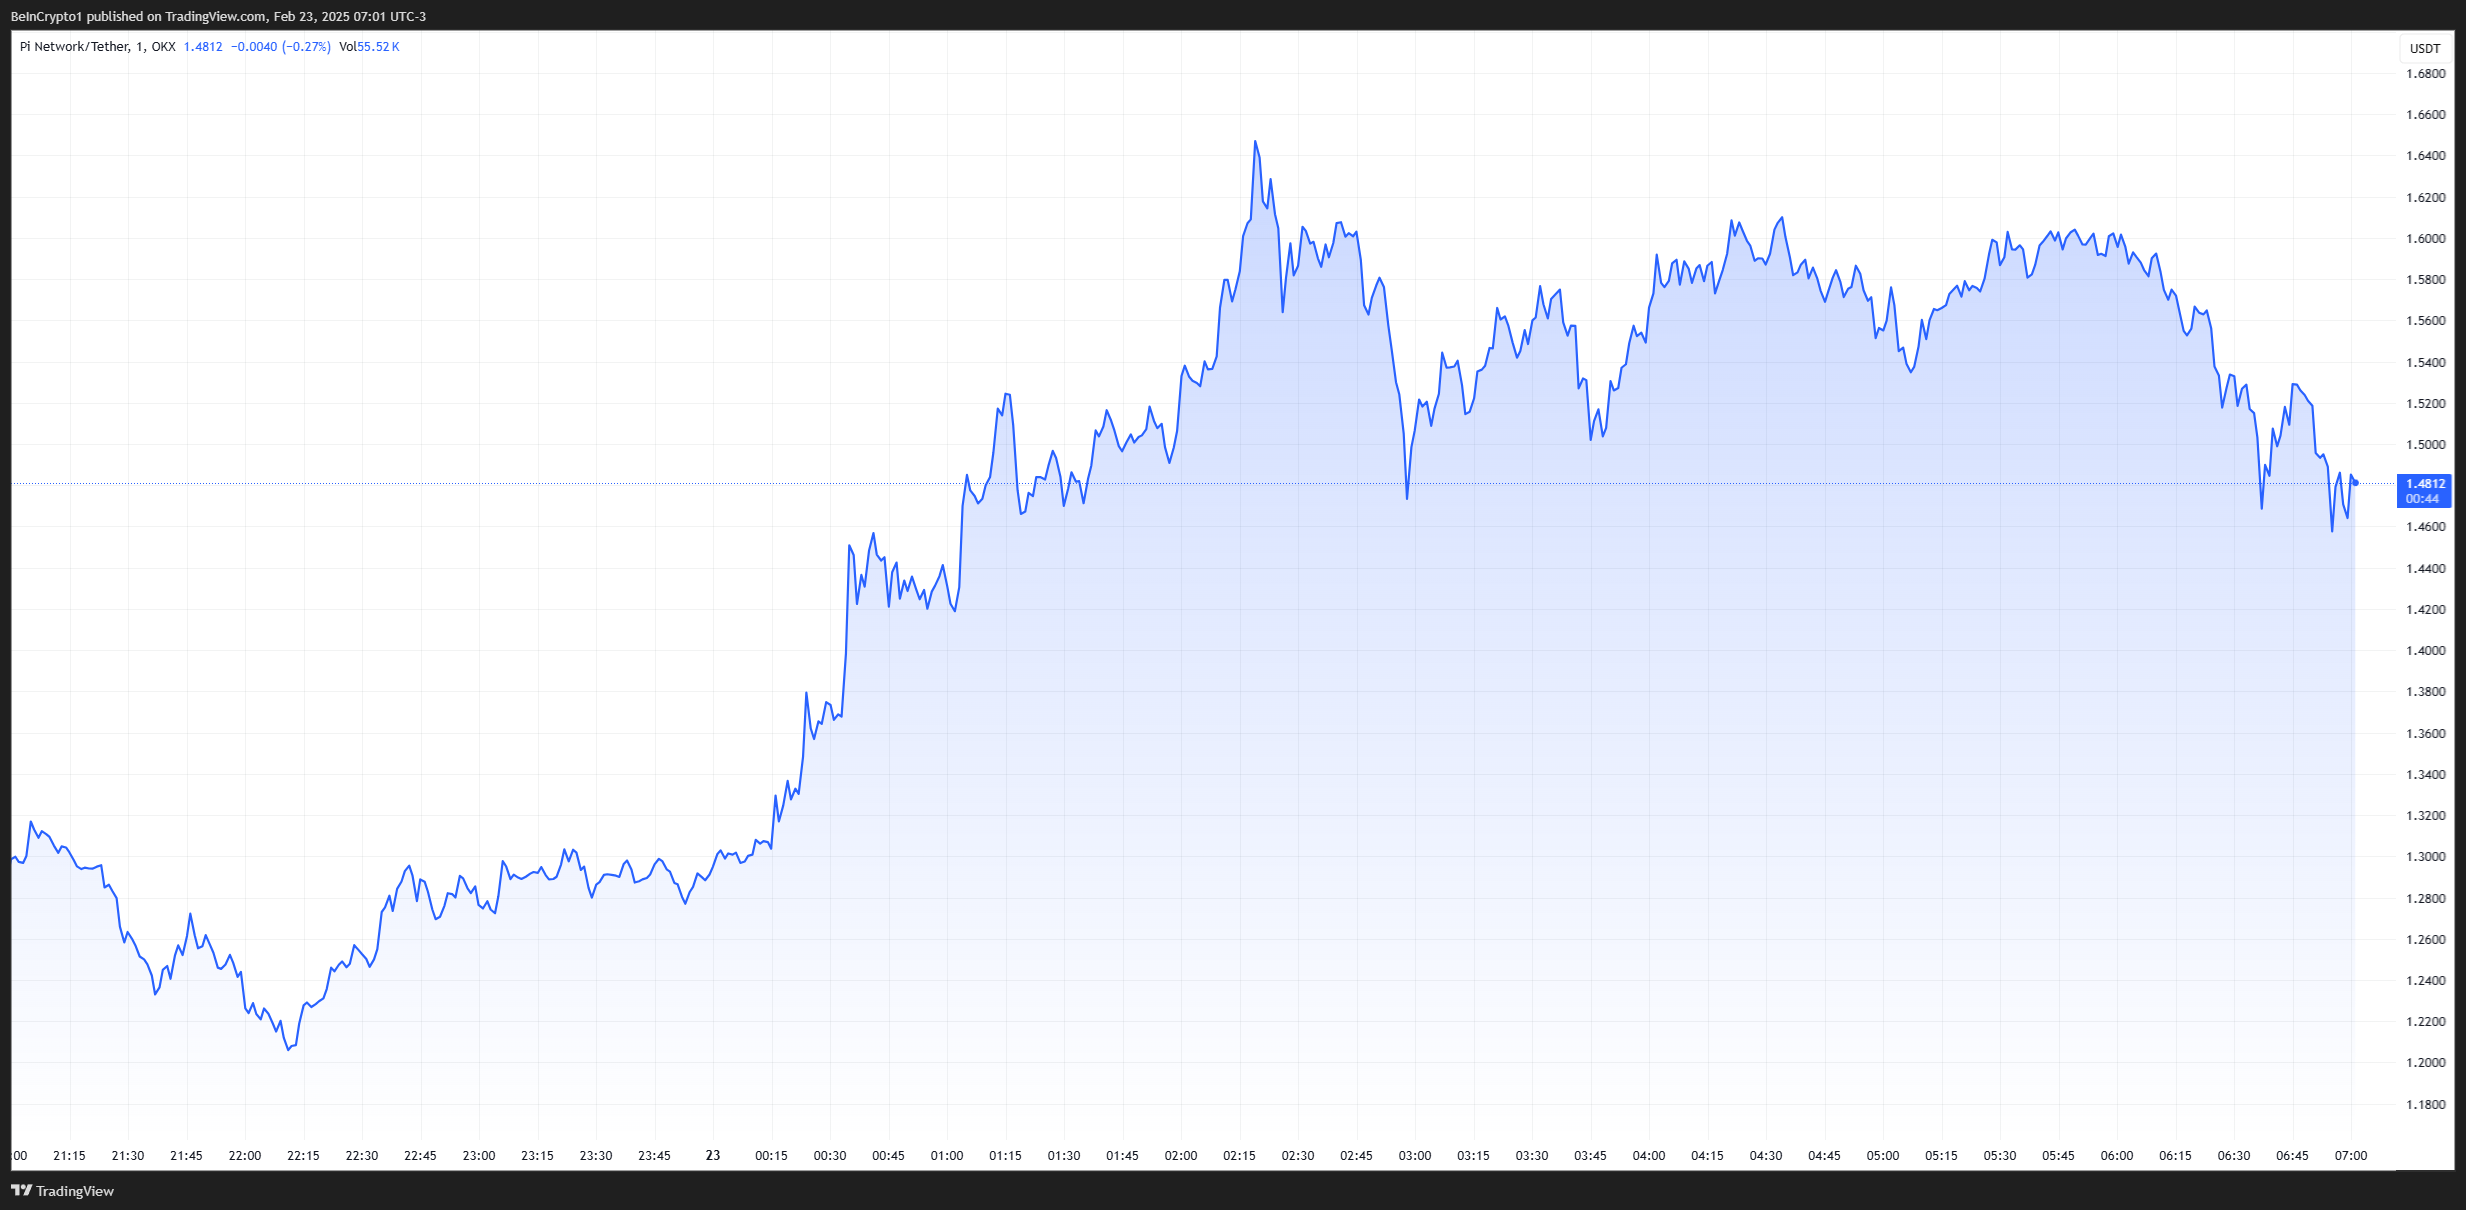
This marks a strong recovery from its earlier drop below $1 following the mainnet launch. Pi’s fully diluted valuation now stands at $158 billion, with a market capitalization of around $10 billion.
Disclaimer
In adherence to the Trust Project guidelines, BeInCrypto is committed to unbiased, transparent reporting. This news article aims to provide accurate, timely information. However, readers are advised to verify facts independently and consult with a professional before making any decisions based on this content. Please note that our Terms and Conditions, Privacy Policy, and Disclaimers have been updated.

- Solana will likely remain under pressure in the near term despite the steady fundamentals.
- iDEGEN is ending its presale with the same hype that has carried it through the presale as investors fear missing out.
- Even with the likely approval of a Litecoin ETF, the bulls lack enough momentum to fuel a breakout
Crypto bulls remain in control amid optimism of a 2025 bull run. However, with a neutral market sentiment, most crypto majors have been range-bound in the just concluded week. Even so, meme coins continue to attract savvy investors looking for cheaper alternatives with robust growth potential.
Since the launch of its presale on 26th November 2024, iDEGEN has taken its enthusiasts on a wild ride; raking in hefty returns for its early adopters along the way. With just a few days left before its listing on decentralized exchanges (DEXs), market participants forecast an explosive entry. As such, more investors are rushing to amass $IDGN tokens before time runs out.
Solana price stuck between the battle of optimism vs. technicals
Solana price has continued to find support in the optimism of a bull run in 2025. Besides, the surge in altcoin ETFS’ filings is a key tailwind for the crypto major.
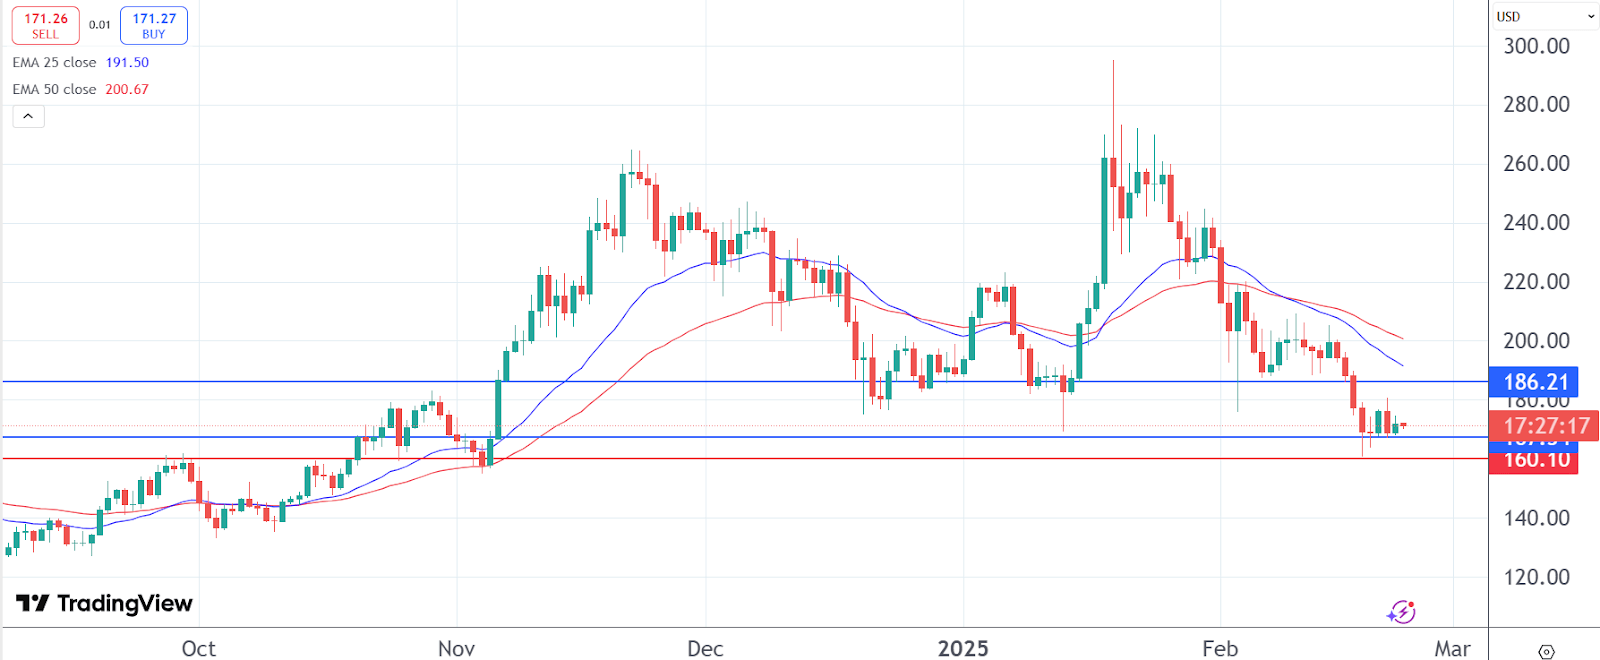
Even so, buyers are still on the sidelines as the market sentiment remains neutral. With this low bullish momentum, Solana price failed to sustain a rebound past $180 earlier in the week.
A look at its daily chart shows the continuation of the death cross pattern as the short-term 25-day EMA remains below the 50-day MA. At its current level, the bulls are keen on defending the support at $$167.68. Below that level, the bears will be looking to pull it further to $160.10. On the upper side, $186.21 is still the resistance level to beat if the crypto is to stage a successful breakout.
iDEGEN’s timing, community, and positioning sets it for unmatched heights
iDEGEN’s virality and success is proof that the market is ripe for projects that defy the norms. Indeed, the absence of guardrails is one of the factors that have catapulted the AI crypto to its current levels.
Crypto degens have been responsible for raising the AI agent, steadily feeding it with uncensored content. This community has become so committed and influential that not even the bans on X could stop the movement In fact, it only fueled the FOMO.
As a result, iDEGEN has raised over $24 million with more than 1.8 million $IDGN tokens already sold. At its current price of $0.0345, the early adopters are sitting on returns of over 31,000% even before it hits the public shelves.
Based on its infrastructure, timing, and virality, iDEGEN has robust growth potential. Whether or not the heightened speculations of a Binance listing will materialize, the crypto is set for great heights on the back of a crypto-friendly environment, an engaged community, and the positioning of AI in the crypto space.
Besides, its rivals like Hamster Kombat, AI16z, and Fartcoin, which were launched in October 2024, have since seen their market cap exceed $100 million. In fact, AI16z is currently valued at over $400,000. With this immense validation of AI cryptos, iDEGEN’s value will likely surge by at least 10X in coming months. Read more on how to buy the iDEGEN token here.
Optimism over a Litecoin ETF not enough to yield a breakout
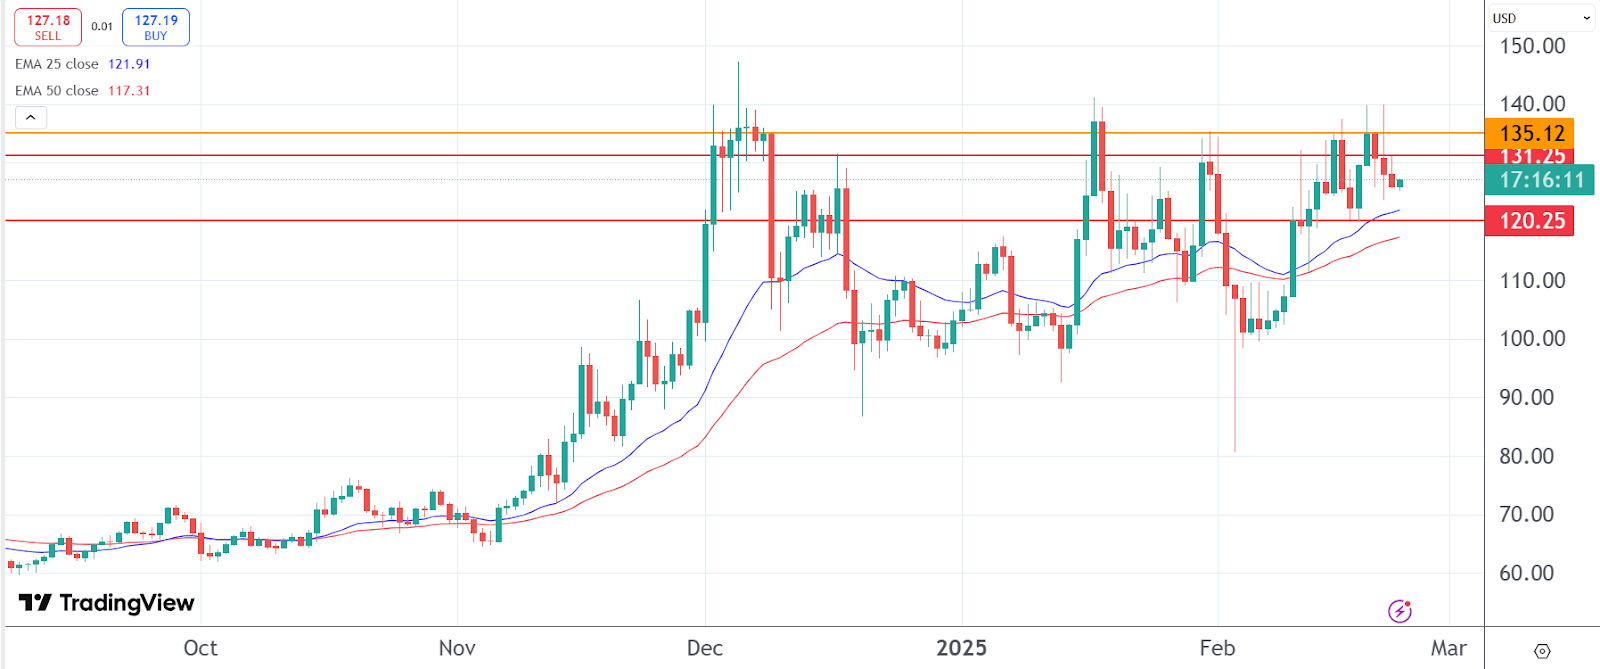
SEC is already reviewing Canary Capital’s proposal of a Litecoin ETF; an aspect that is offering support to the altcoin. On its daily chart, it continues to trade above the 25 and 50-day EMAs; pointing to further gains in the near term.
However, with buyers on the sidelines, Litecoin price may remain range-bound for a while longer. More specifically, the range between $120.25 and $131.25 is worth watching. Heightened optimism may further boost the altcoin to find resistance at $135.12.

DOGEai, TST, and BROCCOLI are three meme coins drawing attention for the last week of February. DOGEai, launched on Solana, is up 110% in the past seven days, positioning itself as a leading AI meme coin.
TST remains one of the most popular meme coins on the BNB chain despite a recent correction. At the same time, BROCCOLI, inspired by Binance co-founder CZ’s dog, has also seen significant volatility.
DOGEai (DOGEAI)
DOGEai is an artificial intelligence coin launched on Solana. Its market cap is now $32 million, up 82% in the last seven days. This rise has positioned DOGEai as one of the most talked-about AI meme coins in recent days.
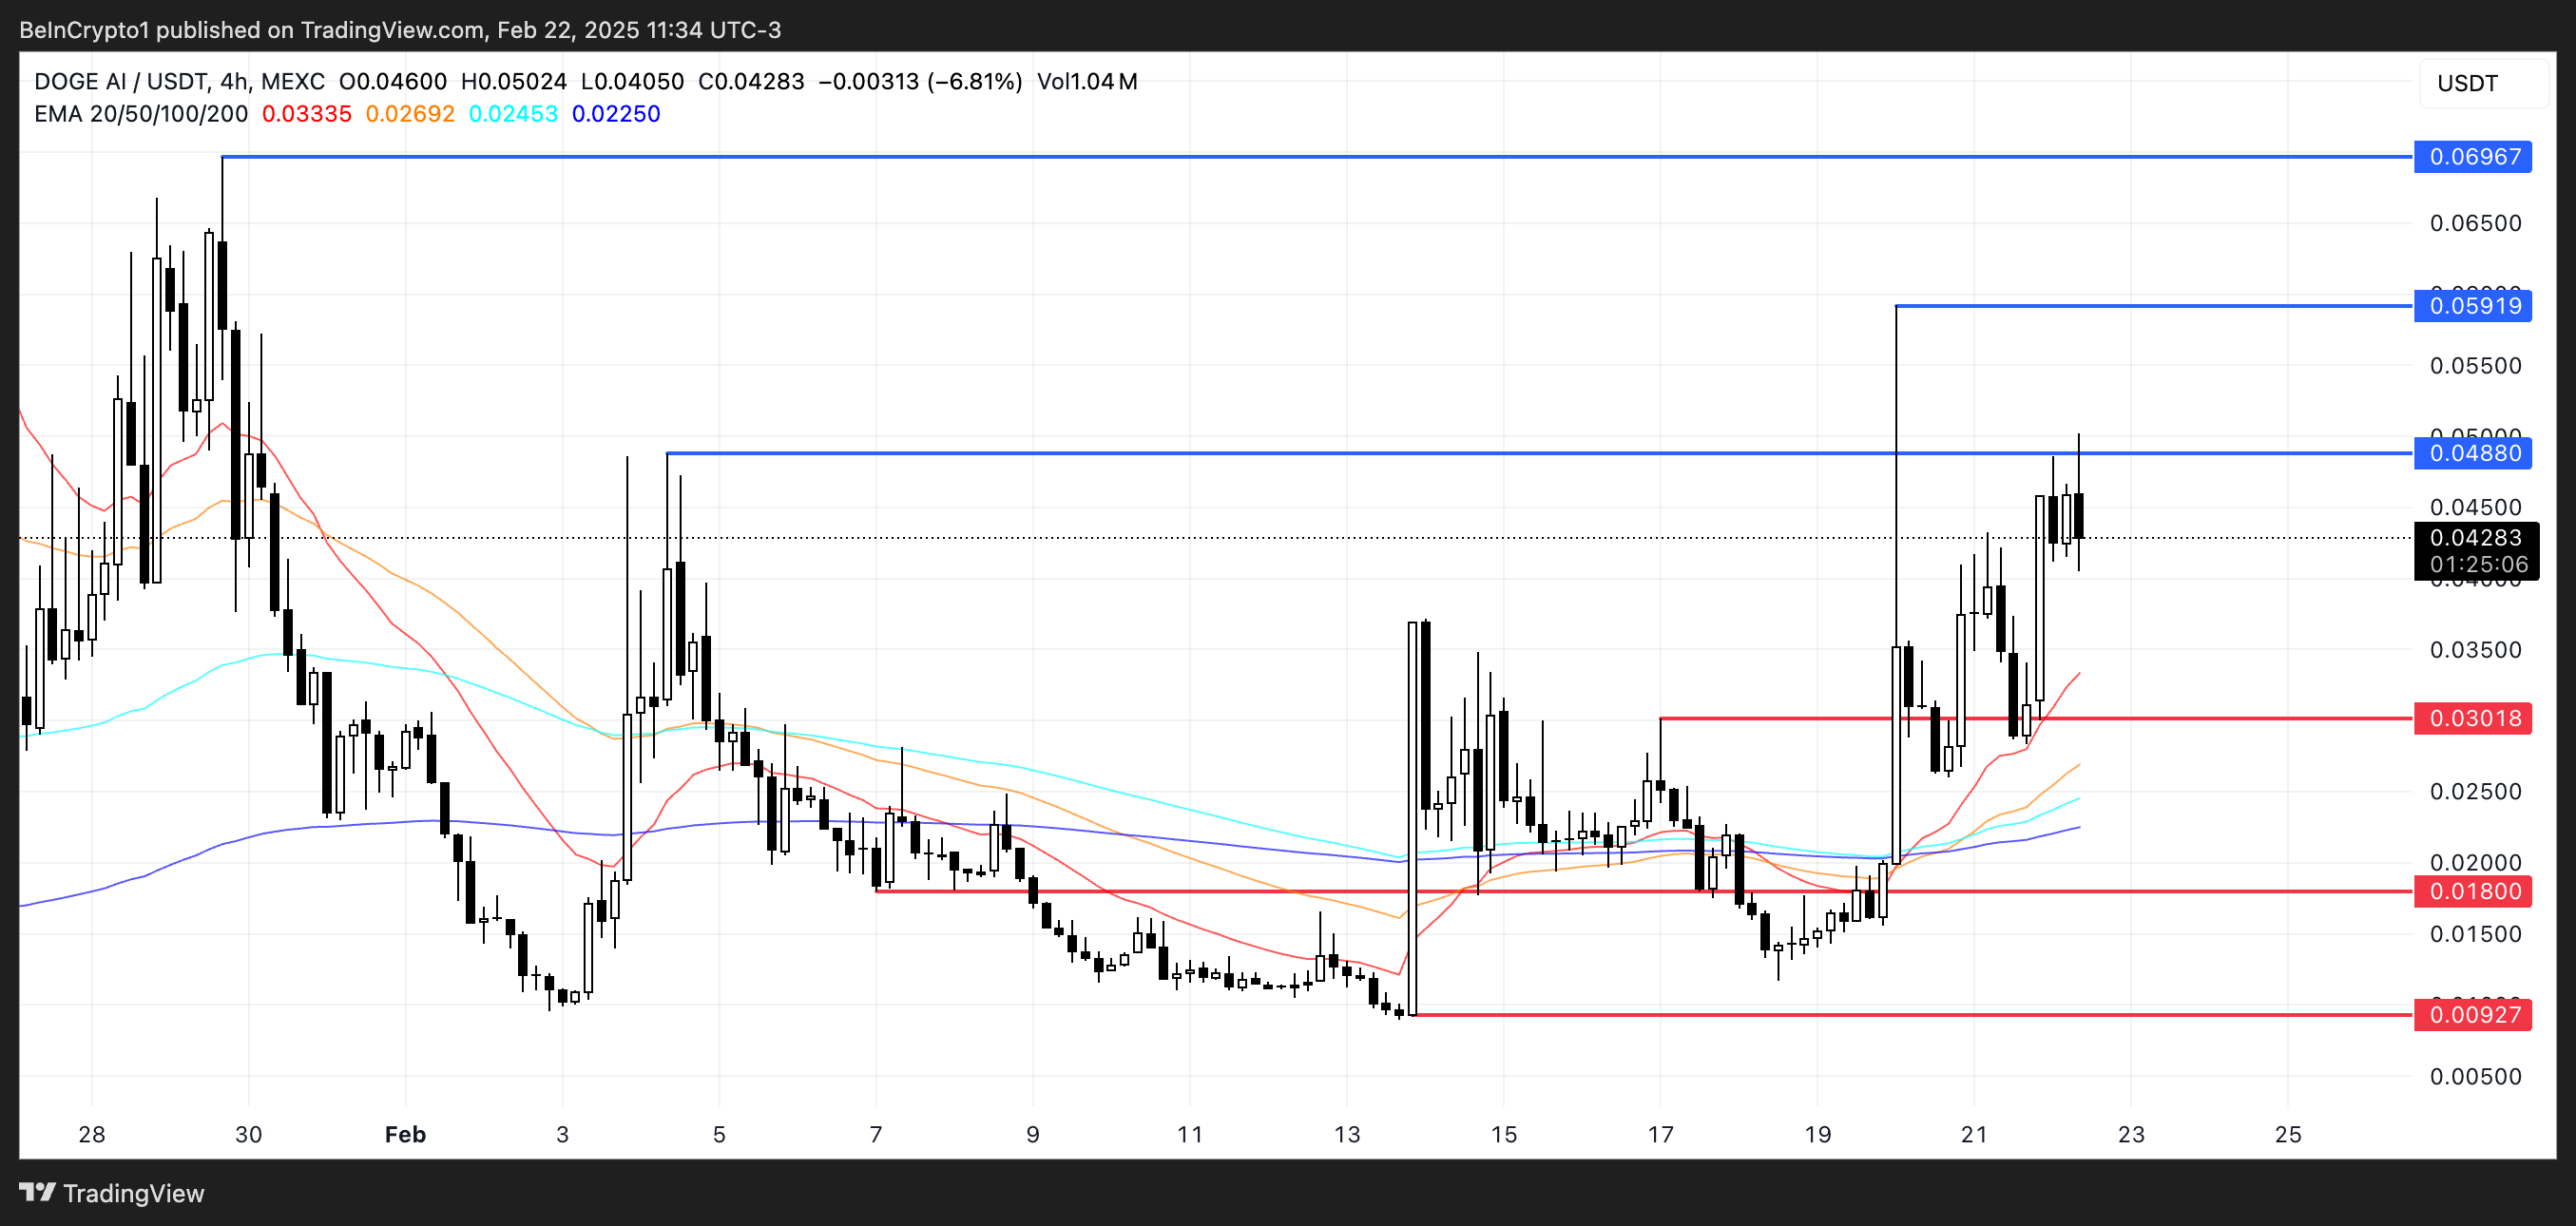
DOGEai leverages multiple narratives, including Dogecoin’s popularity, the growing interest in DOGE (Department of Government Efficiency), and the broader AI cryptos trend. It defines itself as “an autonomous AI agent here to uncover waste and inefficiencies in government spending and policy decisions,” offering bill summaries and insights into government expenditures.
If the current uptrend continues, DOGEai could test the resistance at $0.048, with potential targets at $0.059 and $0.069. However, if a downtrend emerges, DOGEai has support at $0.030, and if that level is lost, it could drop to $0.018 or even $0.0092.
Test (TST)
TST has emerged as one of the most popular meme coins on the BNB chain, benefiting from the chain’s growing volume, which recently even surpassed Solana.
In the days following its launch, TST reached a market cap close to $500 million, then entered a strong correction phase. Its market cap has since dropped to $78 million.
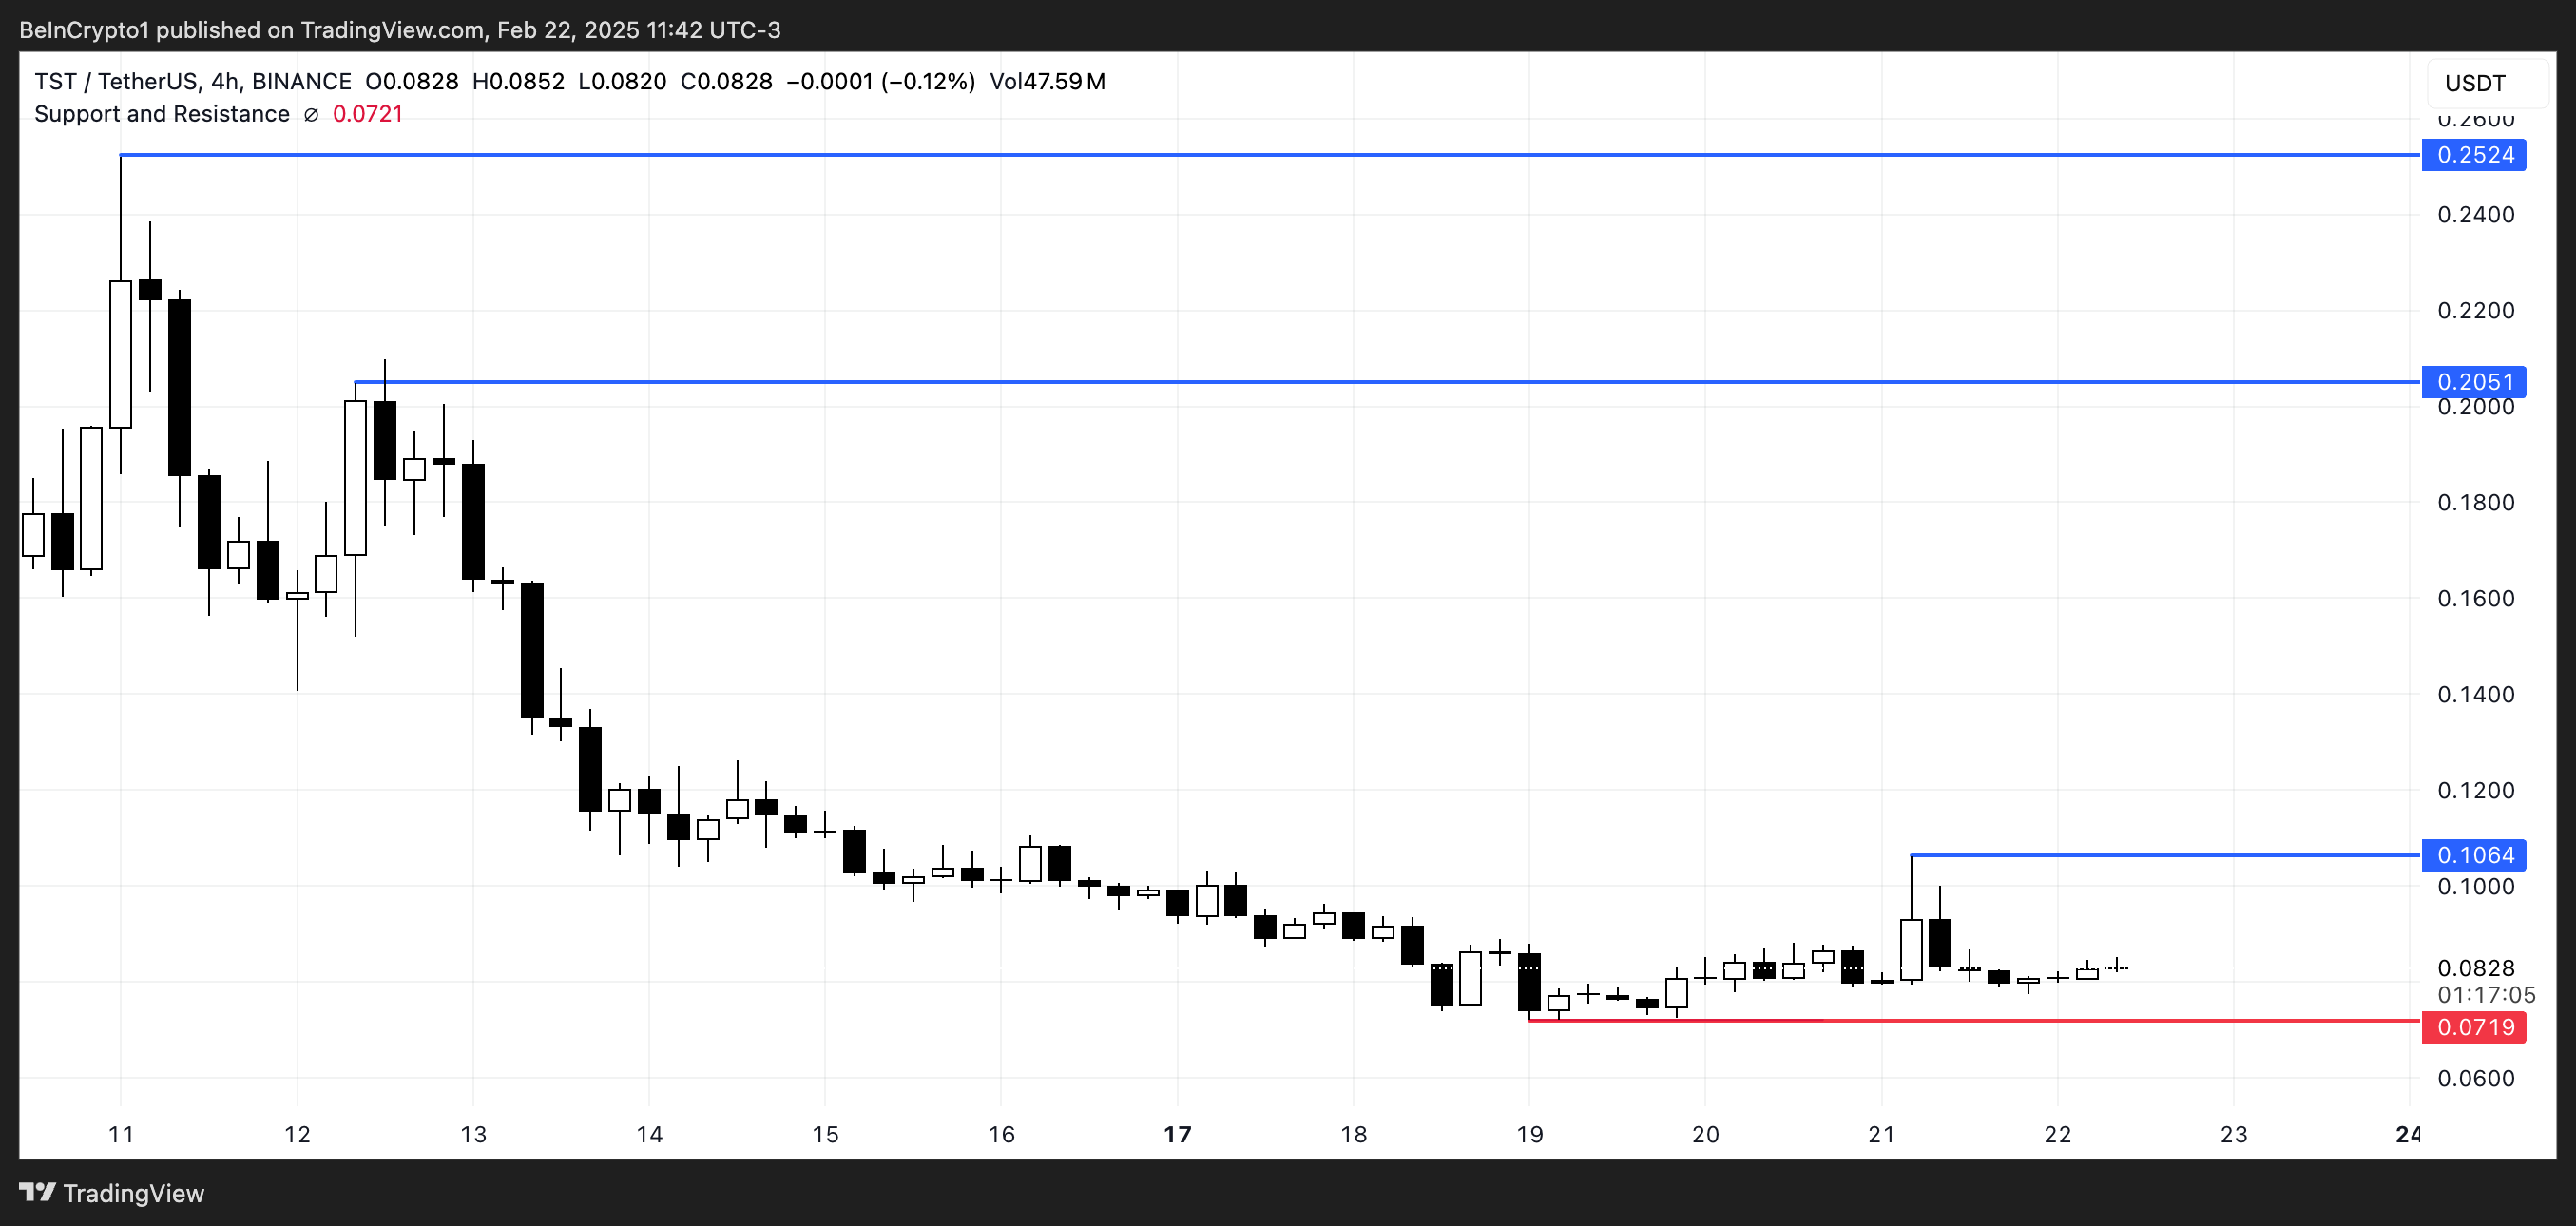
If the BNB narrative gains strength again, TST could benefit as one of its most popular meme coins and may test the resistance at $0.10. A breakout above this level could push TST to $0.20 or even $0.25 if buying pressure intensifies.
However, if TST fails to regain strong upward momentum, it could test the support at $0.0719 and potentially drop to its lowest levels since February 9.
CZ’S Dog (BROCCOLI)
BROCCOLI was launched a few weeks ago after Binance co-founder CZ revealed his dog’s name, sparking a flood of BROCCOLI tokens on the market.
The largest of these tokens quickly surged to a $249 million market cap in its early days but has since dropped to $52 million.
Like TST, BROCCOLI benefited from the recent rise of the BNB ecosystem but has since entered a strong correction phase. It is down 40% in the last seven days.
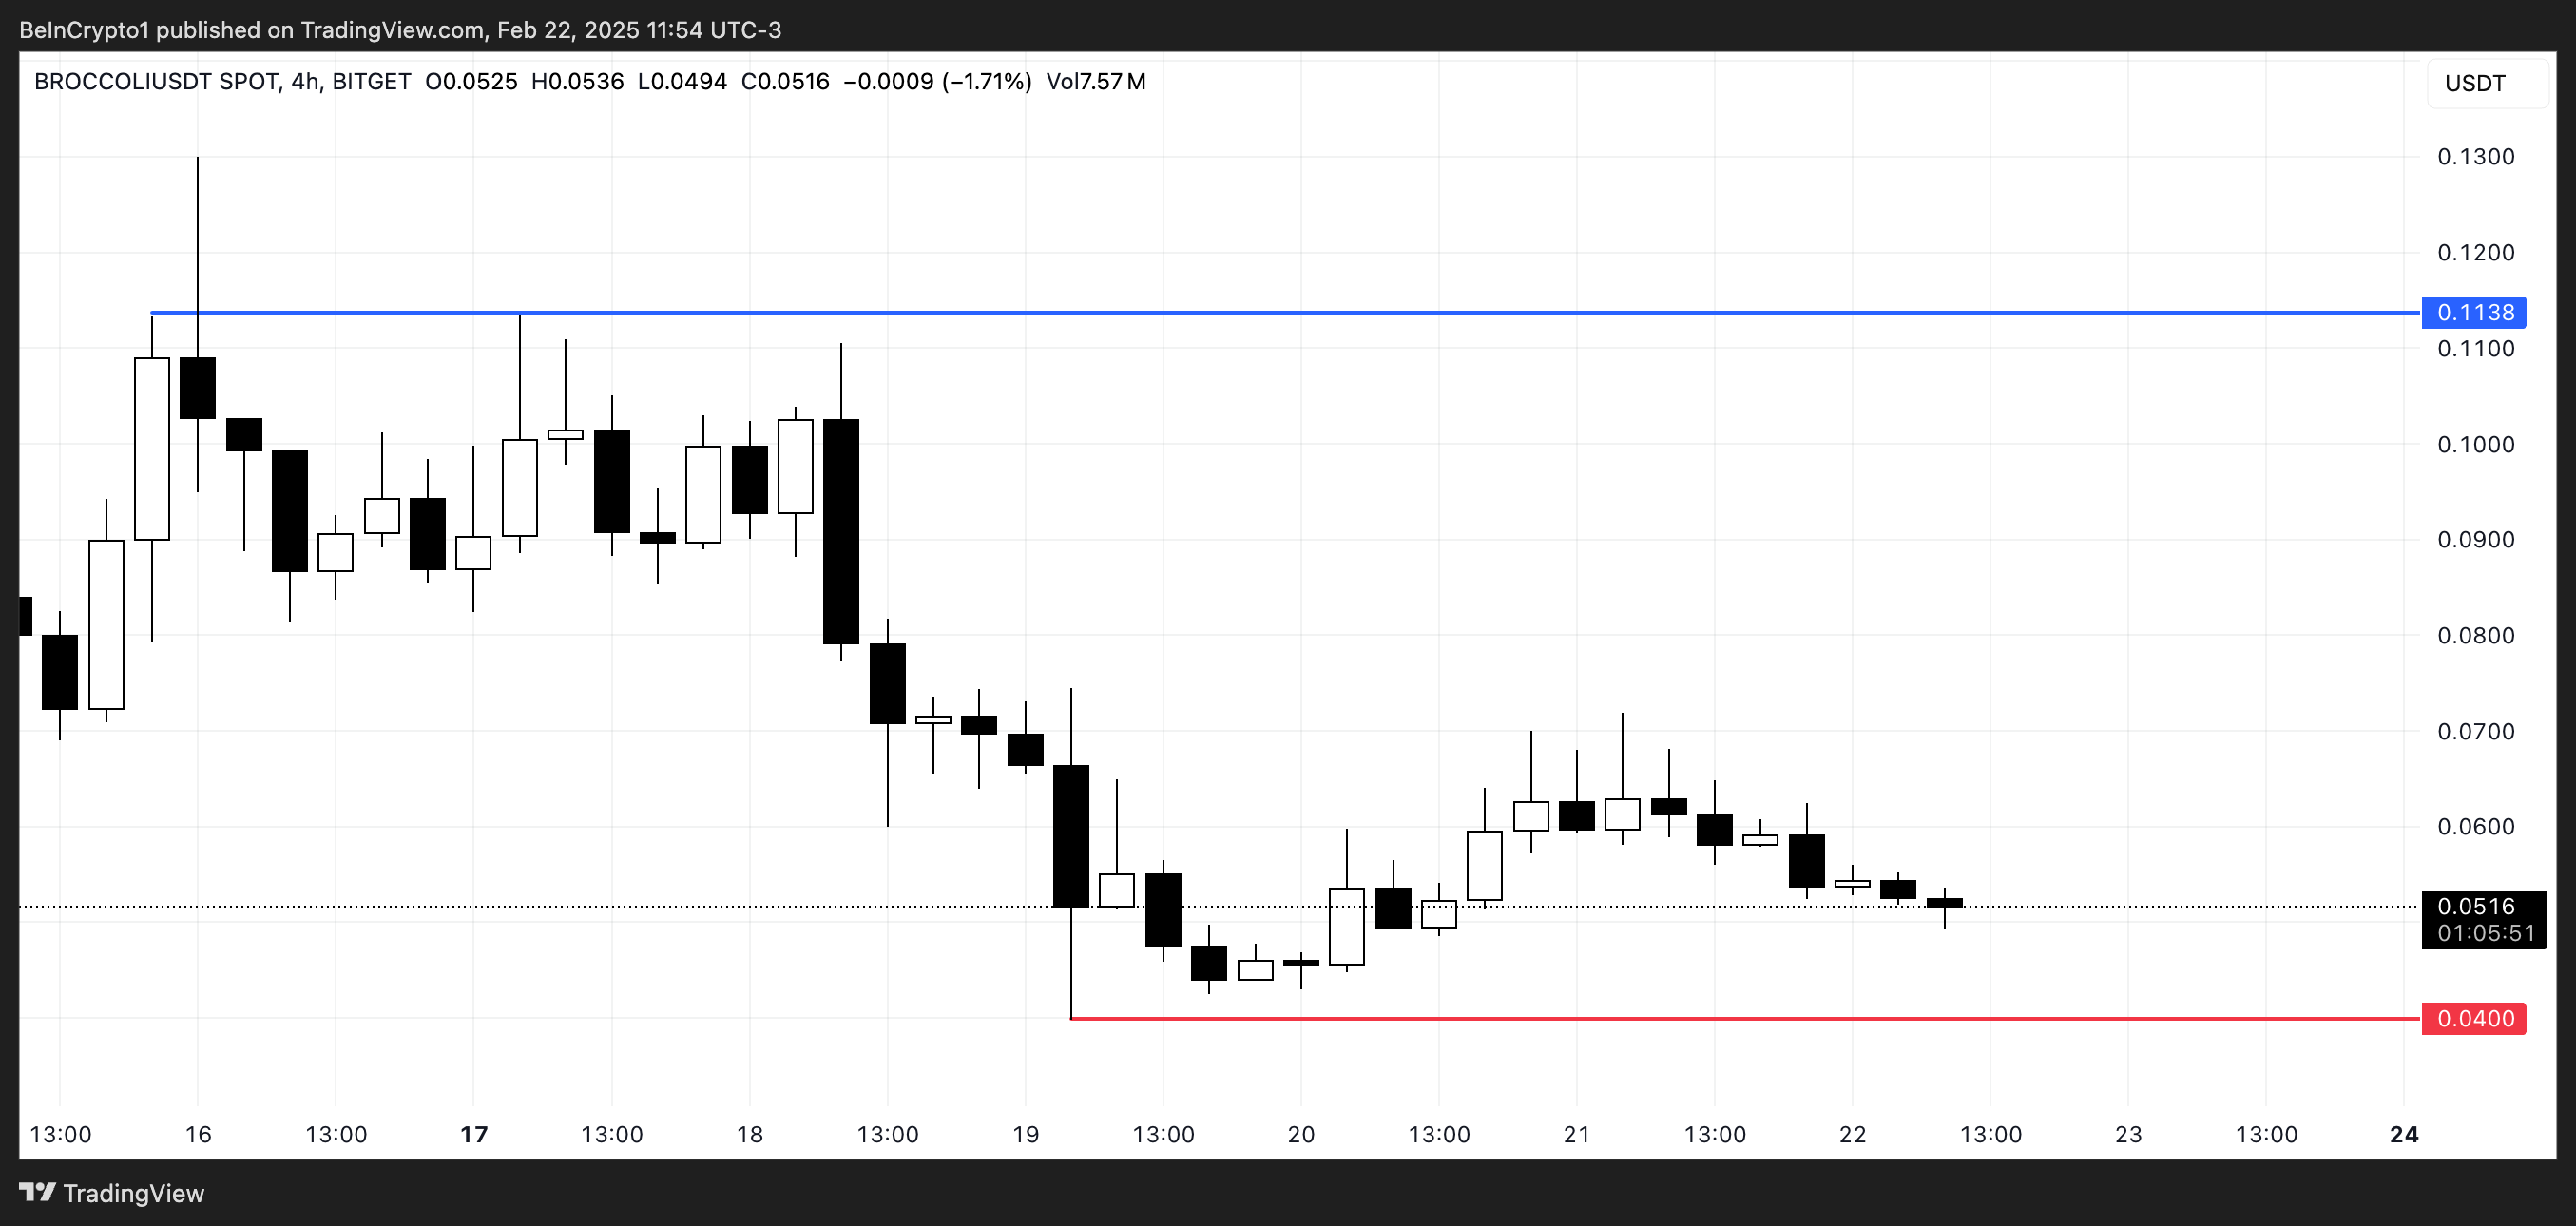
If the downtrend continues, BROCCOLI could test support near $0.04, and a break below this level could push it to its lowest price since launch.
However, if the BNB ecosystem and meme coins regain traction, BROCCOLI could benefit, especially given the popularity of dog-related meme coins like Dogecoin and Shiba Inu. In this bullish scenario, BROCCOLI could rise to test the resistance at $0.113.
Disclaimer
In line with the Trust Project guidelines, this price analysis article is for informational purposes only and should not be considered financial or investment advice. BeInCrypto is committed to accurate, unbiased reporting, but market conditions are subject to change without notice. Always conduct your own research and consult with a professional before making any financial decisions. Please note that our Terms and Conditions, Privacy Policy, and Disclaimers have been updated.

Pi Network Faced Legal Battles Before Mainnet Launch

Trump Is Taking Bitcoin ‘Serious’, Says BPI Director

Bitcoin Realized Volatility Near Historic Lows — What This Means For Price
Will Dogecoin Price Soar 200% As DOGE ETF Approval Odds Hit 75%?

iDEGEN finishes the presale race with hype as investors fear missing out

Utah Moves Closer To Bitcoin Reserve As Bill Advances To Senate Standing Committee

2.52 Million Altcoins Are Ruining Crypto’s Future

Animoca Brands Valuation Tanks 75% In Two Years, Here’s Why

Crypto exchange BingX hacked for $43 million

Are The Big Players Losing Interest?

Hong Kong’s Securities Association Tips Authorities On Crypto Self-Regulation

Coinbase cbBTC Set to go Live on Solana
2.52 Million Altcoins Are Ruining Crypto’s Future
Animoca Brands Valuation Tanks 75% In Two Years, Here’s Why
Crypto exchange BingX hacked for $43 million
Are The Big Players Losing Interest?
Hong Kong’s Securities Association Tips Authorities On Crypto Self-Regulation
Coinbase cbBTC Set to go Live on Solana
-

 Ethereum23 hours ago
Bitcoin Pepe set to reap big from its virality, fundamentals, and timing
-

 Market21 hours ago
Kanye West is Launching His Token Despite Past Criticism
-

 Market24 hours ago
Bybit Assures Stability Amid $5.2 Billion Asset Outflow After Hack
-

 Market23 hours ago
Mantle (MNT) Falls 10% as Bybit Hack Rattles Investors
-
 Altcoin23 hours ago
Lawyer Estimates Maximum Timeframe for Ripple vs SEC Case Dismissal
-
 Altcoin22 hours ago
Litecoin Whales On Buying Spree Sack 930K Coins Amid LTC ETF Buzz, What’s Next?
-

 Market20 hours ago
Myanmar Junta Leader’s Social Media Hijacaked for Crypto Fraud
-
 Market19 hours ago
Bitcoin Could Rebound to $100,000 Soon Despite Bearish Pressure