
Market
Uniswap (UNI) Price Soars 10% After Unichain Announcement

Uniswap (UNI) price raised more than 10% after Uniswap Labs announced the launch of its own Layer-2, Unichain. This surge in price has driven the Relative Strength Index (RSI) to overbought levels, suggesting strong buying momentum.
The rapid increase has brought caution to the market, as overbought conditions may lead to a pullback. Key resistance and support levels will be critical in determining UNI’s next price movements.
UNI RSI Suggests Overbought Conditions
UNI’s RSI is currently at 80, up sharply from 58 in just a few hours after news about Unichain. This quick increase suggests strong buying momentum as investors reacted positively to the news.
RSI, or Relative Strength Index, measures the speed and change of price movements and is used to determine whether an asset is overbought or oversold. It ranges from 0 to 100, with values above 70 indicating overbought conditions and values below 30 signaling oversold conditions.
Read more: How To Buy Uniswap (UNI) and Everything You Need To Know
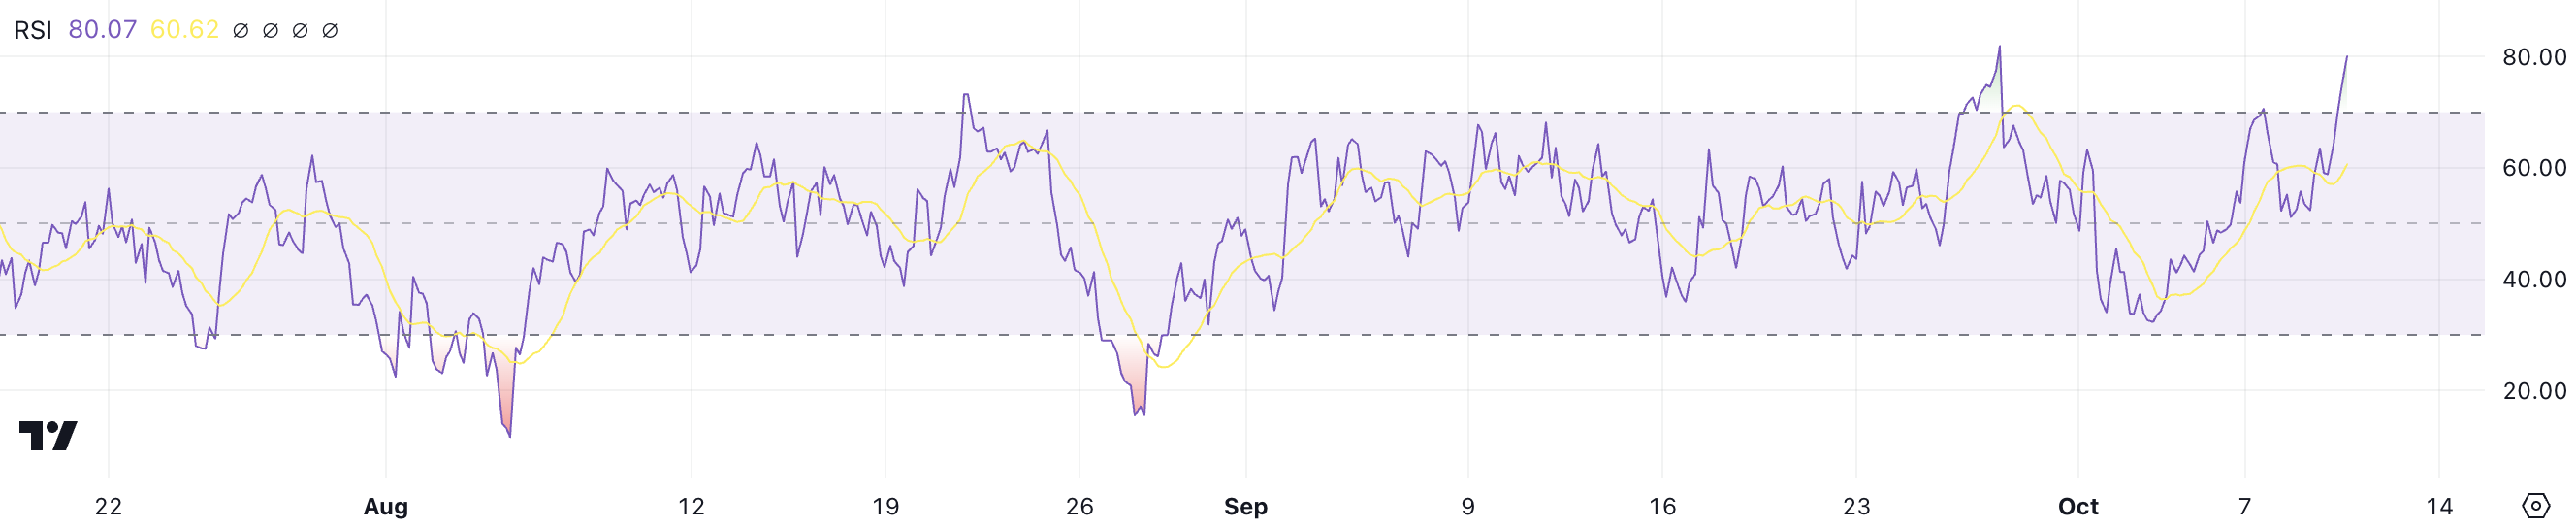
With an RSI of 80, UNI has entered an overbought stage, meaning that the recent price surge may have pushed the asset beyond its fair value in the short term. Overbought conditions often imply that a correction or pullback could be imminent as the buying frenzy cools off.
Investors should be cautious, as prices may become more volatile and susceptible to downward pressure if profit-taking begins. The current high RSI level indicates that UNI’s price rapid rally could soon face resistance, potentially leading to a short-term price correction.
Uniswap ADX Indicates Moderate Trend Strength
UNI’s ADX is currently at 28, up from 19 in just a few hours. This increase in ADX indicates that the strength of the current trend has been gaining momentum. ADX, or Average Directional Index, measures the strength of a trend, regardless of its direction.
It ranges from 0 to 100, with values above 25 generally indicating a strong trend and values below 20 suggesting a weak or nonexistent trend.
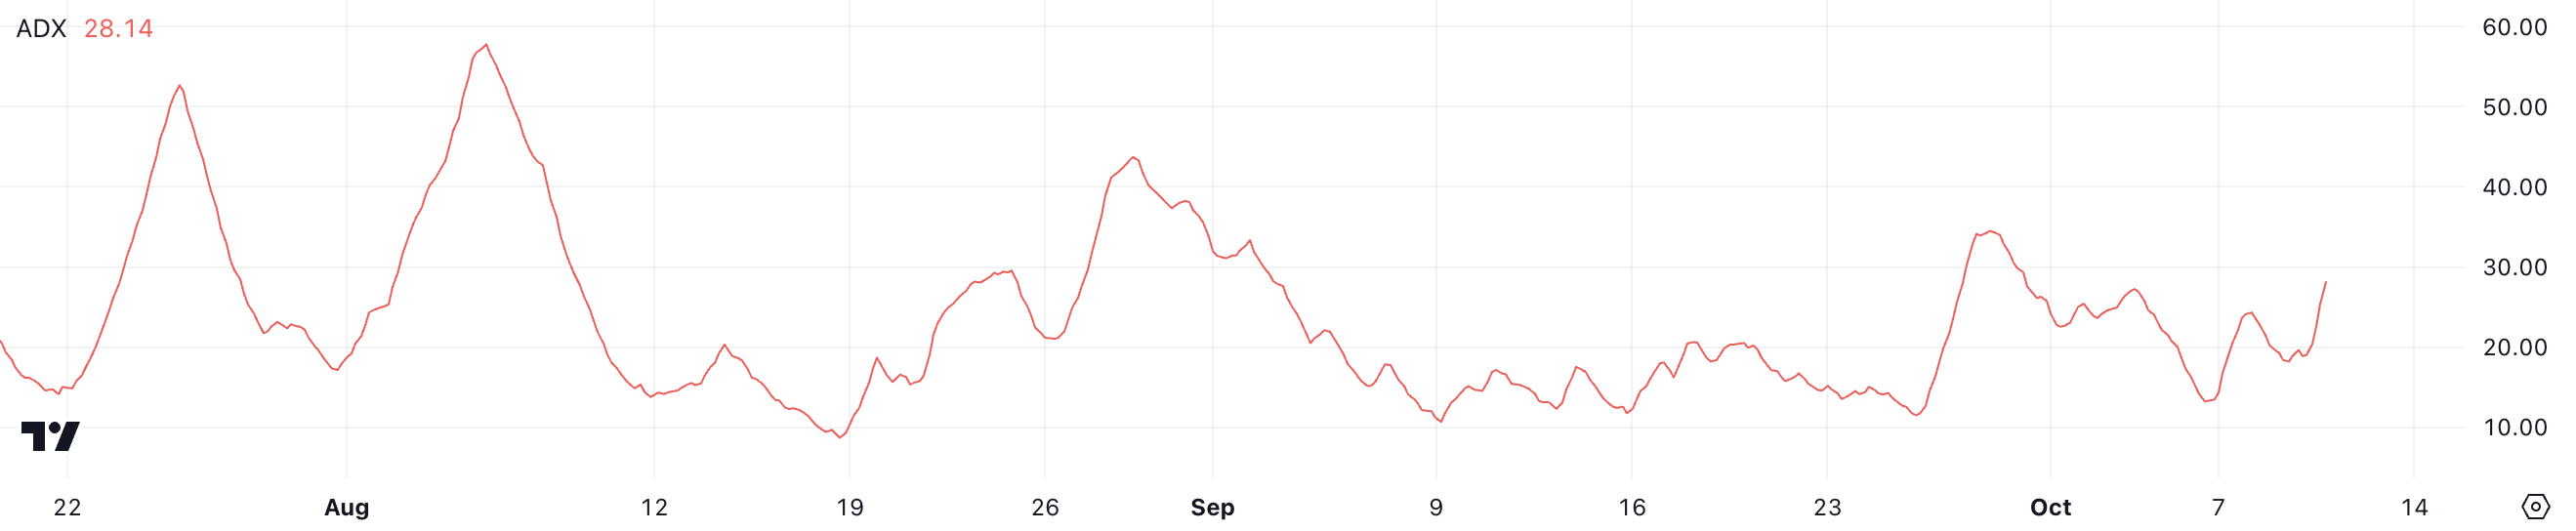
Even with ADX at 28, it is still below the levels seen in previous months when both uptrends and downtrends were much stronger. Although UNI’s price increased by over 10% in just a day, the current ADX suggests that the trend may not be as strong as it could be.
This indicates that while there is some momentum, it is not yet at the levels that would imply a sustained or particularly powerful movement. Traders should remain cautious, as the current trend strength might not be enough to prevent a potential reversal or significant volatility in the near term.
UNI Price Prediction: EMA Lines Indicate Potential Uptrend
UNI’s EMA lines are currently suggesting a clear uptrend, with the short-term lines positioned above the long-term ones and maintaining a fair distance between them. This configuration typically signals a bullish trend, indicating that recent price action has been favorable.
EMA lines, or Exponential Moving Averages, are a type of moving average that gives more weight to recent prices, making it more responsive to short-term movements. Traders use them to identify ongoing trends and potential reversals by observing the relationship between short-term and long-term moving averages.
Read more: Uniswap (UNI) Price Prediction 2023/2025/2030
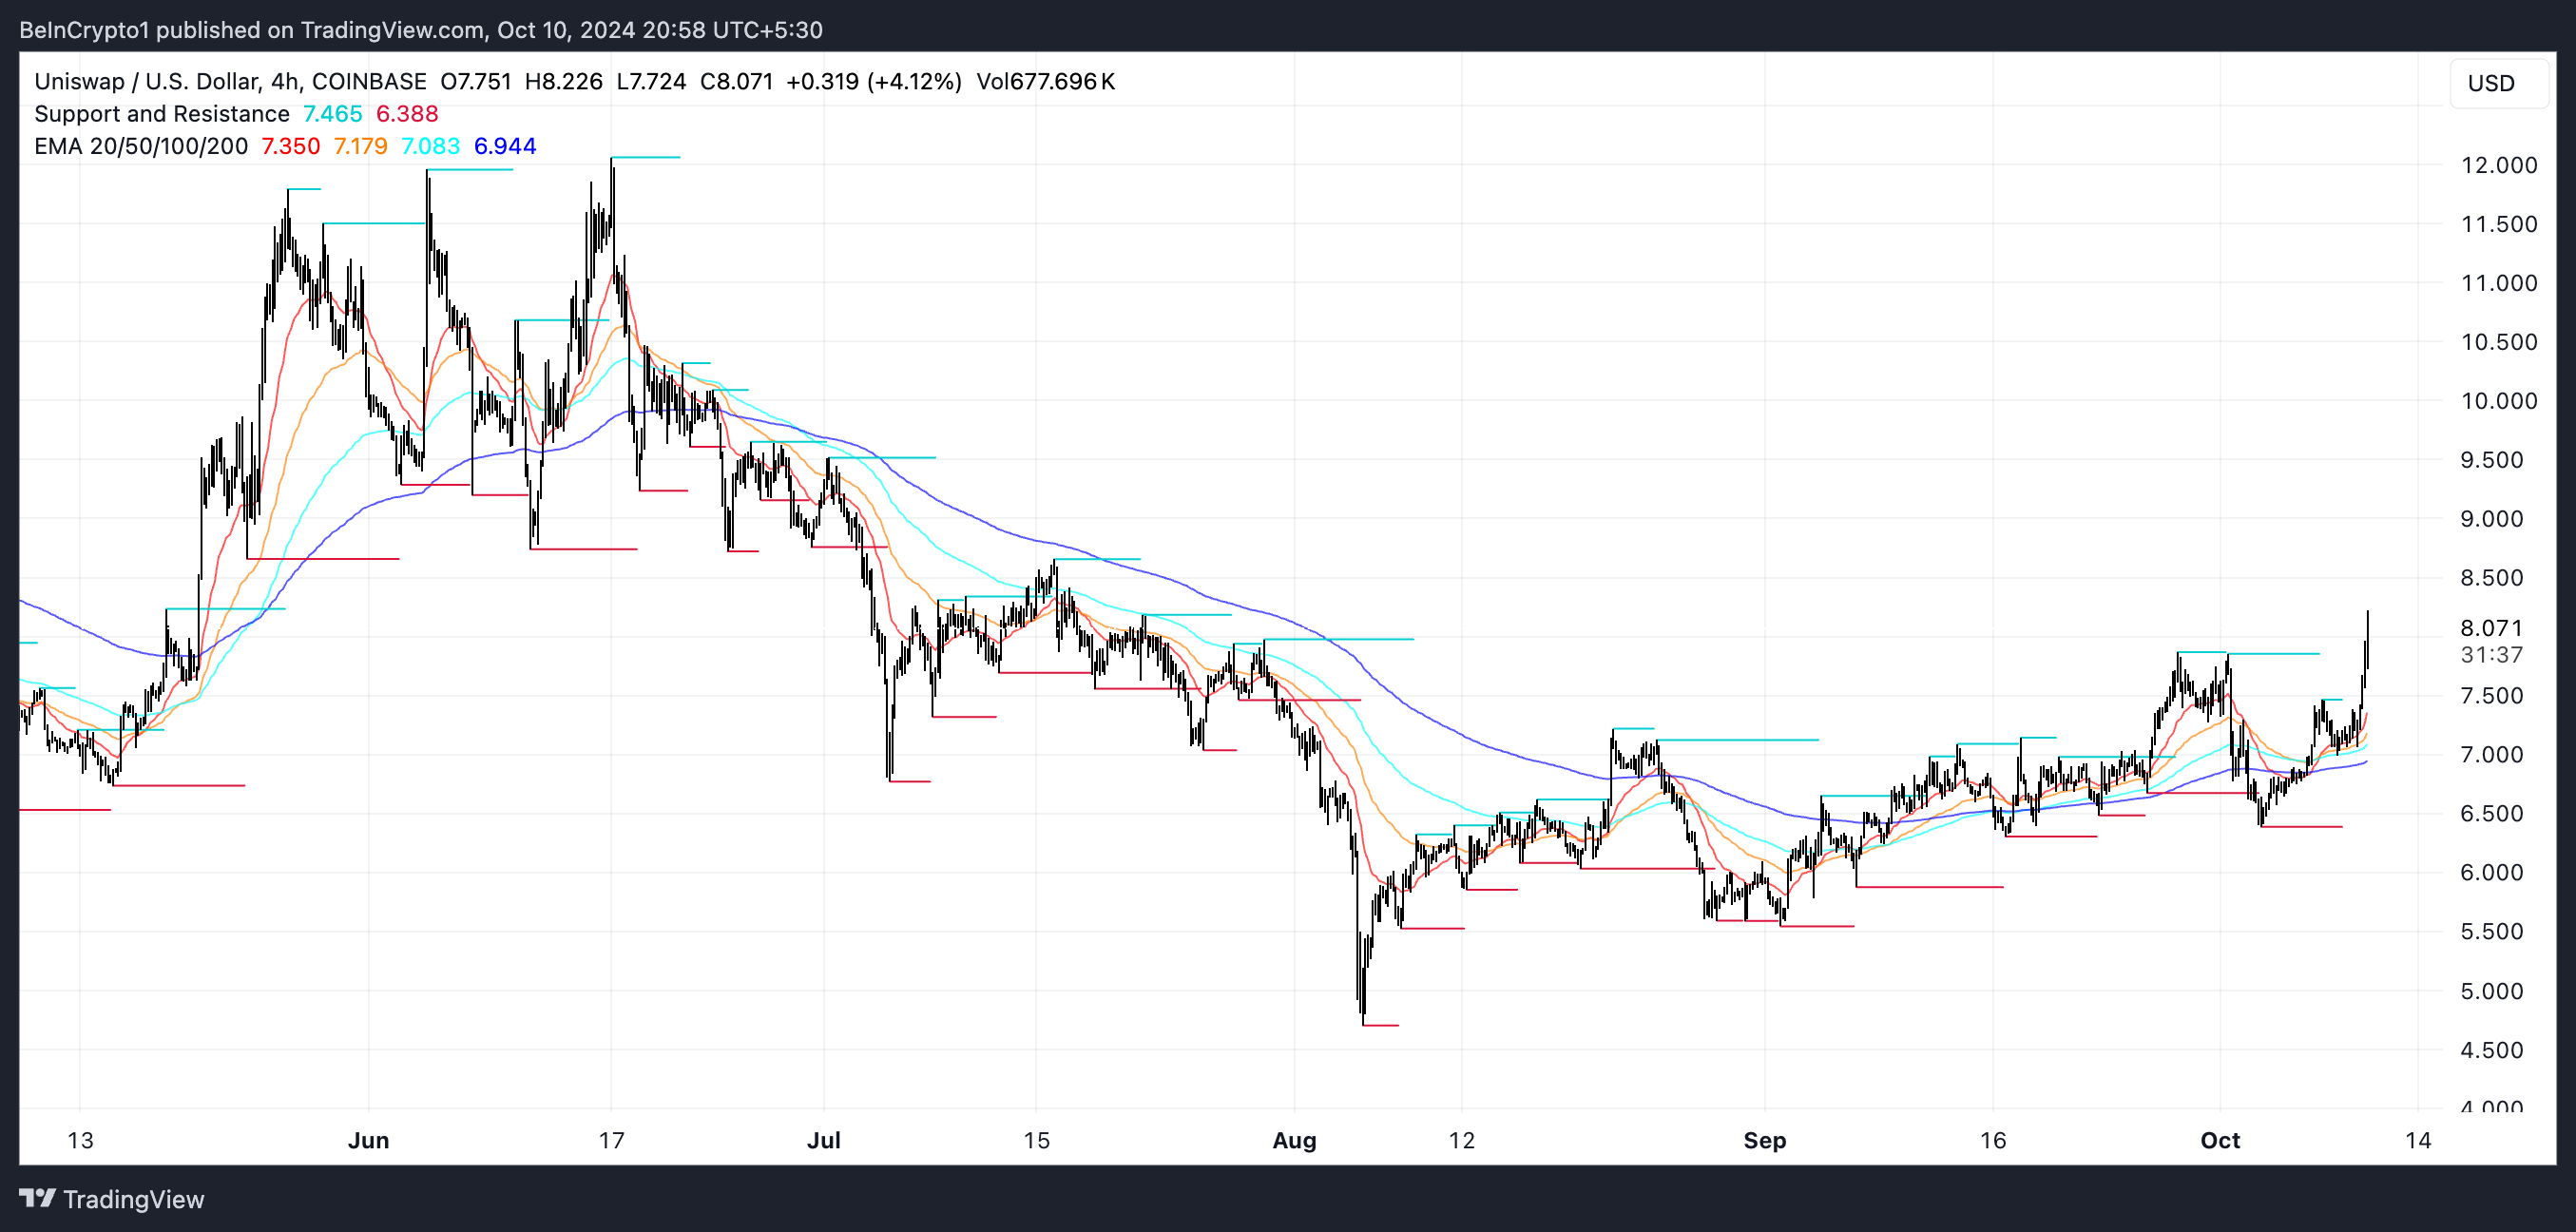
However, as the ADX shows, the current trend is not particularly strong despite the bullish EMA pattern. If the uptrend continues and strengthens, UNI’s price could test resistance levels at $8.65 and $9.52. Breaking through these resistances could push the price as high as $12, which would be its highest since June 2024.
On the other hand, if the recent news about Unichain is not enough to sustain momentum and the trend reverses, UNI may test support levels around $7.7 and $7.5, with the possibility of falling as low as $6. That would represent a potential 28% decline.
Disclaimer
In line with the Trust Project guidelines, this price analysis article is for informational purposes only and should not be considered financial or investment advice. BeInCrypto is committed to accurate, unbiased reporting, but market conditions are subject to change without notice. Always conduct your own research and consult with a professional before making any financial decisions. Please note that our Terms and Conditions, Privacy Policy, and Disclaimers have been updated.


Ethereum, the second-largest cryptocurrency, recently failed to breach $3,524, triggering a sharp price drop. Since then, recovery efforts have remained weak as volatility persists.
However, the current conditions suggest Ethereum may be preparing for a comeback as the market stabilizes.
Ethereum Has Room For Recovery
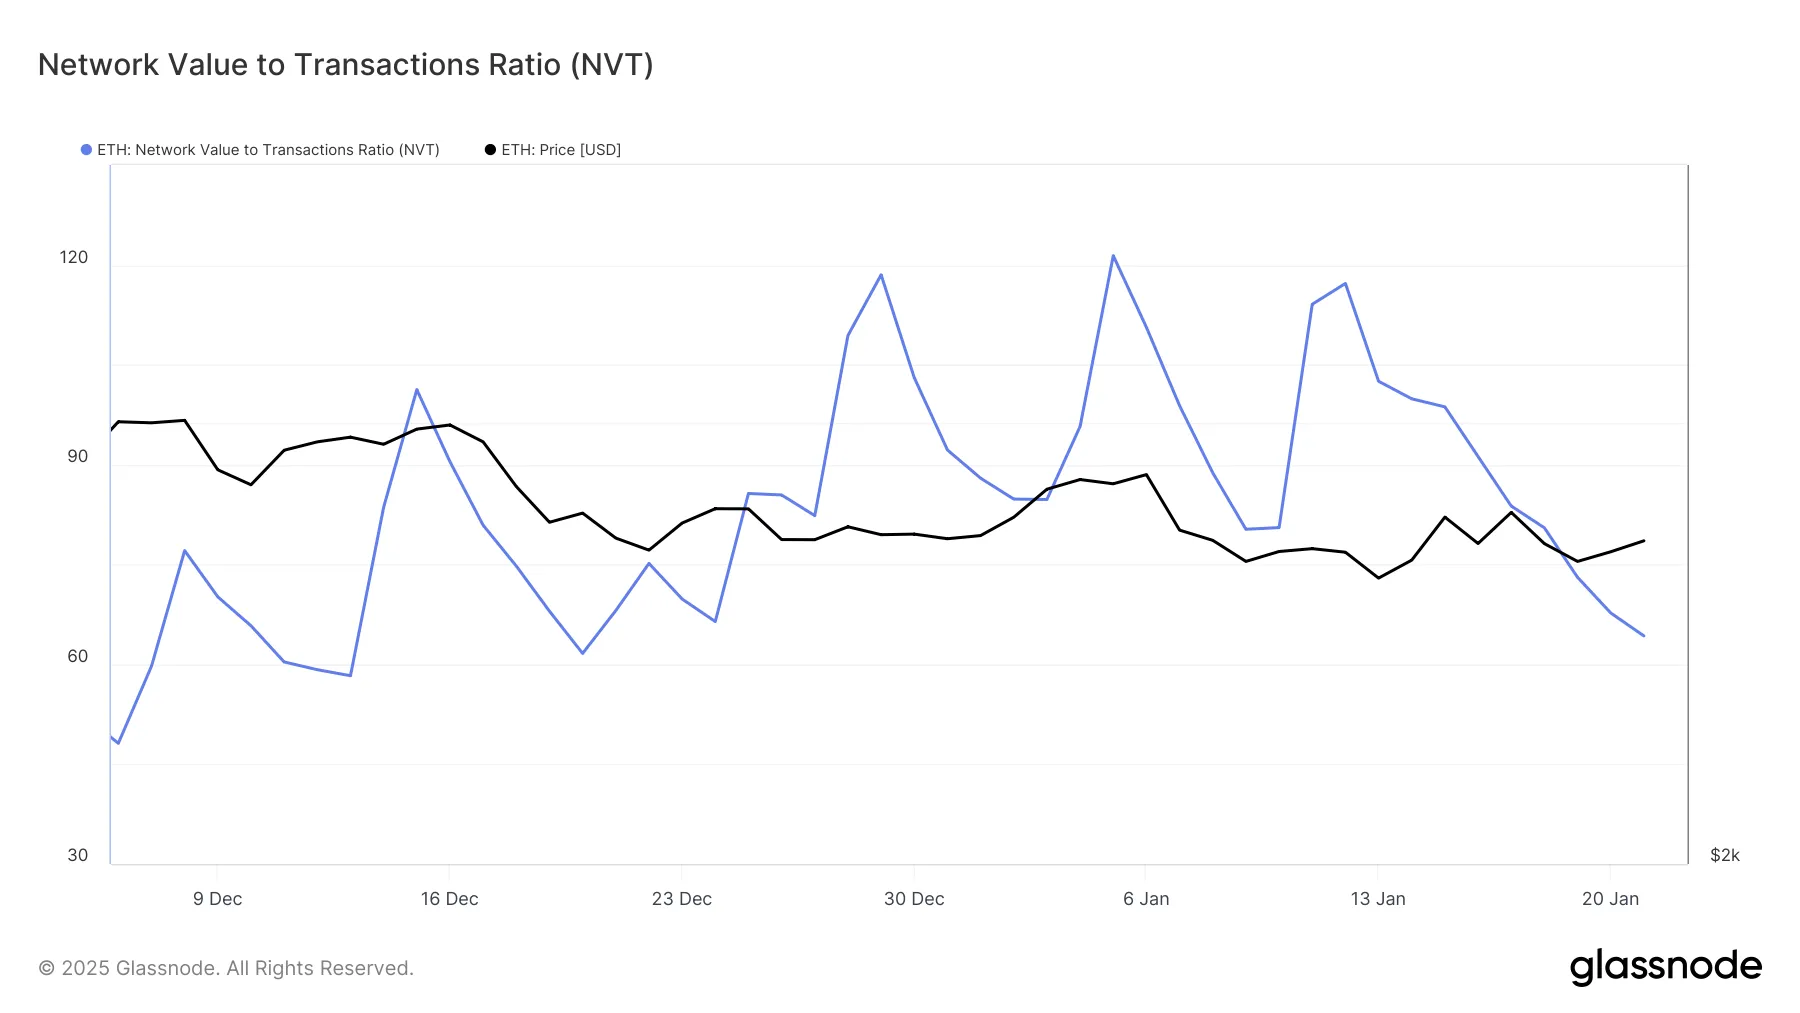
Ethereum’s Network Value to Transaction (NVT) Ratio is experiencing a decline, recently hitting a monthly low. A low NVT indicates that transaction activity is balanced with network value, reflecting reduced volatility. This creates an environment conducive to price recovery, something Ethereum urgently needs to regain its footing.
With the NVT ratio signaling healthy network activity, Ethereum is positioned to stabilize in the short term. Declining volatility often fosters investor confidence, making it more likely for the cryptocurrency to see renewed buying interest. As speculative activity wanes, Ethereum has an opportunity to chart a path toward meaningful recovery.
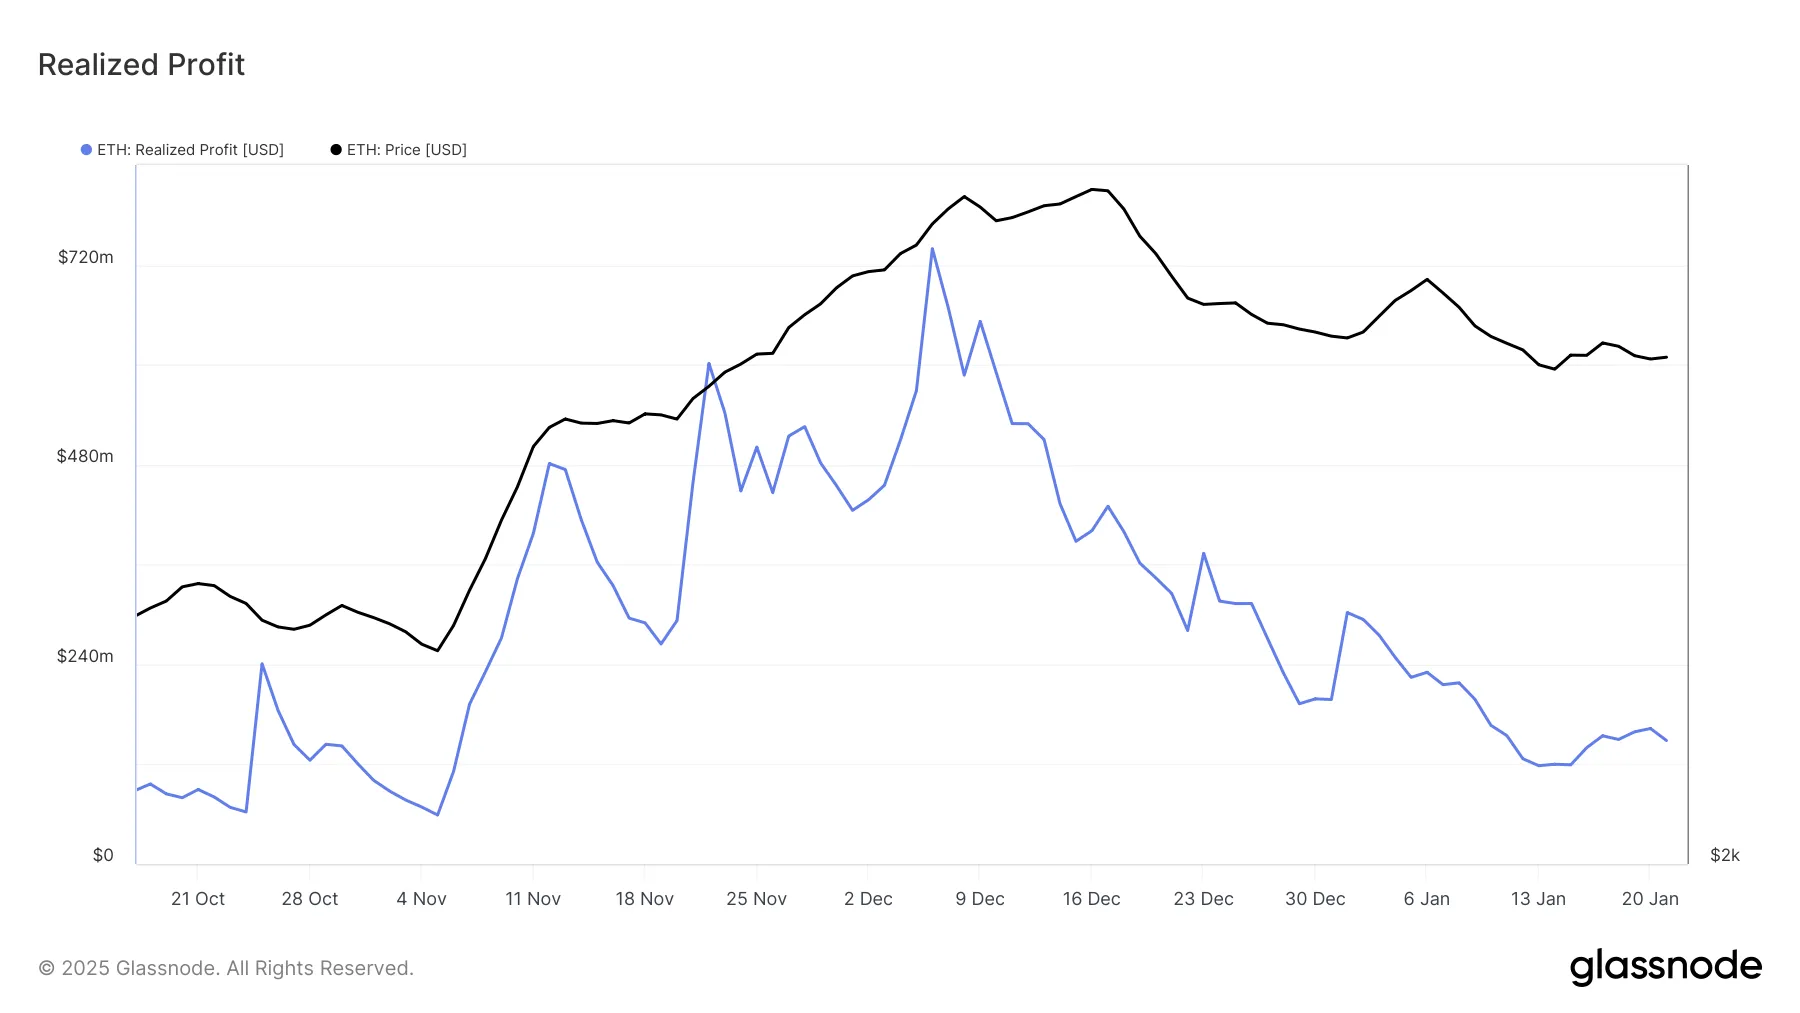
Ethereum’s realized profits recently dropped to a six-week low, pointing to a significant reduction in selling pressure from investors. This trend highlights the market’s shifting sentiment, with fewer participants looking to offload their holdings. Such conditions could provide Ethereum with the breathing room required to capitalize on broader bullish cues.
The lack of an uptick in realized profits suggests that the selling lull may persist, allowing Ethereum to focus on building upward momentum. With investors holding onto their coins, market conditions are primed for a gradual recovery, provided external factors remain favorable.
ETH Price Prediction: Breaking The Barrier
Ethereum is currently trading near $3,300, just below the critical resistance level of $3,327. Flipping this into support is essential for ETH to initiate a rally toward $3,524, representing a 6% increase from current levels. This move would mark a partial recovery from recent losses.
Breaking through the $3,524 resistance is crucial for Ethereum’s recovery. Achieving this would erase the recent downturn and also position the altcoin for further gains, potentially targeting $3,711. Such a move would underscore Ethereum’s resilience and align with the broader market’s bullish sentiment.
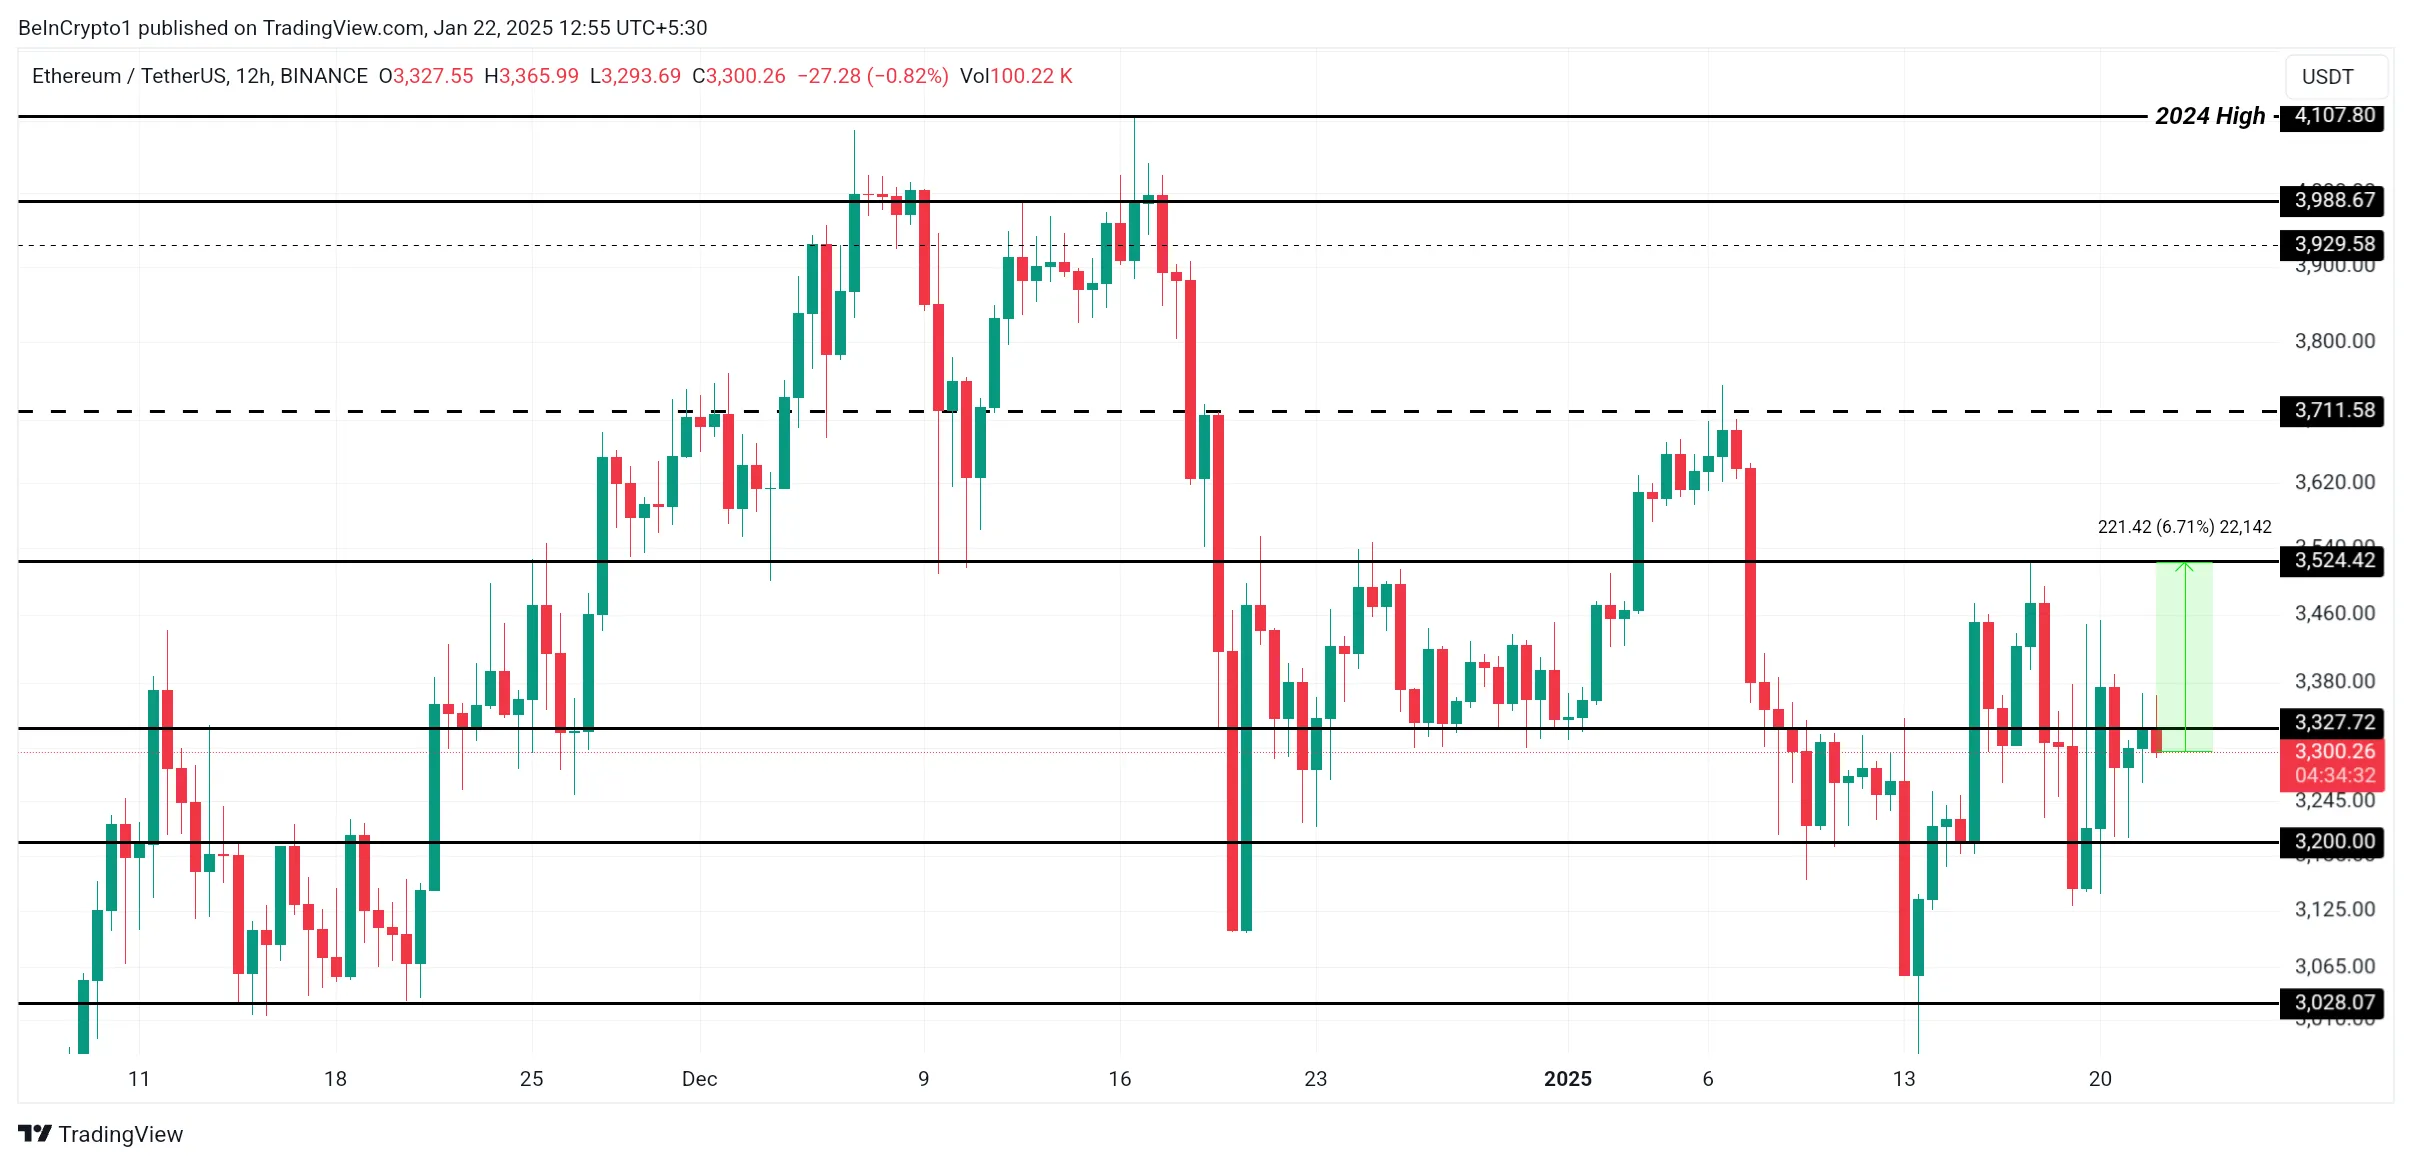
However, failing to establish $3,327 as a support level could stall Ethereum’s recovery. This scenario would leave the cryptocurrency vulnerable to a retracement toward $3,200, undermining recent progress and potentially delaying its path to $3,500.
Disclaimer
In line with the Trust Project guidelines, this price analysis article is for informational purposes only and should not be considered financial or investment advice. BeInCrypto is committed to accurate, unbiased reporting, but market conditions are subject to change without notice. Always conduct your own research and consult with a professional before making any financial decisions. Please note that our Terms and Conditions, Privacy Policy, and Disclaimers have been updated.

TRON founder Justin Sun has offered a hypothetical plan for Ethereum and the Ethereum Foundation (EF) under his leadership. His remarks come amid controversy over EF’s leadership transformation.
In a series of posts on X (formerly Twitter), Ethereum co-founder Vitalik Buterin outlined the reforms’ goals and progress. He highlighted improvements in technical expertise, ecosystem engagement, and operational efficiency.
Justin Sun Outlines Blueprint for Ethereum Leadership
The TRON executive shared ambitious remarks on how he would lead the Ethereum Foundation if given the opportunity. Sun’s vision, shared on X, outlined a four-point plan to radically restructure EF operations, optimize Ethereum’s economic model, and drive the price of ETH to $10,000.
“If EF and Ethereum were under my leadership, ETH would hit $10,000,” Sun claimed.
Sun proposed an immediate halt to ETH sales for three years to stabilize supply and boost market confidence. He suggested covering EF’s operational costs through DeFi protocols like Aave, staking yields, and stablecoin borrowing, aligning with Ethereum’s deflationary goals.
A key component of his plan involves imposing significant taxes on Layer 2 (L2) solutions, aiming to generate $5 billion annually. The collected taxes would go toward exclusively repurchasing and burning ETH, further enhancing its scarcity and value.
Sun also called for a drastic downsizing of EF staff, retaining only top performers and offering them significant salary increases. This merit-based approach, he argued, would streamline operations and improve efficiency.
Finally, Sun emphasized adjusting node rewards and increasing fee burns to reinforce Ethereum’s deflationary narrative. He proposed redirecting all resources toward Ethereum’s core L1 development, focusing on scalability, security, and adoption. Justin Sun’s plan sparked a mixed response, with some applauding the bold vision.
“These are all very practical suggestions. Please pay attention to them and refer to them, Vitalik Buterin,” core developer 0xSea.eth posed.
Meanwhile, others challenged Sun to focus on TRON and explore bringing decentralized finance (DeFi) to its ecosystem.
“Maybe start with how to make DeFi great on TRON – you should ask your exec team (and yourself), “Why is DeFi nonexistent on TRON despite it being the chain with the most stable coins on it?” If you answer this, maybe TRON can beat eth one day,” ZIGChain co-founder Abdul Rafay Gadit remarked.
Vitalik Buterin Defends Leadership Amid Criticism
Sun’s proposed solution aligns with Vitalik Buterin’s recent post discussing ongoing changes over the past year, some of which have already been implemented. Buterin emphasized goals such as strengthening the EF’s technical leadership and improving collaboration with ecosystem participants. He also addressed concerns, rejecting the notion that the EF might adopt centralized or politically motivated roles.
“…these things aren’t what EF does and this isn’t going to change. People seeking a different vision are welcome to start their orgs,” Buterin articulated.
Aya Miyaguchi, an EF executive, confirmed the ongoing efforts, expressing excitement about forthcoming announcements. She noted that the reforms aim to solidify Ethereum’s position as a global neutral platform while embracing decentralized and privacy-preserving technologies.
The announcement has stirred controversy within the crypto community. Critics argue that the current leadership has failed to manage Ethereum effectively.
“Respectfully, just let new blood take over. You guys can’t even make a simple Twitter account work—how can you be trusted to lead the second biggest blockchain,” Wazz posed.
Another user, Coinmamba, suggested that pressuring Miyaguchi to resign could result in Ethereum reaching new all-time high. Buterin strongly condemned these comments, defending Miyaguchi and calling out the toxicity of such social media rhetoric.
“No. This is not how this game works,” Buterin retorted. “The person deciding the new EF leadership team is me. If you ‘keep the pressure on,’ then you are creating an environment that is actively toxic to top talent. YOU ARE MAKING MY JOB HARDER,” the Ethereum co-founder lamented.
Buterin also refuted specific claims against Miyaguchi, pointing out inaccuracies in translations and misinterpretations of her statements. He reiterated the need for a “proper board” within EF to enhance governance.
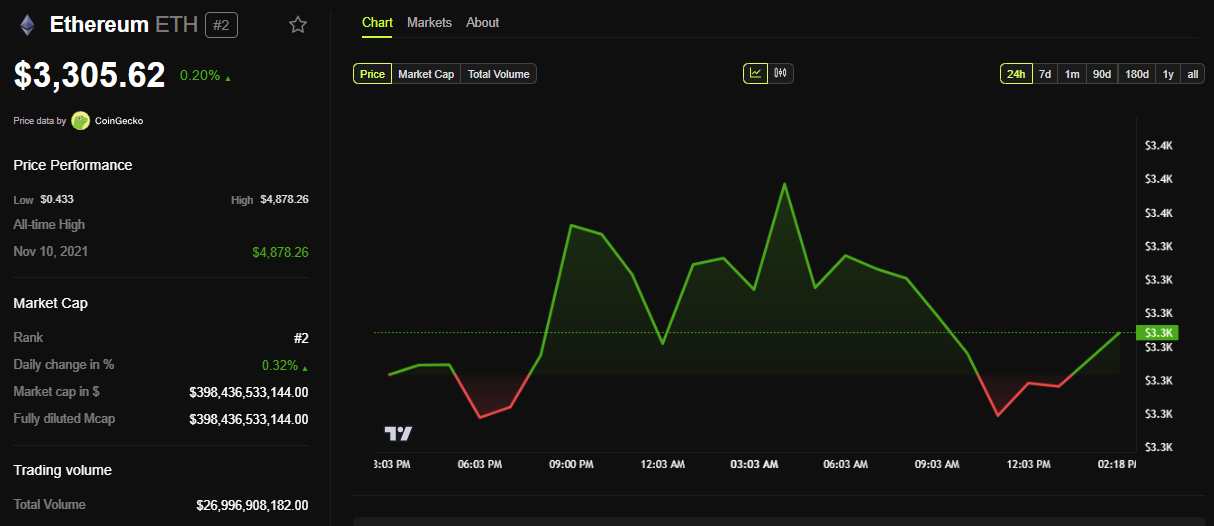
Ethereum’s ETH token was trading at $3,305 as of this writing, representing a modest 0.2% surge since Wednesday’s session opened.
Disclaimer
In adherence to the Trust Project guidelines, BeInCrypto is committed to unbiased, transparent reporting. This news article aims to provide accurate, timely information. However, readers are advised to verify facts independently and consult with a professional before making any decisions based on this content. Please note that our Terms and Conditions, Privacy Policy, and Disclaimers have been updated.

Dogecoin (DOGE), a leading meme coin, is signaling a potential breakout from its narrow trading range.
If this momentum continues, it could reclaim its multi-year high of $0.48, fueled by extended holding periods and increased accumulation by large holders.
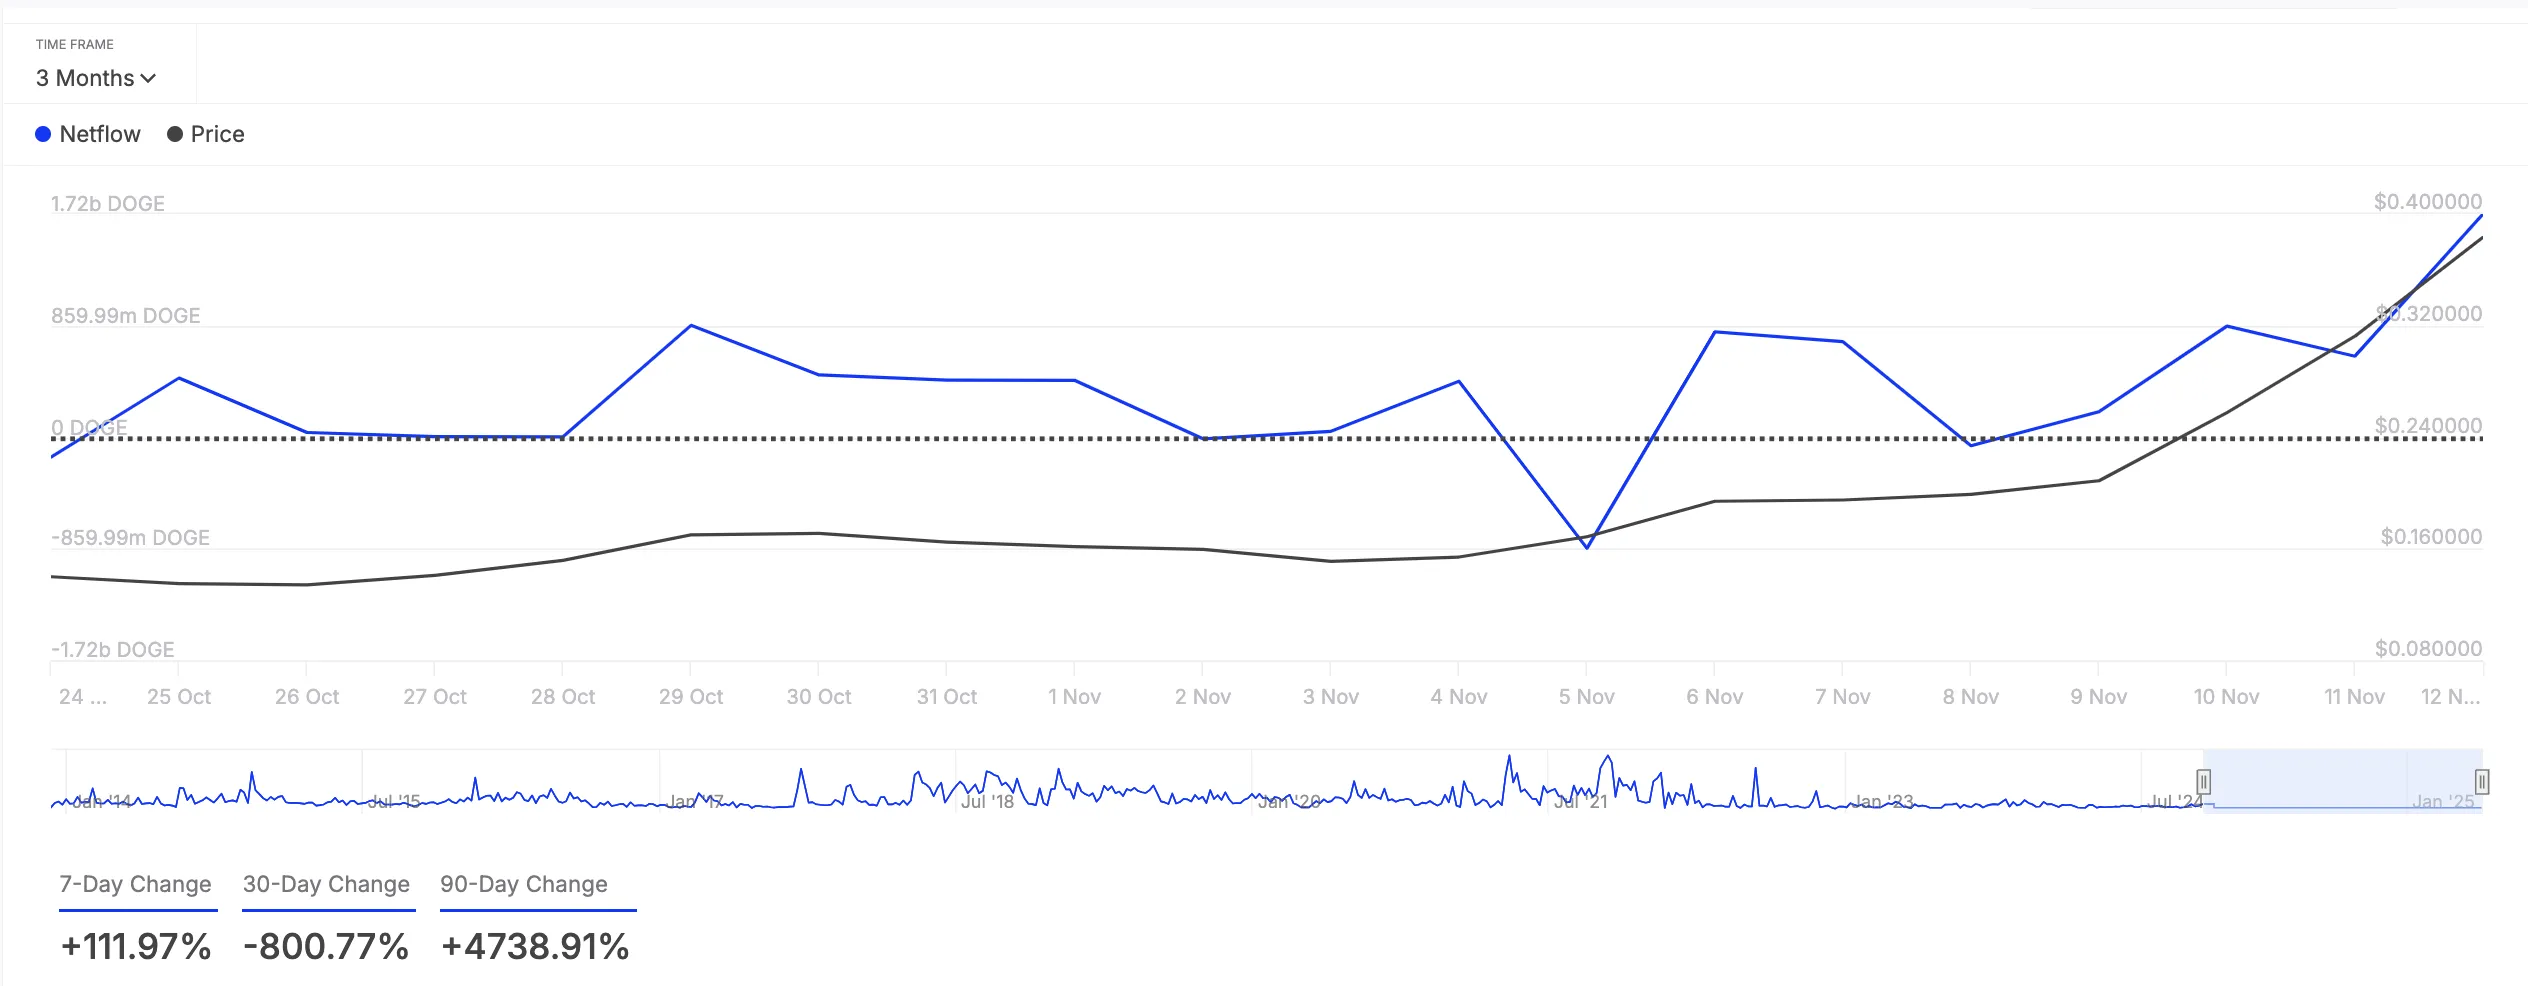
Dogecoin Investors Reduce Distribution
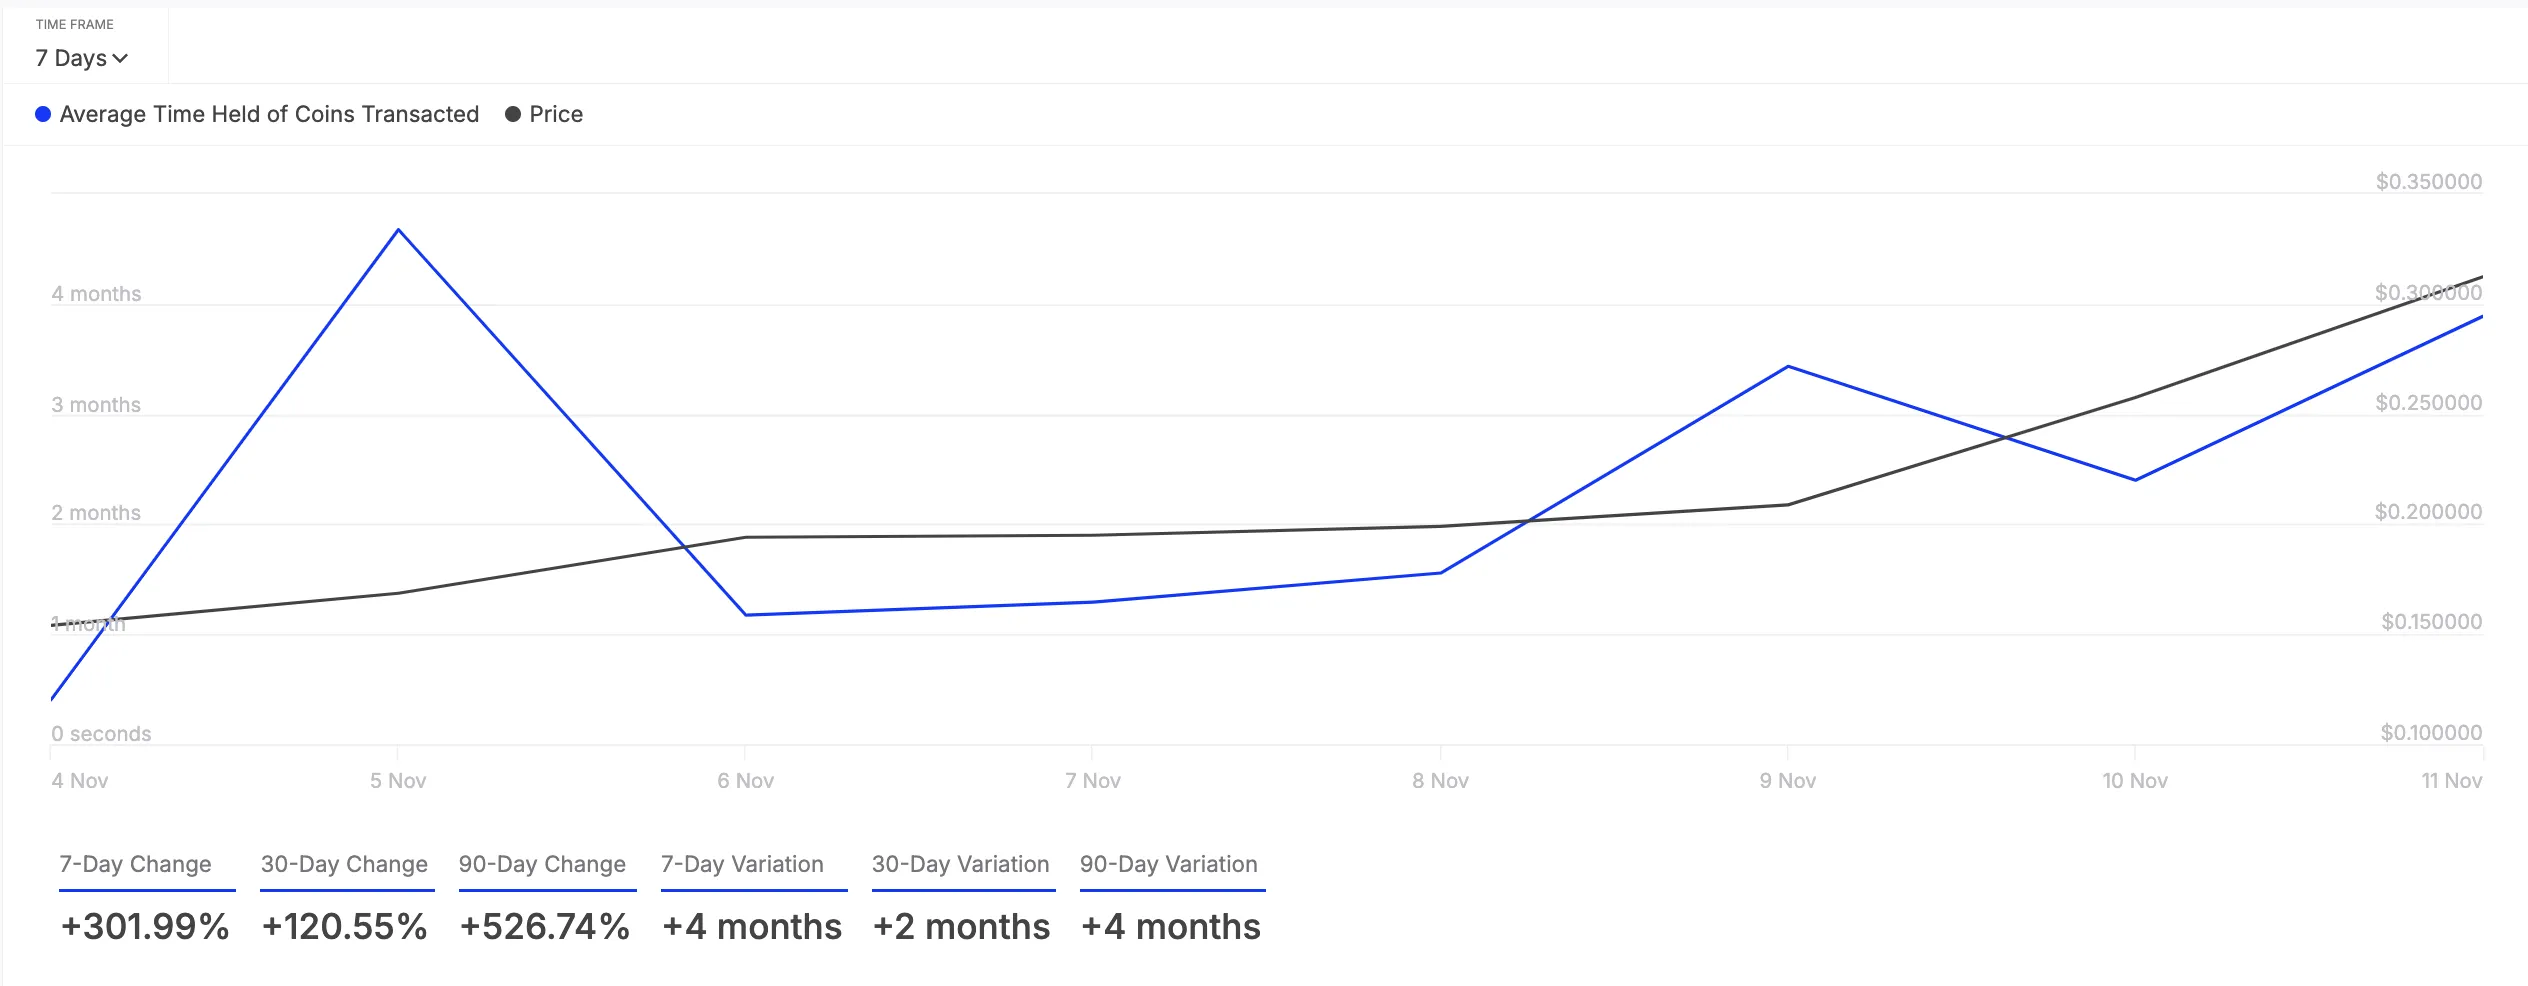
The on-chain assessment of DOGE’s performance has revealed a significant spike in the holding time of all its coins transacted in the past seven days. According to IntoTheBlock, this has climbed by 302% during the review period.
The holding time of an asset’s transacted coins represents the average duration tokens are kept in wallets before being sold or transferred.
Longer holding periods like this reduce selling pressure in the DOGE market. This reflects stronger investor conviction, as investors choose to keep their coins rather than sell them.
In addition to reducing selling activity, DOGE whales have increased their holdings over the past week. This is reflected by the 112% uptick in its large holders’ netflow during that period.
An asset’s large holders’ netflow metric tracks the movement of coins into and out of wallets controlled by whales or institutional investors. When this metric spikes, it suggests that these large holders are accumulating more of the asset, signaling increased confidence in its future price movement.
DOGE Price Prediction: Bullish Run Could Continue
If this bullish momentum is maintained, DOGE will extend its weekly 3% spike. As buying pressure strengthens, the meme coin could revisit its four-year high of $0.48.
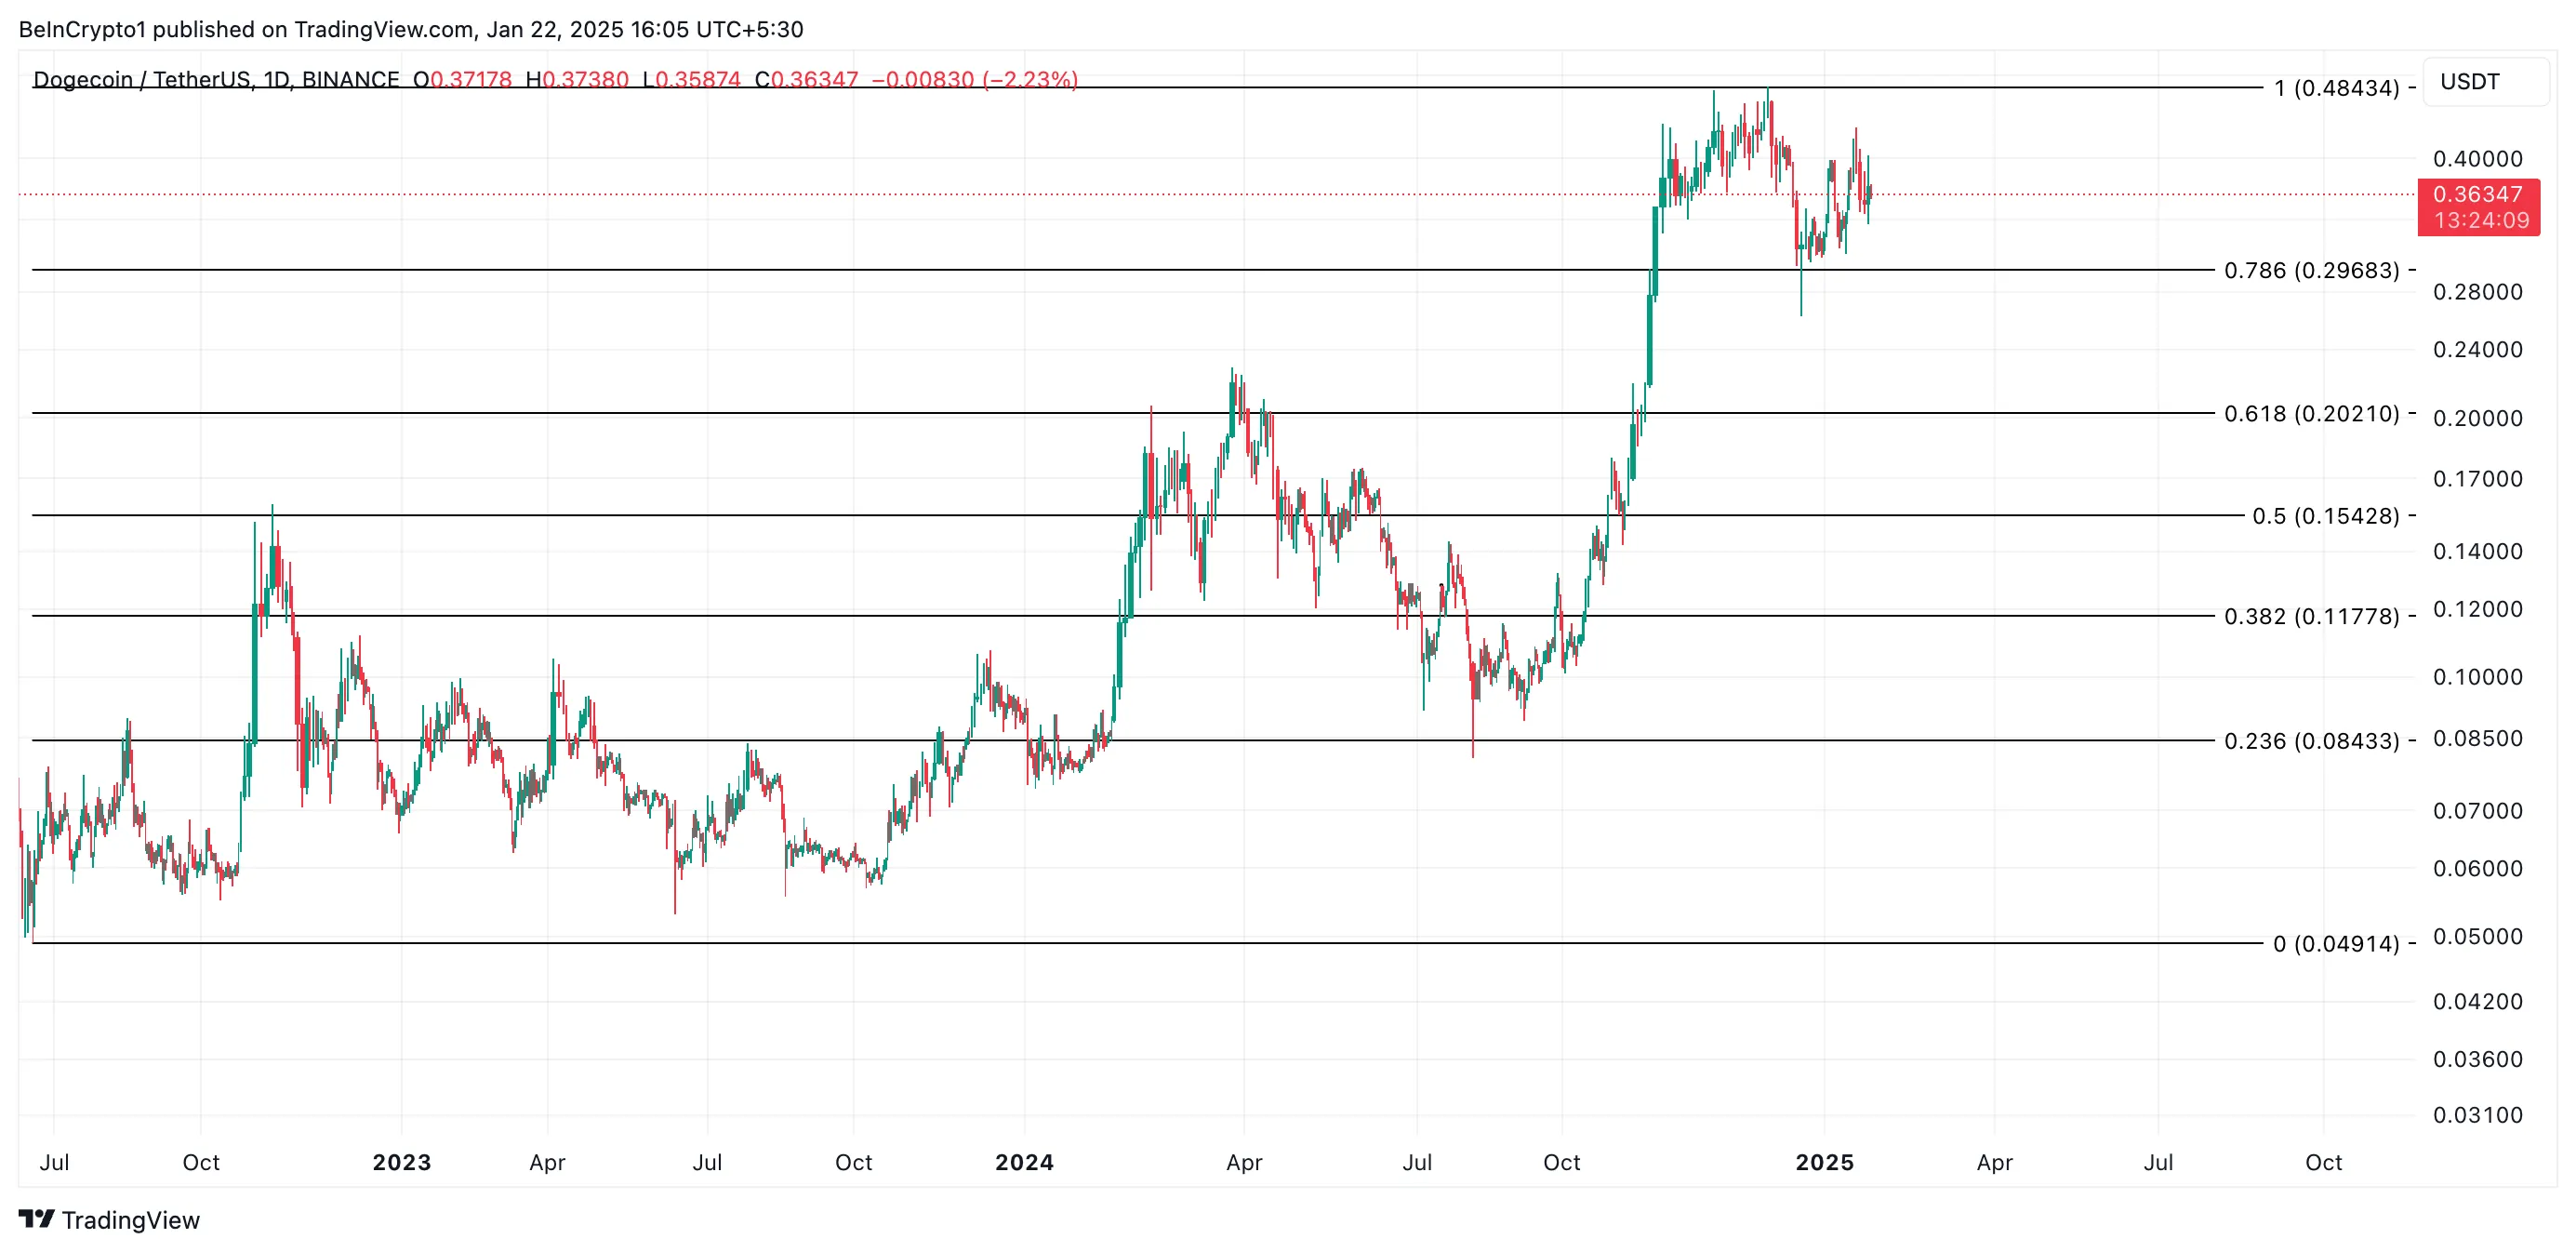
However, this bullish outlook will be invalidated if accumulation stalls and selling activity recommences. In that scenario, DOGE’s price could slip to $0.29.
Disclaimer
In line with the Trust Project guidelines, this price analysis article is for informational purposes only and should not be considered financial or investment advice. BeInCrypto is committed to accurate, unbiased reporting, but market conditions are subject to change without notice. Always conduct your own research and consult with a professional before making any financial decisions. Please note that our Terms and Conditions, Privacy Policy, and Disclaimers have been updated.
Ethereum Price Can Reach $3,500 On The Back Of These Factors

US Bitcoin Revolution Begins, Senator Lummis Says

Justin Sun, Vitalik Buterin Speak Amid Ethereum Reform Debate
Dogecoin Holding Time and Whale Activity Spikes
Ex-SEC Lawyer Says XRP Lawsuit Settlement Weeks Away
World Liberty Financial Purchases 14,403 Ethereum, ETH Price Rally Ahead?

2.52 Million Altcoins Are Ruining Crypto’s Future

Animoca Brands Valuation Tanks 75% In Two Years, Here’s Why

Crypto exchange BingX hacked for $43 million

Are The Big Players Losing Interest?

Hong Kong’s Securities Association Tips Authorities On Crypto Self-Regulation

Coinbase cbBTC Set to go Live on Solana
2.52 Million Altcoins Are Ruining Crypto’s Future
Animoca Brands Valuation Tanks 75% In Two Years, Here’s Why
Crypto exchange BingX hacked for $43 million
Are The Big Players Losing Interest?
Hong Kong’s Securities Association Tips Authorities On Crypto Self-Regulation
Coinbase cbBTC Set to go Live on Solana
-

 Regulation24 hours ago
Acting SEC Chair Uyeda announces new crypto task force
-

 Regulation22 hours ago
Turkey rolls out new crypto AML regulations
-

 Ethereum18 hours ago
ETH breaks $3,900 as Bitcoin spikes past $103k
-

 Regulation20 hours ago
Crypto custody firm Copper withdraws UK registration
-

 Ethereum21 hours ago
Ethereum ETFs inflows surge as Bitcoin ETFs see major outflows
-

 Market15 hours ago
Weekly Price Analysis: Bitcoin Remains Rangebound while Altcoins Fly
-

 Market21 hours ago
Bitcoin price analysis: economic headwinds push price lower
-

 Market18 hours ago
Top 4 altcoins to buy before the market fully recovers