
Market
Why BONK Price May Remain at the Mercy of Bears

Bonk (BONK), the Solana-based meme coin, faces the risk of further price decline after dropping from $0.000025 to its current value of $0.000019.
Although some traders might view this dip as a buying opportunity, analysis suggests caution. Here are the reasons.
Market Interest in Bonk Dwindles
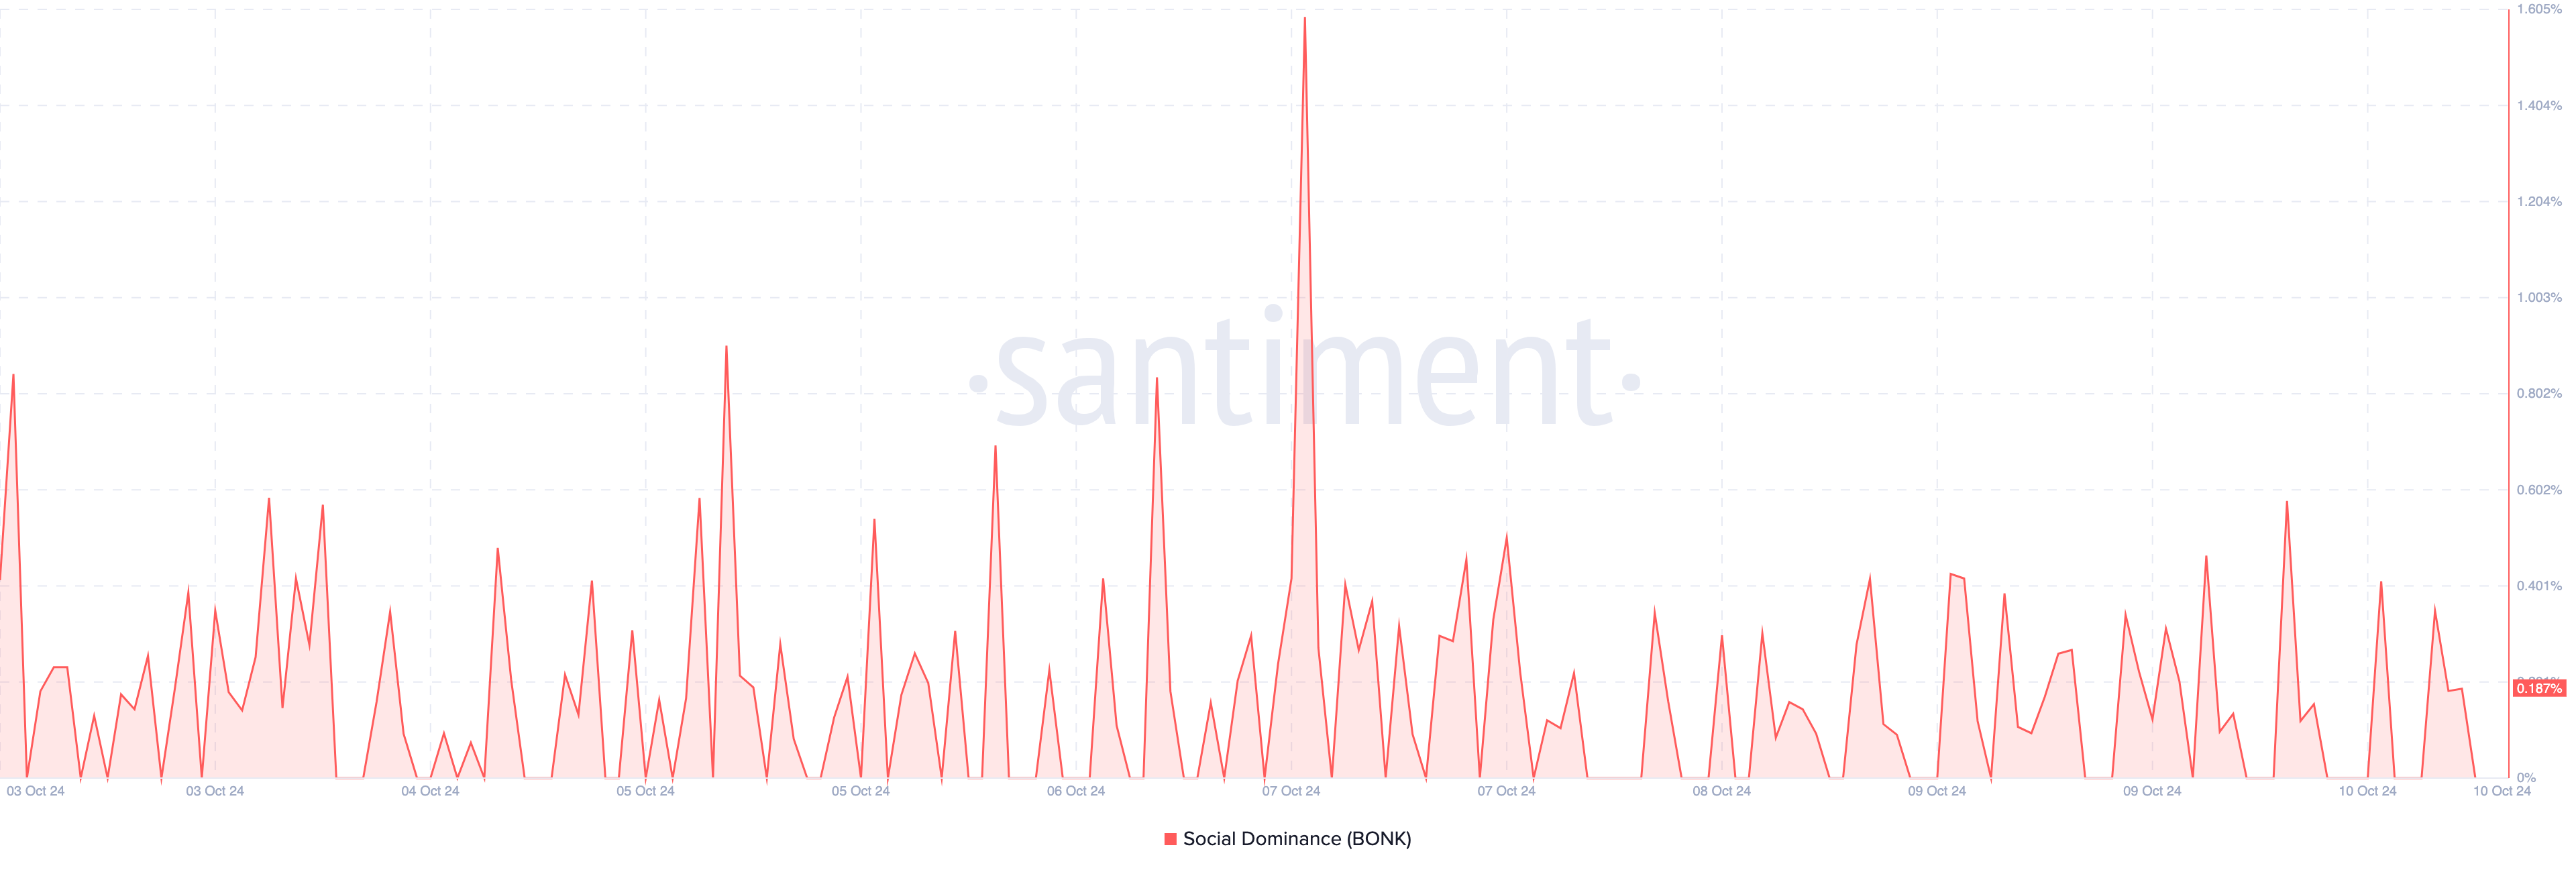
Bonk’s social dominance is one factor suggesting that the meme coin could struggle to recoup some of the lost gains. Social dominance measures the rate of discussion related to a cryptocurrency.
When it increases during a price decrease, it means that the market could be looking at buying the cryptocurrency. In that instance, the price has a good chance of increasing. On the flip side, a decrease in social dominance means that the broader market is overlooking the assets and possibly eyeing other cryptos to buy.
In BONK’s case, social dominance dropped, suggesting that mentions of the meme coin have decreased on several social media platforms. This decline indicates that demand for BONK could be waning, and a price increase might not occur in the short term.
Read more: How to Buy Solana Meme Coins: A Step-By-Step Guide
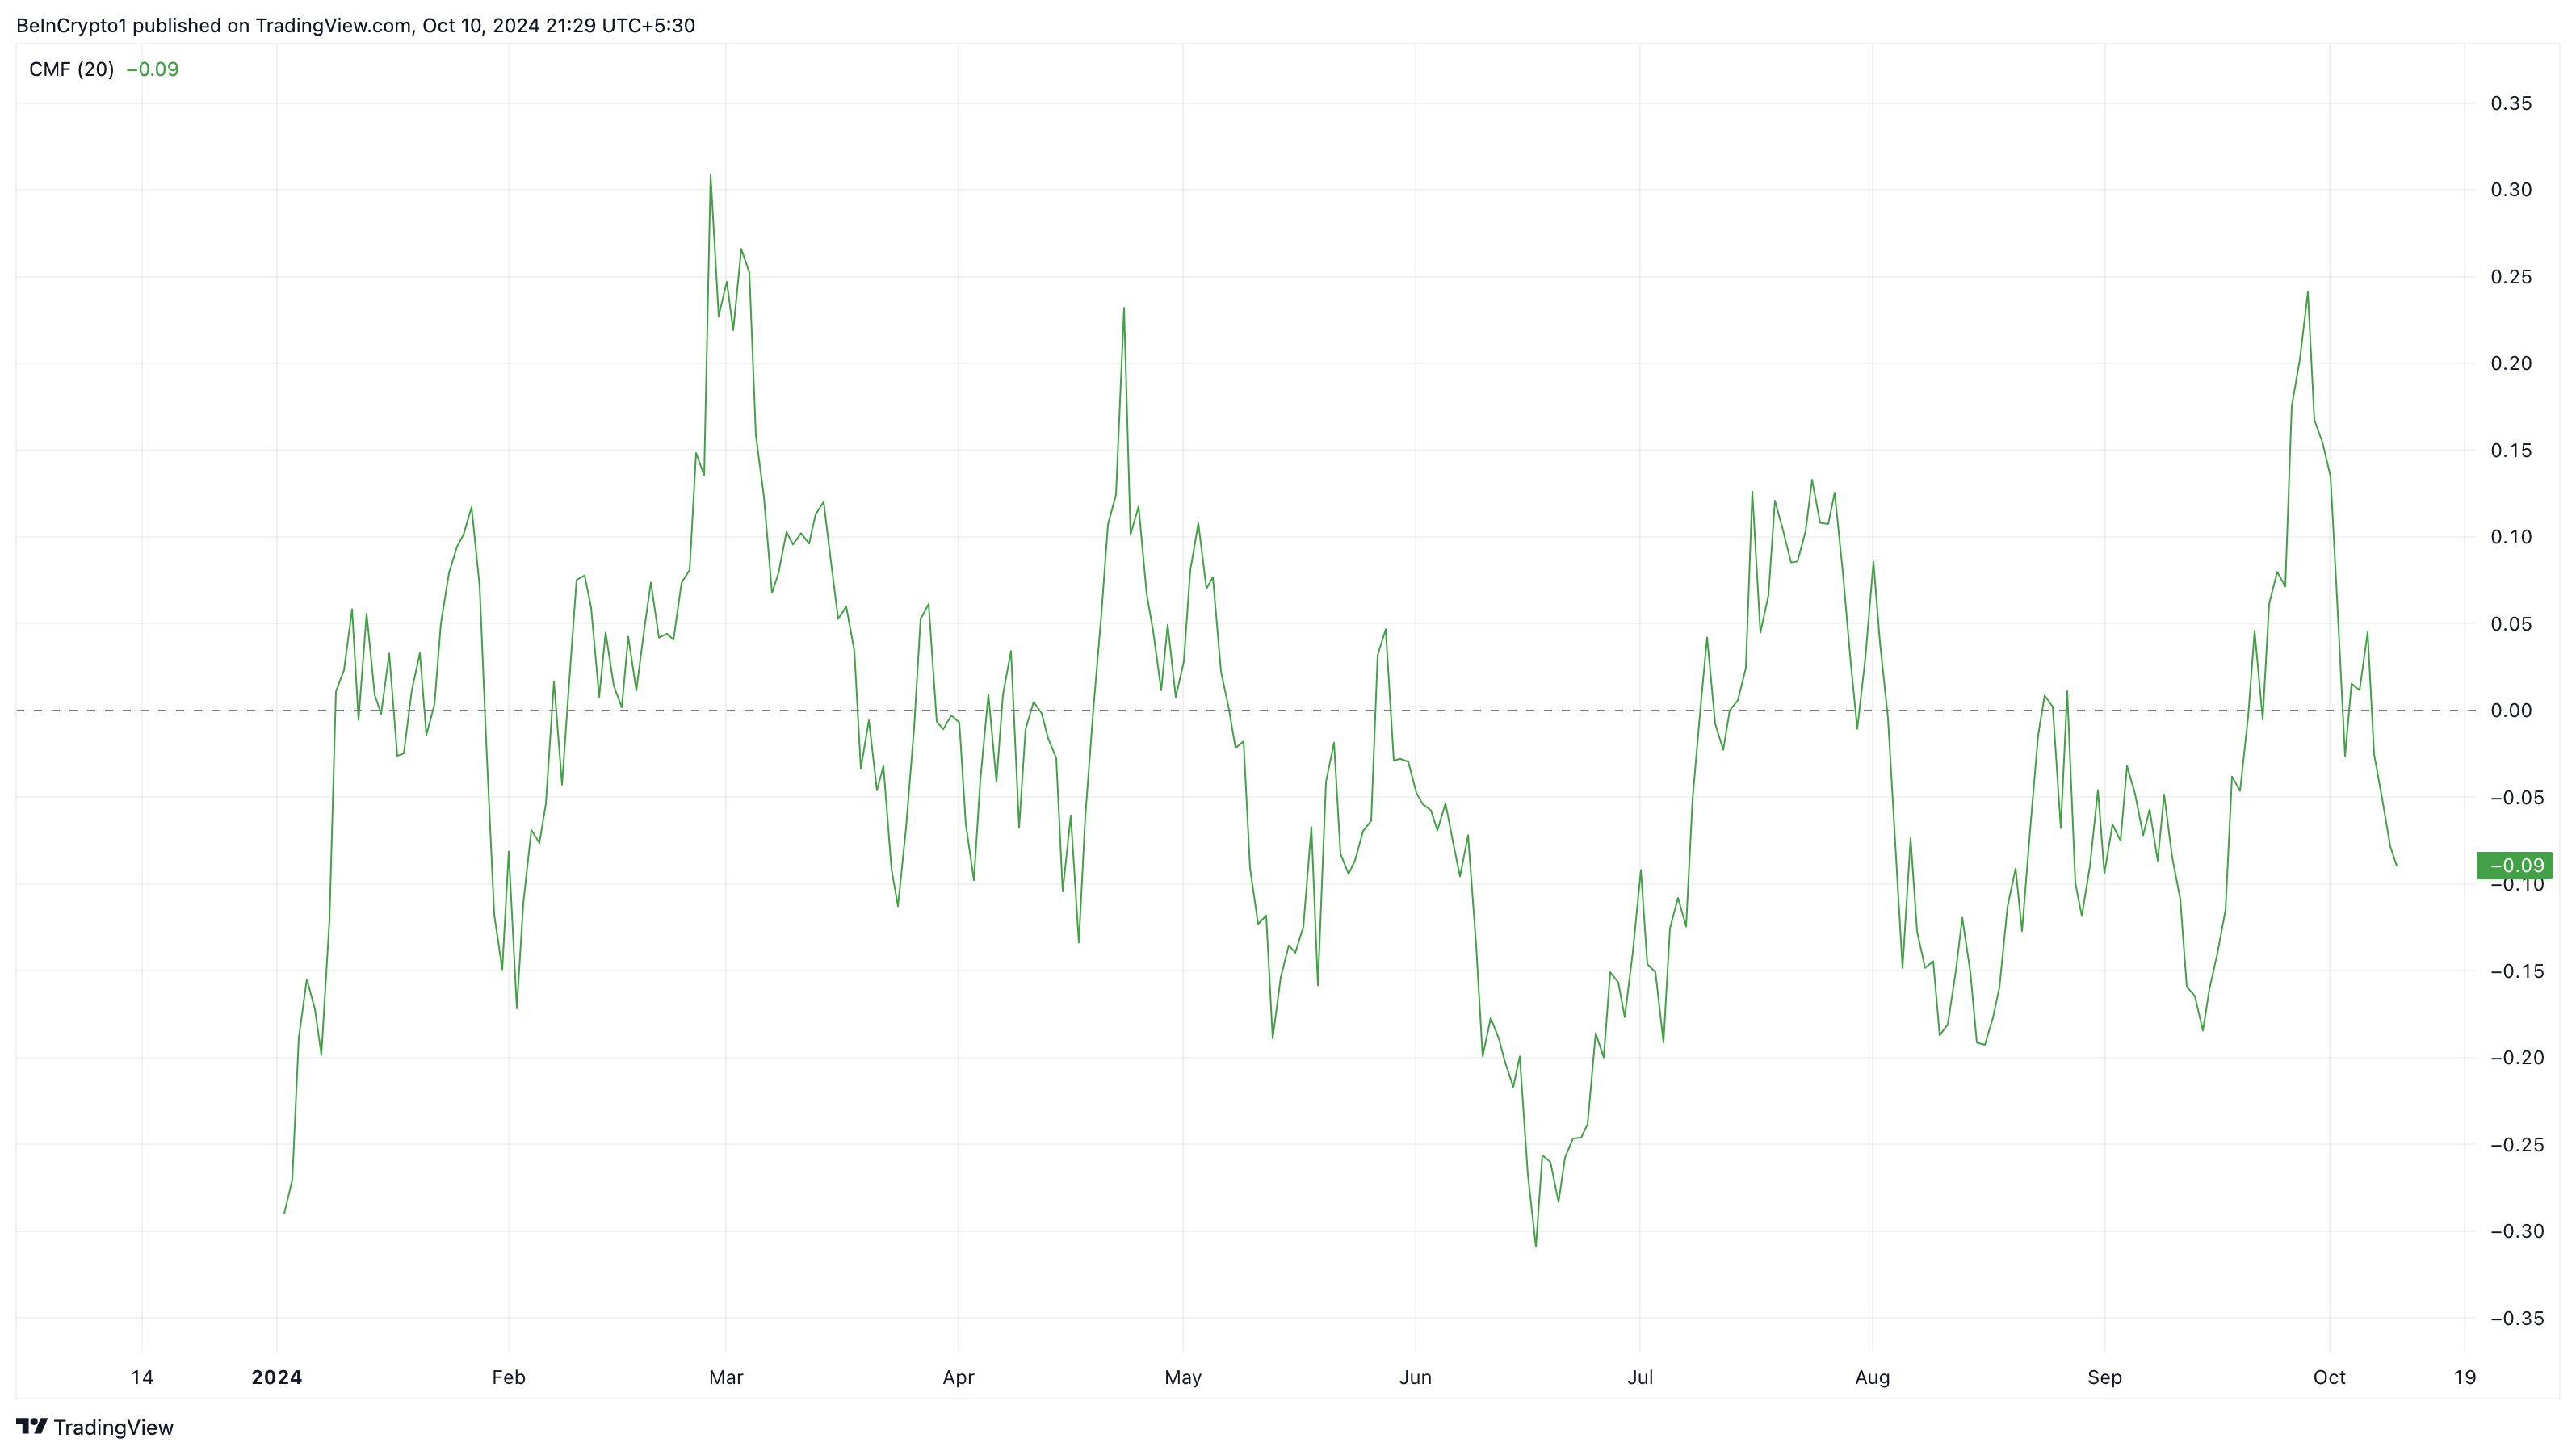
Additionally, the Chaikin Money Flow (CMF) on BONK’s daily chart has dropped below the zero signal line, now at -0.10. The CMF measures accumulation versus distribution, with an increase signaling higher buying pressure and potential price growth, while a decrease suggests the opposite.
For BONK, the CMF’s current reading indicates that market participants are distributing the coin, possibly taking profits from recent price gains. If this trend continues, BONK’s price could experience further declines.
BONK Price Prediction: Still Bearish
Currently, BONK is on the verge of falling below $0.000019. The decreasing trading volume around the token indicates a lack of strong buying pressure, making it difficult for the meme coin to gain momentum.
If this trend continues, BONK’s price could drop to $0.000017, a historically weak support level. In April, when BONK hit $0.000017, the downtrend intensified, driving the price down to $0.000014. A similar scenario could unfold, with BONK potentially dropping by another 20% to $0.000014.
Currently, BONK’s price is on the brink of falling below $0.000019. The chart below shows that the trading volume around the token has been decreasing, suggesting that it could be challenging for the meme coin to experience solid buying pressure.
If this remains the same, the meme coin’s price might drop to $0.000017. But that level has historically proven to be a weak zone for BONK. For instance, in April, when Bonk hit $0.000017, the downtrend intensified as the price hit $0.000014.
Read more: 11 Top Solana Meme Coins to Watch in October 2024
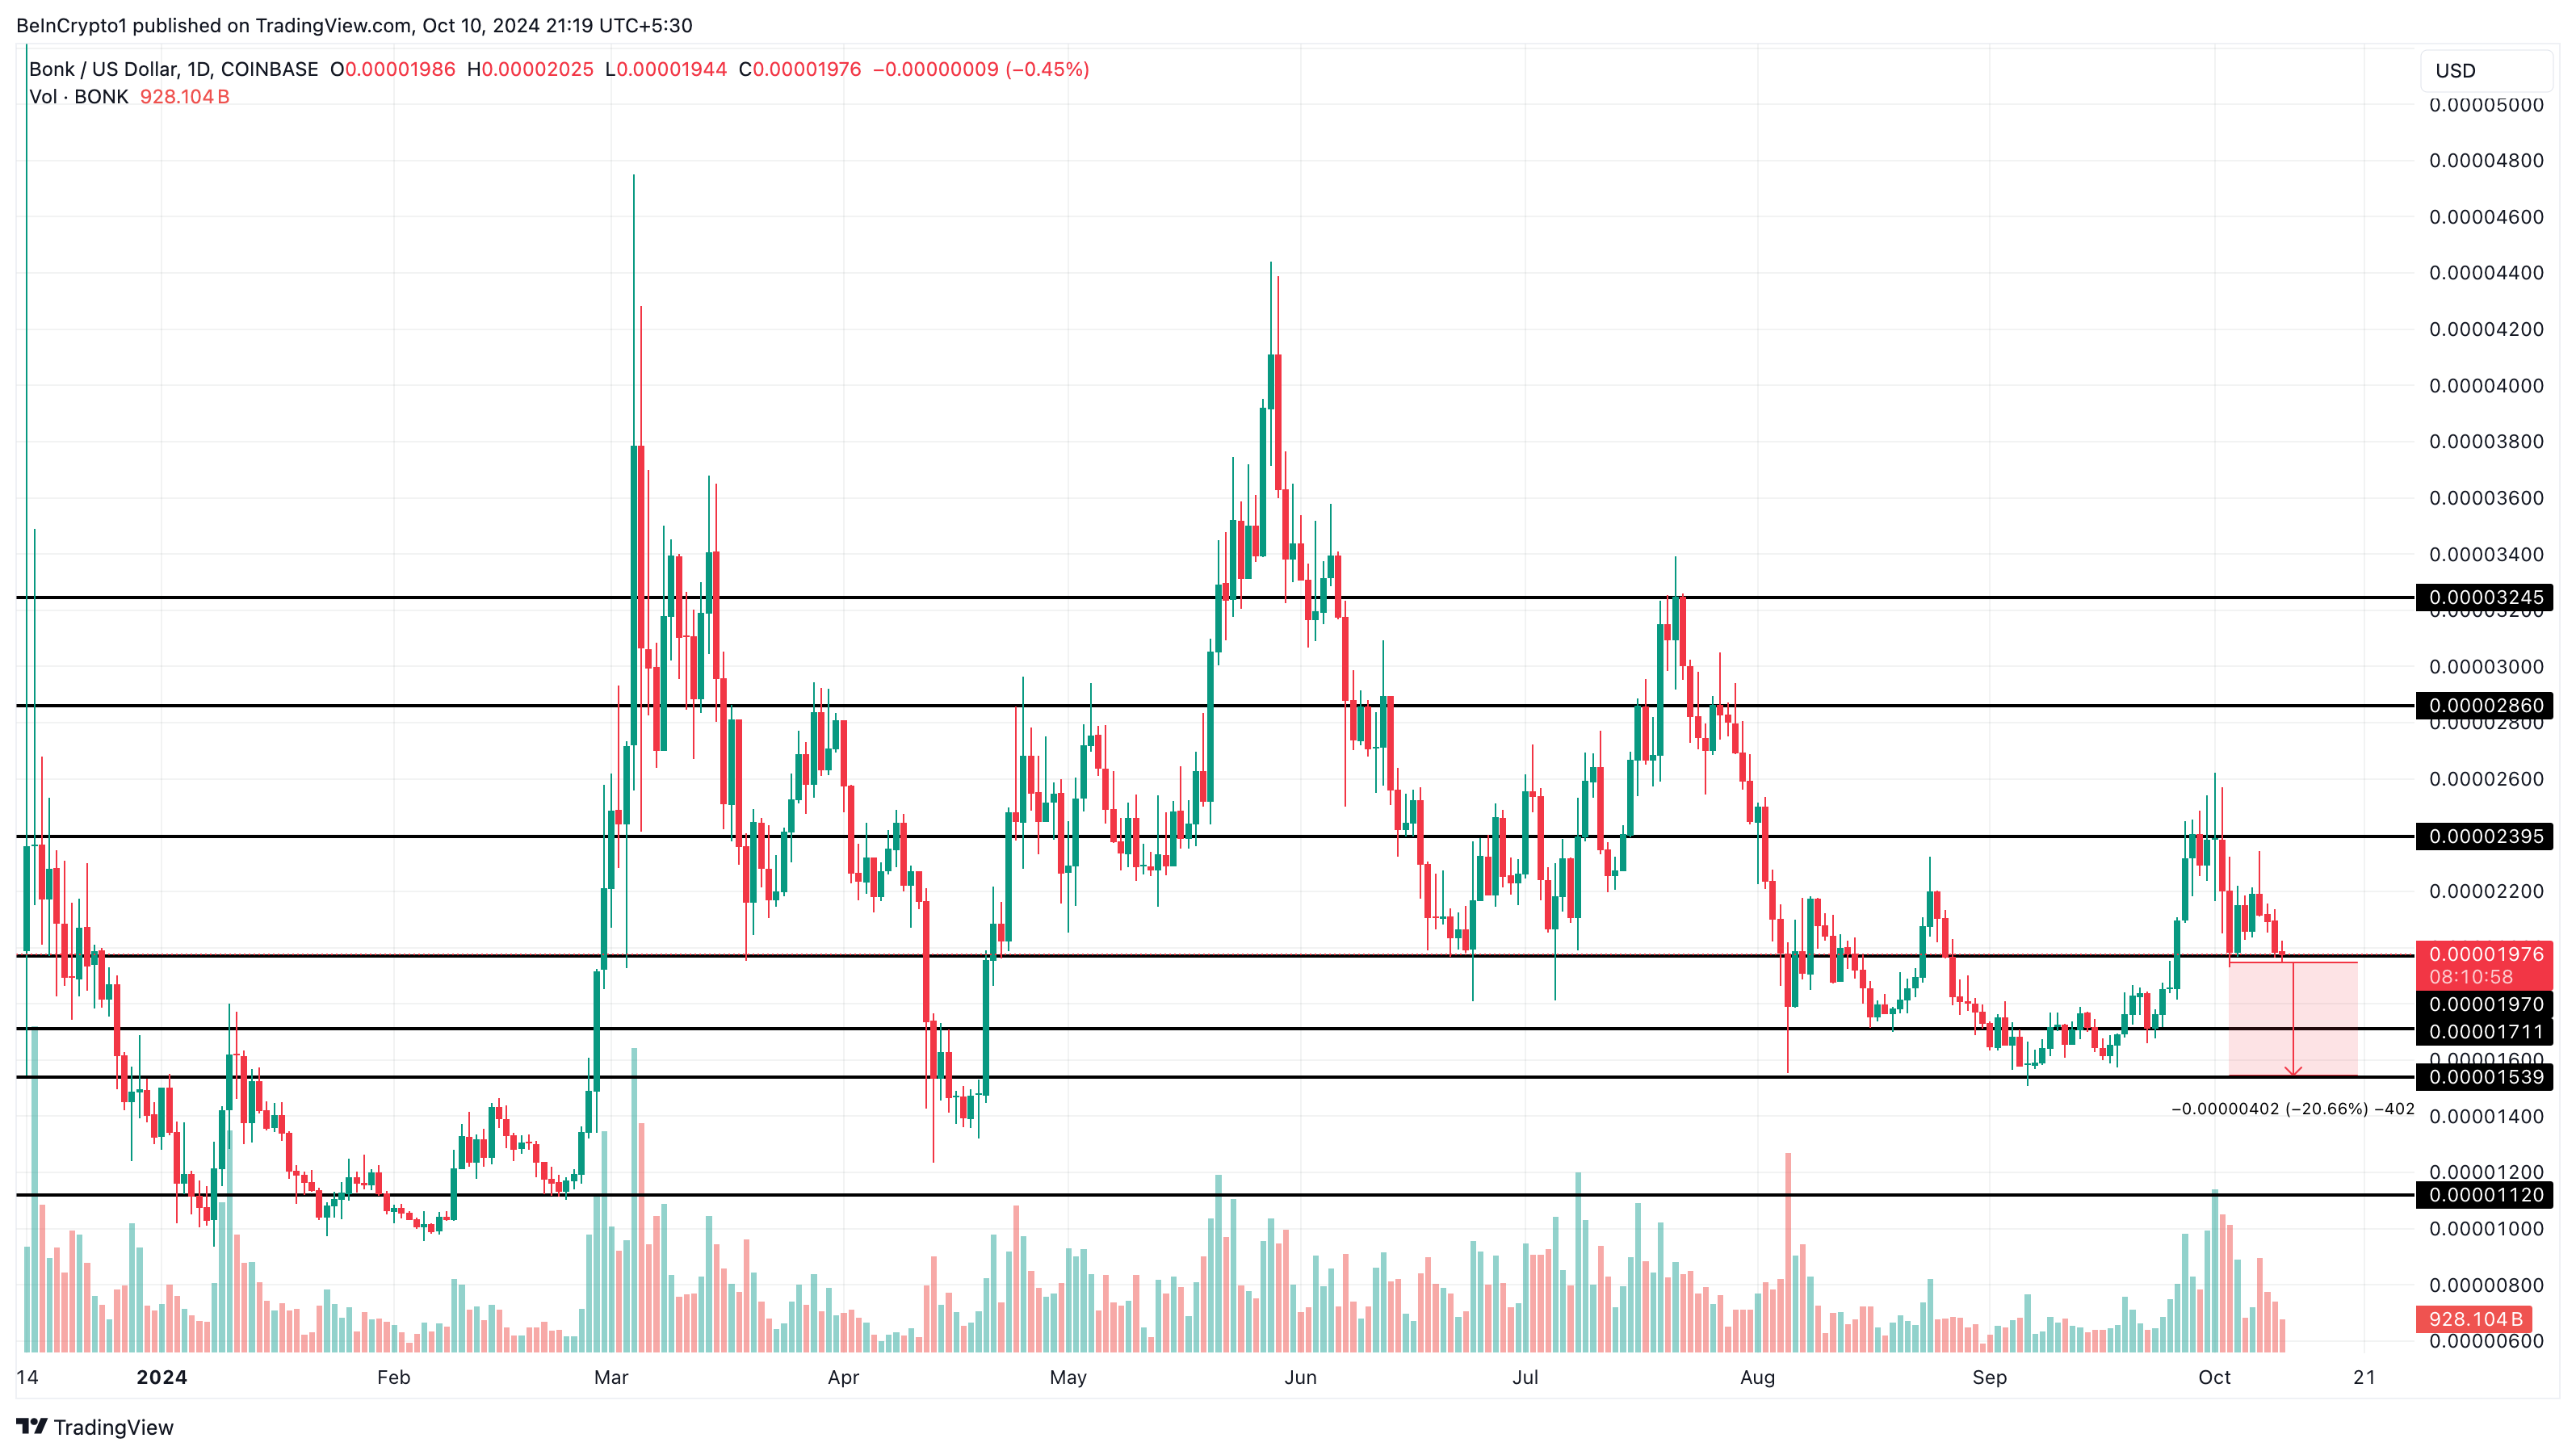
However, if meme coin prices rise again, this bearish prediction could be invalidated. In that case, BONK’s price might climb to $0.000024 and potentially reach $0.000032 before the end of the year.
Disclaimer
In line with the Trust Project guidelines, this price analysis article is for informational purposes only and should not be considered financial or investment advice. BeInCrypto is committed to accurate, unbiased reporting, but market conditions are subject to change without notice. Always conduct your own research and consult with a professional before making any financial decisions. Please note that our Terms and Conditions, Privacy Policy, and Disclaimers have been updated.


Bybit has unveiled a $140 million bounty program as part of its efforts to trace and potentially recover $1.4 billion in stolen funds.
This initiative comes alongside the recent recovery of over $43 million worth of cmETH and USDT linked to the incident.
Bybit Engages Ethical Hackers in $140 Million Bounty Initiative
On February 22, Bybit announced a bounty program aimed at engaging ethical hackers and cybersecurity specialists to help recover the stolen assets.
Bybit has pledged up to 10% of the recovered funds as a reward. If the full amount is retrieved, contributors could receive as much as $140 million.
The exchange will distribute the bounty among individuals who provide valuable intelligence or play a direct role in asset recovery.
Bybit CEO Ben Zhou highlighted the strong response from the crypto community. He noted that industry experts and organizations have already stepped forward to assist.
He emphasized the importance of collaboration in countering cyber threats and reaffirmed Bybit’s commitment to strengthening its security infrastructure.
“We want to officially reward our community who lent us their expertise, experience and support through the Recovery Bounty Program, and our efforts to make this difficult lesson a valuable one does not stop here. Bybit is determined to rise above the setback and fundamentally transform our security infrastructure, improve liquidity, and be a steadfast partner to our friends in the crypto community,” he added.
Over $43 Million in Stolen Funds Recovered
Alongside the bounty announcement, efforts to reclaim lost assets have already yielded results. More than $43 million worth of digital assets has been secured, with key industry players stepping in to prevent further losses.
Mudit Gupta, Chief Information Security Officer at Polygon, confirmed the recovery of 15,000 Mantle Restaked Ethereum (cmETH), worth approximately $43 million. He stated that the retrieval was made possible through a collaboration with the SEAL and Mantle teams.
Gupta explained that they identified a security gap within the protocol, which enabled them to recover the assets.
“I saw the recovery possibility soon after the hack and SEAL connected me with Mantle/mETH team who made it happen. Huge shoutout to SEAL, Mantle, and mETH teams for their quick action,” Gupta stated.
In a separate statement, the Mantle team confirmed that it blocked the exploiter’s address using the protocol’s eight-hour withdrawal delay. This measure prevented further unauthorized transactions and secured the stolen funds.
Additionally, stablecoin issuer Tether froze $181,000 in USDT linked to the hack. While the amount is relatively small, Tether CEO Paolo Ardoino stressed the significance of industry cooperation in limiting financial losses.
“We just froze 181,000 USDt connected to the ByBit hack. Might not be much but it’s honest work. We keep monitoring,” Ardoino said.
Disclaimer
In adherence to the Trust Project guidelines, BeInCrypto is committed to unbiased, transparent reporting. This news article aims to provide accurate, timely information. However, readers are advised to verify facts independently and consult with a professional before making any decisions based on this content. Please note that our Terms and Conditions, Privacy Policy, and Disclaimers have been updated.
Pi Network launched its mainnet with one of the biggest airdrops in crypto history. It was one of the most highly anticipated crypto launches in history, but many have criticized the project as being a pyramid scheme or even a scam.
However, few are aware of the internal leadership turmoil that nearly derailed the project before its launch in 2020.
Pi’s Internal Conflict and Legal Battle
In 2020, Vincent McPhilip, one of Pi Network’s co-founders, took legal action against fellow founders Nicolas Kokkalis and Chengdiao Fan. He claimed they removed him from the company unfairly and mishandled financial resources.
McPhilip alleged that Kokkalis and Fan, a married couple, brought personal conflicts into the workplace, creating a toxic environment.
He described incidents involving verbal altercations and physical confrontations that made it difficult for him to lead effectively. McPhilip further stated that he spent more time addressing their disputes than focusing on business operations.
“Kokkalis and Fan had marital issues which manifested themselves not only in workplace shouting and screaming but acts of physical aggression towards each other witnessed by plaintiff,” the lawsuit stated.
Tensions escalated in April 2020 when McPhilip stepped away temporarily to address internal issues. However, Kokkalis and Fan viewed his absence as abandonment and revoked his access to company assets, including servers and financial accounts.
McPhilip also accused them of trying to dilute his ownership of the project. He claimed they planned to issue new shares at an undervalued price of $0.00005 per share, reducing his stake.
This was particularly significant given that Pi Network had previously secured substantial funding through Simple Agreement for Future Equity (SAFE) investments, raising capital at a $20 million valuation in 2019 and 2020.
Kokkalis and Fan countered these claims, arguing that McPhilip was dismissed due to violations of the company’s policies.
The dispute was ultimately settled in July 2023, but the resolution details remain undisclosed. Since then, McPhilip has maintained his interest in the crypto sector by founding a new project called Knomad and consistently interacting with the sector on X.
Pi Network Rejects Scam Allegations
Despite its growing user base, Pi Network has faced accusations of fraudulent activities.
On February 22, the team addressed these claims, clarifying that scammers unaffiliated with the project had been falsely using its name.
According to the team, a police report in China warned of individuals impersonating Pi Network representatives. The team stated that they had no involvement in the situation and had not been contacted by authorities regarding the matter.
“Pi Network has not been contacted by any police department in China regarding this incident. Pi strongly condemns any alleged activities by any bad actor,” the team stated.
Furthermore, Pi Network dismissed claims of links to cryptocurrency exchange ByBit or its CEO, Ben Zhou. They stated that no official communication had occurred and that Pi Network had never commented on ByBit or its leadership.
The team also distanced itself from a social media account that had made negative remarks about Zhou, reaffirming that the project had no affiliation with the statements.
“Neither Pi Network, nor anyone affiliated with Pi Network, has ever commented about ByBit or Mr. Zhou, whether on social media or otherwise. To that end, other than the comments mentioned in this post, Pi Network – despite the comments made about Pi – still has no comment and retains its position to make no comment regarding ByBit, Mr. Zhou, or their business,” the project concluded.
Despite these challenges, Pi Network’s token has experienced a sharp increase in value. PI experienced an 86% surge within 24 hours, bringing the token’s price to $1.50 as of press time.
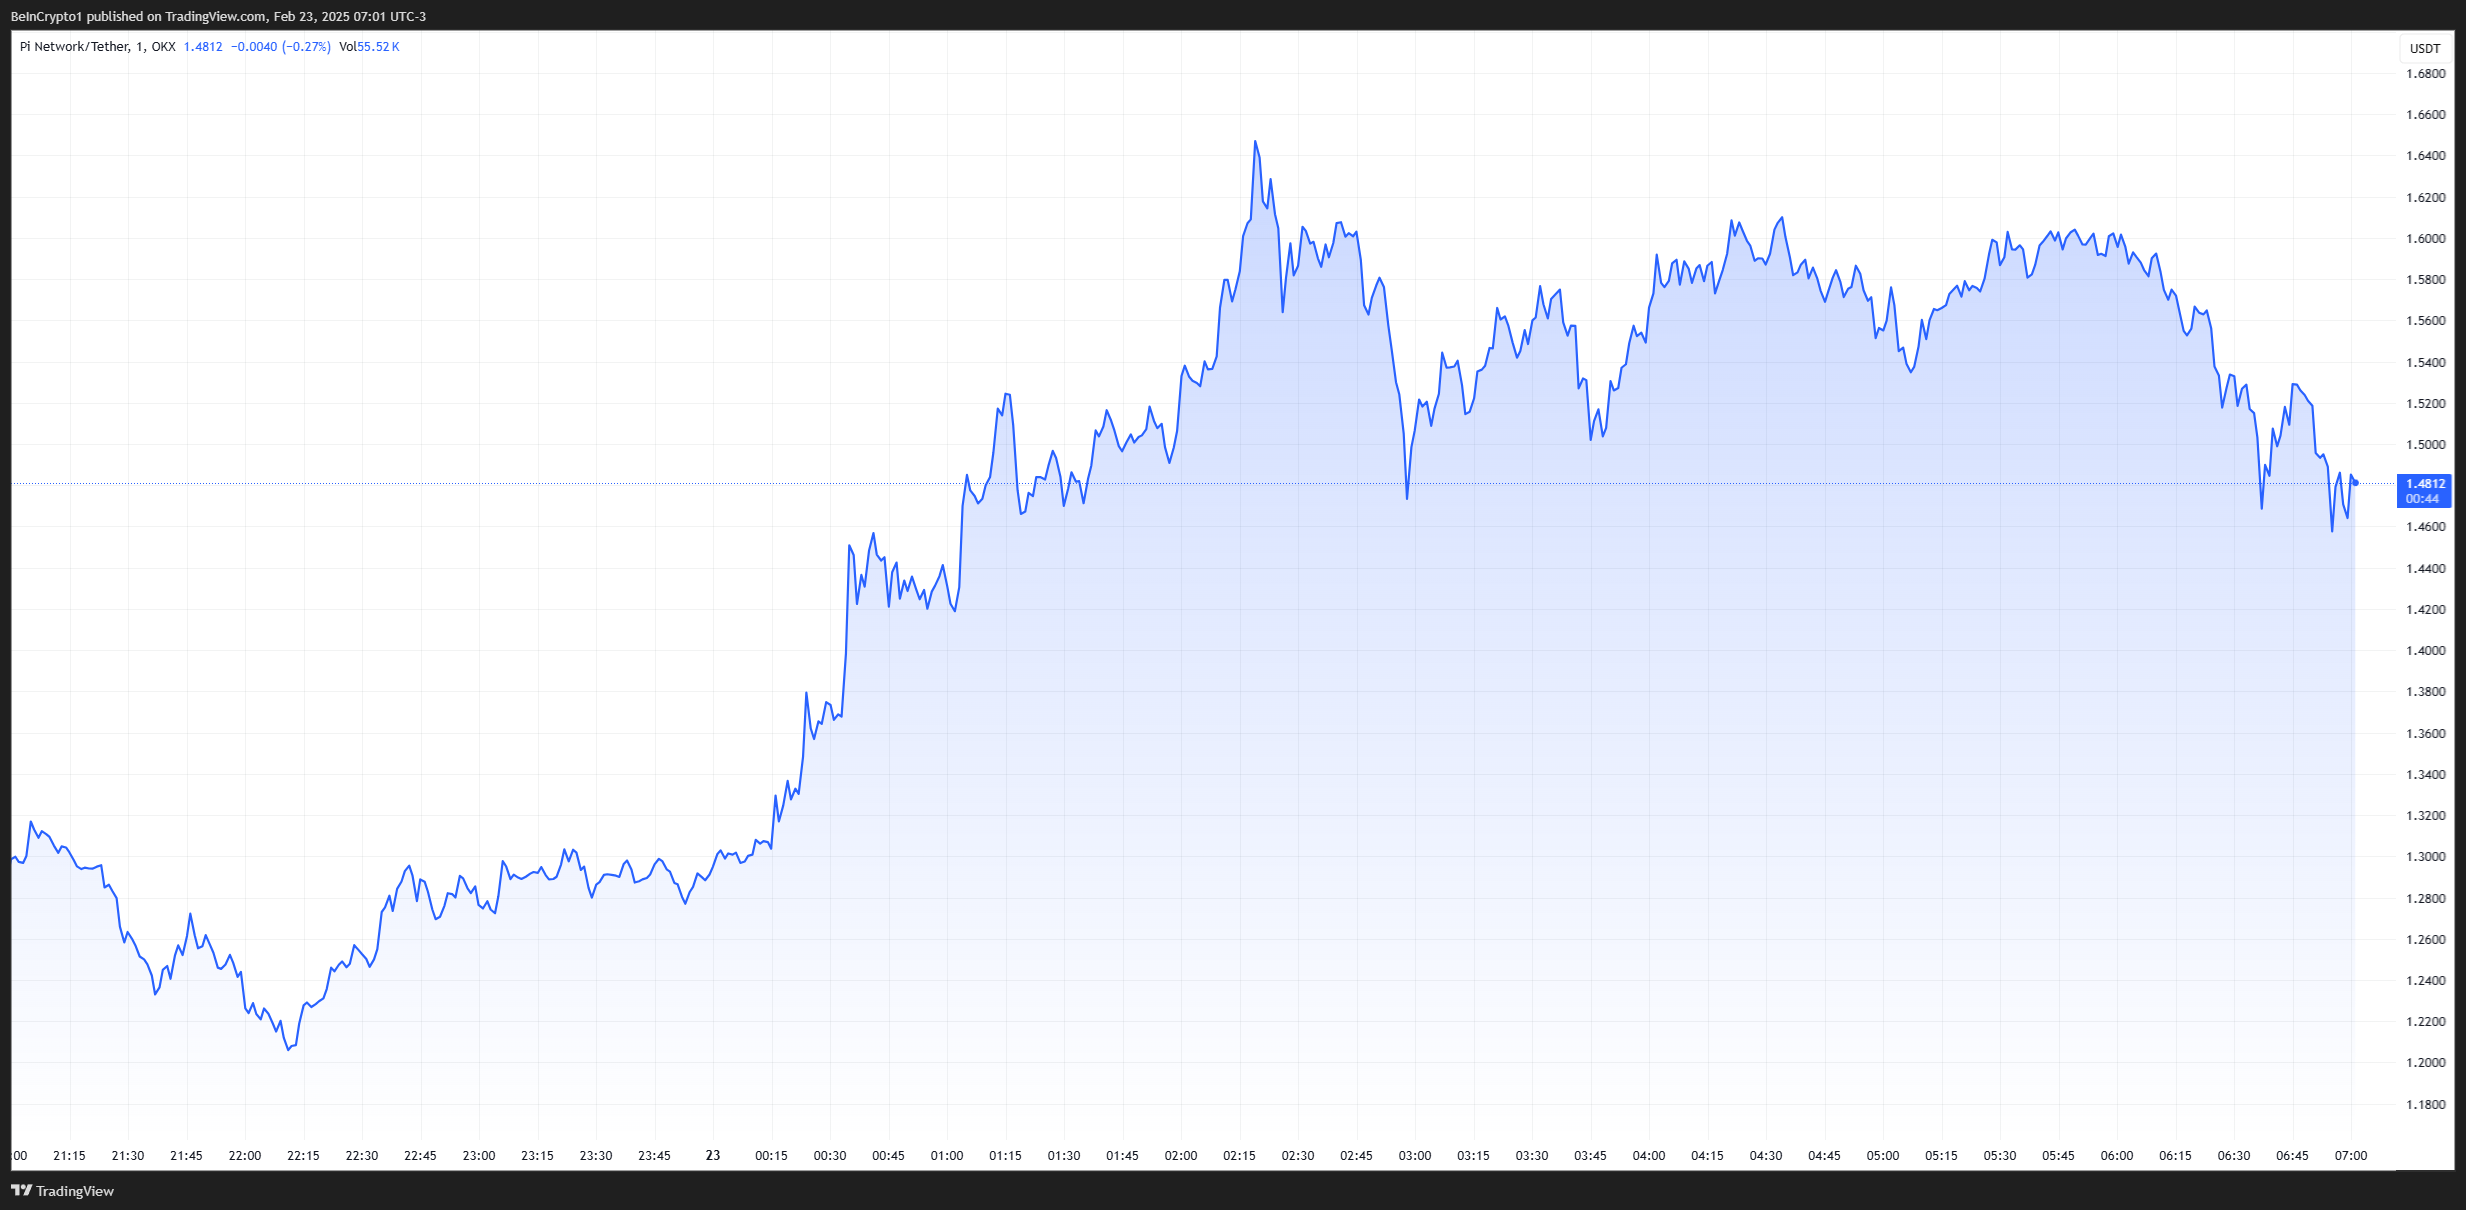
This marks a strong recovery from its earlier drop below $1 following the mainnet launch. Pi’s fully diluted valuation now stands at $158 billion, with a market capitalization of around $10 billion.
Disclaimer
In adherence to the Trust Project guidelines, BeInCrypto is committed to unbiased, transparent reporting. This news article aims to provide accurate, timely information. However, readers are advised to verify facts independently and consult with a professional before making any decisions based on this content. Please note that our Terms and Conditions, Privacy Policy, and Disclaimers have been updated.


- Solana will likely remain under pressure in the near term despite the steady fundamentals.
- iDEGEN is ending its presale with the same hype that has carried it through the presale as investors fear missing out.
- Even with the likely approval of a Litecoin ETF, the bulls lack enough momentum to fuel a breakout
Crypto bulls remain in control amid optimism of a 2025 bull run. However, with a neutral market sentiment, most crypto majors have been range-bound in the just concluded week. Even so, meme coins continue to attract savvy investors looking for cheaper alternatives with robust growth potential.
Since the launch of its presale on 26th November 2024, iDEGEN has taken its enthusiasts on a wild ride; raking in hefty returns for its early adopters along the way. With just a few days left before its listing on decentralized exchanges (DEXs), market participants forecast an explosive entry. As such, more investors are rushing to amass $IDGN tokens before time runs out.
Solana price stuck between the battle of optimism vs. technicals
Solana price has continued to find support in the optimism of a bull run in 2025. Besides, the surge in altcoin ETFS’ filings is a key tailwind for the crypto major.
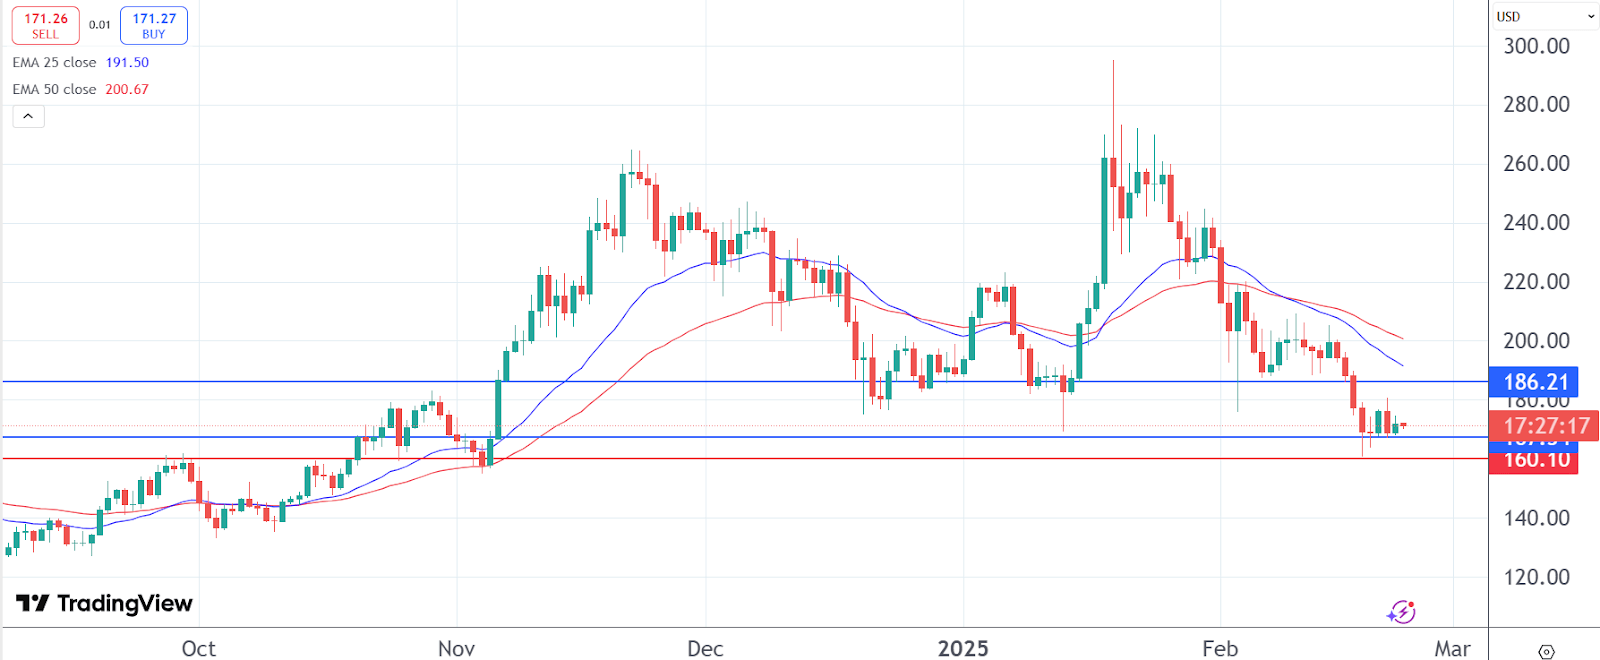
Even so, buyers are still on the sidelines as the market sentiment remains neutral. With this low bullish momentum, Solana price failed to sustain a rebound past $180 earlier in the week.
A look at its daily chart shows the continuation of the death cross pattern as the short-term 25-day EMA remains below the 50-day MA. At its current level, the bulls are keen on defending the support at $$167.68. Below that level, the bears will be looking to pull it further to $160.10. On the upper side, $186.21 is still the resistance level to beat if the crypto is to stage a successful breakout.
iDEGEN’s timing, community, and positioning sets it for unmatched heights
iDEGEN’s virality and success is proof that the market is ripe for projects that defy the norms. Indeed, the absence of guardrails is one of the factors that have catapulted the AI crypto to its current levels.
Crypto degens have been responsible for raising the AI agent, steadily feeding it with uncensored content. This community has become so committed and influential that not even the bans on X could stop the movement In fact, it only fueled the FOMO.
As a result, iDEGEN has raised over $24 million with more than 1.8 million $IDGN tokens already sold. At its current price of $0.0345, the early adopters are sitting on returns of over 31,000% even before it hits the public shelves.
Based on its infrastructure, timing, and virality, iDEGEN has robust growth potential. Whether or not the heightened speculations of a Binance listing will materialize, the crypto is set for great heights on the back of a crypto-friendly environment, an engaged community, and the positioning of AI in the crypto space.
Besides, its rivals like Hamster Kombat, AI16z, and Fartcoin, which were launched in October 2024, have since seen their market cap exceed $100 million. In fact, AI16z is currently valued at over $400,000. With this immense validation of AI cryptos, iDEGEN’s value will likely surge by at least 10X in coming months. Read more on how to buy the iDEGEN token here.
Optimism over a Litecoin ETF not enough to yield a breakout
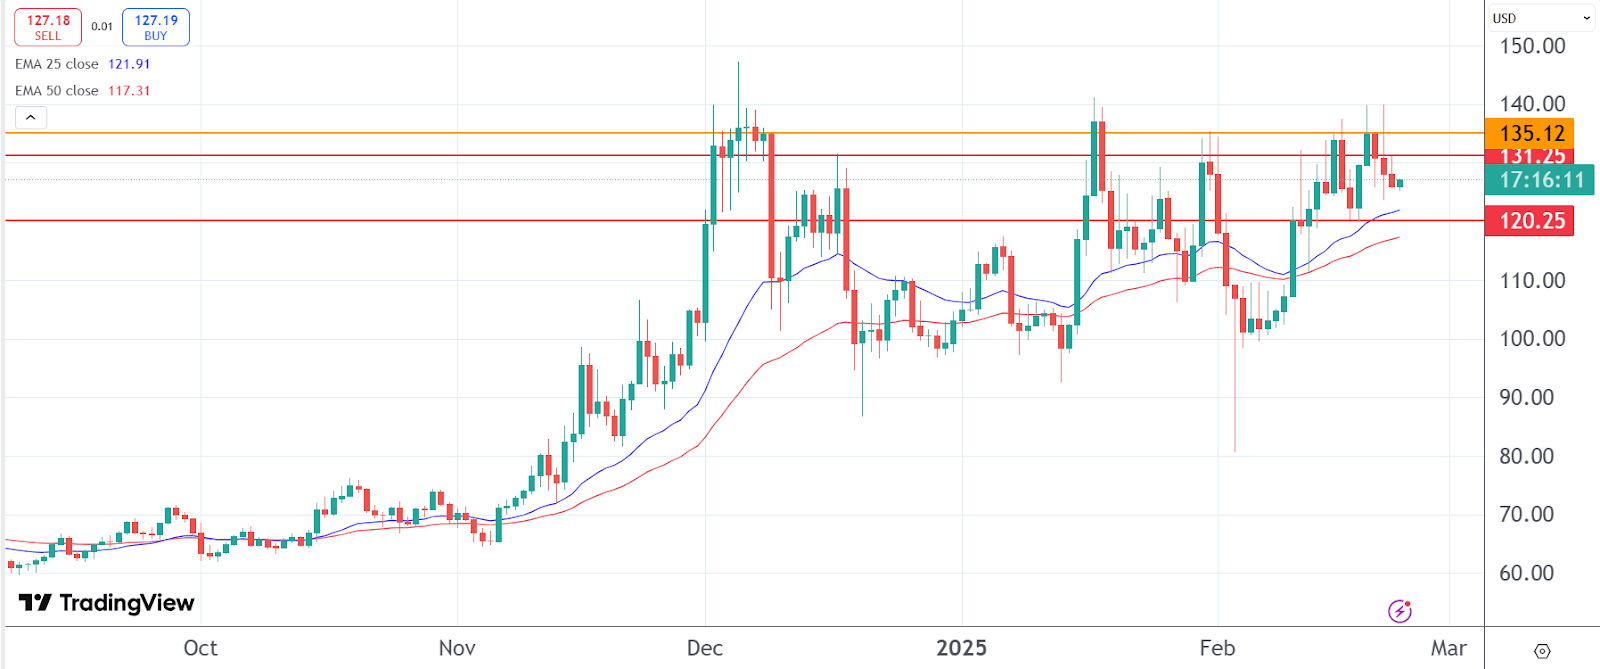
SEC is already reviewing Canary Capital’s proposal of a Litecoin ETF; an aspect that is offering support to the altcoin. On its daily chart, it continues to trade above the 25 and 50-day EMAs; pointing to further gains in the near term.
However, with buyers on the sidelines, Litecoin price may remain range-bound for a while longer. More specifically, the range between $120.25 and $131.25 is worth watching. Heightened optimism may further boost the altcoin to find resistance at $135.12.

Bybit Announces $140 Million Bounty, $43 Million Recovered

Pi Network Faced Legal Battles Before Mainnet Launch

Trump Is Taking Bitcoin ‘Serious’, Says BPI Director

Bitcoin Realized Volatility Near Historic Lows — What This Means For Price
Will Dogecoin Price Soar 200% As DOGE ETF Approval Odds Hit 75%?

iDEGEN finishes the presale race with hype as investors fear missing out

2.52 Million Altcoins Are Ruining Crypto’s Future

Animoca Brands Valuation Tanks 75% In Two Years, Here’s Why

Crypto exchange BingX hacked for $43 million

Are The Big Players Losing Interest?

Hong Kong’s Securities Association Tips Authorities On Crypto Self-Regulation

Coinbase cbBTC Set to go Live on Solana
2.52 Million Altcoins Are Ruining Crypto’s Future
Animoca Brands Valuation Tanks 75% In Two Years, Here’s Why
Crypto exchange BingX hacked for $43 million
Are The Big Players Losing Interest?
Hong Kong’s Securities Association Tips Authorities On Crypto Self-Regulation
Coinbase cbBTC Set to go Live on Solana
-
 Altcoin23 hours ago
Litecoin Whales On Buying Spree Sack 930K Coins Amid LTC ETF Buzz, What’s Next?
-

 Market22 hours ago
Kanye West is Launching His Token Despite Past Criticism
-
 Market20 hours ago
Bitcoin Could Rebound to $100,000 Soon Despite Bearish Pressure
-

 Market19 hours ago
Berachain (BERA) Falls 15% After Recent Rally Surge
-
 Regulation19 hours ago
US SEC Faces Backlash as Bybit Hack Highlights Lack of Oversight
-

 Market17 hours ago
3 Meme Coins to Watch For The Last Week of February 2025
-

 Altcoin17 hours ago
Analyst Reveals Two XRP Price Levels To Watch, Is $250 On?
-

 Market21 hours ago
Myanmar Junta Leader’s Social Media Hijacaked for Crypto Fraud