
Market
Cardano gears up for a $5 run, Polygon to double, Rexas Finance (RXS) could jump from under $0.12 to $12

The crypto market is bracing itself for significant price movements as Cardano (ADA), Polygon (POL), and Rexas Finance (RXS) prepare for potential surges. Cardano, showing promising signals, could be gearing up for a massive breakout. Polygon is witnessing network growth post-upgrade, and Rexas Finance is revolutionizing real-world asset tokenization, with expectations of a monumental price jump.
Cardano (ADA) eyes a $5 surge
Cardano’s technical indicators point towards a potential rally similar to its previous explosive rise. Between December 2020 and May 2021, ADA surged over 1,000%, from $0.15 to $1.77. A similar setup, with the 50-day Exponential Moving Average (EMA) crossing the 100-day EMA, signals that ADA might be poised for a similar breakout. If history repeats itself, Cardano could climb to $5, representing a substantial opportunity for investors.
Could Polygon (POL) double in value?
Polygon has recently undergone a transformation, rebranding from MATIC to POL, with all tokens smoothly converting in a 1:1 ratio. This transition has led to Polygon leading network growth, boasting a 1,019% rise in new addresses. With a transaction count of 2.61 million and a 24-hour trading volume of $80 million, Polygon looks set for continued growth. As its ecosystem expands, POL is expected to double in value, cementing its position in the crypto market.
Rexas Finance revolutionizes real-world asset tokenization
Rexas Finance (RXS) is taking the concept of tokenization to new heights by offering a platform where investors can tokenize real-world assets (RWA), including real estate, gold, and other commodities. RXS enables users to buy fractions of these assets, making markets like real estate, historically reserved for the wealthy, accessible to all. Imagine an individual in Asia owning a percentage of a European restaurant, earning passive income from the investment without ever stepping foot in Europe. This ground-breaking approach unlocks new possibilities for investors worldwide.
Real-world asset tokenization
The global real estate market is valued at trillions of dollars, and Rexas Finance is bridging the gap between this traditional market and blockchain technology. By tokenizing real estate, RXS allows individuals to purchase fractional ownership of properties, democratizing real estate investments.
Additionally, Rexas Finance extends tokenization beyond real estate, offering access to gold and other valuable commodities. With a global commodities market valued at over $121 trillion, RXS opens up enormous investment opportunities.
Rexas Token Builder and Launchpad
Rexas Finance provides tools to simplify the tokenization process. The Rexas Token Builder allows users to create digital tokens representing a share of any real-world asset. This process enhances liquidity and makes it easier for investors to enter markets that were once difficult to access.
The Rexas Launchpad also offers a platform for new projects to raise funds through token sales, further fostering innovation within the crypto market.
Rexas Finance presale success
Rexas Finance has seen tremendous success in its presale stages. Stage 1 sold out quickly, raising $450,000, and Stage 2 followed suit, with the total raised reaching $1,250,000.
Now in Stage 3, priced at $0.05 per token, RXS has raised over $1,771,702. Investors purchasing at this stage could see a 4x return upon launch, positioning Rexas Finance as a standout opportunity in the crypto market.
Rexas Finance $1 Million Giveaway
Rexas Finance is currently hosting a $1,000,000 giveaway, where 20 winners will each receive $50,000 USDT. To participate, users must submit their ERC20 wallet address and complete various quests to maximize their chances. For each friend referred, participants earn 15 additional entries, increasing their odds of winning. This giveaway not only highlights Rexas Finance’s commitment to its community but also adds an exciting incentive for investors.
Conclusion
As the crypto market prepares for another wave of growth, Cardano, Polygon, and Rexas Finance stand out as projects with immense potential. Cardano could see a price surge to $5, Polygon could be set to double in value, and Rexas Finance, with its innovative tokenization platform, looks to be on the path to disrupting the market. With RXS poised to leap from under $0.12 to $12, investors are eagerly anticipating what’s next for this game-changing project.
For more information about Rexas Finance (RXS) visit the links below:
Website: https://rexas.com
Win $1 Million Giveaway: https://bit.ly/Rexas1M
Whitepaper: https://rexas.com/rexas-whitepaper.pdf
Twitter/X: https://x.com/rexasfinance
Telegram: https://t.me/rexasfinance


Reason to trust
![]()
Strict editorial policy that focuses on accuracy, relevance, and impartiality
Created by industry experts and meticulously reviewed
The highest standards in reporting and publishing
Strict editorial policy that focuses on accuracy, relevance, and impartiality
Morbi pretium leo et nisl aliquam mollis. Quisque arcu lorem, ultricies quis pellentesque nec, ullamcorper eu odio.
Bitcoin price started another decline below the $85,000 zone. BTC is now consolidating and might struggle to recover above the $83,500 zone.
- Bitcoin started a fresh decline below the $83,500 support zone.
- The price is trading below $83,200 and the 100 hourly Simple moving average.
- There is a connecting bearish trend line forming with resistance at $82,750 on the hourly chart of the BTC/USD pair (data feed from Kraken).
- The pair could start another decline if it stays below the $83,500 resistance zone.
Bitcoin Price Dips Further
Bitcoin price failed to remain above the $85,500 level. BTC started another decline and traded below the support area at $85,000. The bears gained strength for a move below the $83,500 support zone.
The price even declined below the $82,000 level. A low was formed at $81,586 and the price is now consolidating losses below the 23.6% Fib retracement level of the downward move from the $83,500 swing high to the $81,586 swing low.
Bitcoin price is now trading below $82,500 and the 100 hourly Simple moving average. On the upside, immediate resistance is near the $82,000 level. The first key resistance is near the $82,750 level. There is also a connecting bearish trend line forming with resistance at $82,750 on the hourly chart of the BTC/USD pair.

The trend line is near the 61.8% Fib retracement level of the downward move from the $83,500 swing high to the $81,586 swing low. The next key resistance could be $83,500. A close above the $83,500 resistance might send the price further higher. In the stated case, the price could rise and test the $84,200 resistance level. Any more gains might send the price toward the $84,800 level or even $85,000.
Another Decline In BTC?
If Bitcoin fails to rise above the $83,500 resistance zone, it could start a fresh decline. Immediate support on the downside is near the $81,800 level. The first major support is near the $81,500 level.
The next support is now near the $80,650 zone. Any more losses might send the price toward the $80,000 support in the near term. The main support sits at $78,500.
Technical indicators:
Hourly MACD – The MACD is now gaining pace in the bearish zone.
Hourly RSI (Relative Strength Index) – The RSI for BTC/USD is now below the 50 level.
Major Support Levels – $81,500, followed by $80,650.
Major Resistance Levels – $82,750 and $83,500.

Solana (SOL) has dropped over 6% in the past seven days and has been trading below $150 since March 6. The current trend shows clear bearish signals across multiple indicators.
From a death cross to a rising ADX and a red Ichimoku Cloud, technicals suggest growing downside pressure. With SOL nearing key support, the next few days could be critical for its price direction.
SOL Ichimoku Cloud Paints A Bearish Picture
The Ichimoku Cloud chart for Solana shows a clear bearish structure, with price action trading below both the Kijun-sen (red line) and Tenkan-sen (blue line).
The Lagging Span (green line) is also positioned below the price candles and the cloud, reinforcing the negative outlook. The Kumo ahead is red and descending, suggesting that resistance remains strong in the near term.

Solana has struggled to break above short-term resistance levels and remains stuck in a downward channel. The thin nature of the current cloud suggests weak support, making the price vulnerable to further downside if bearish momentum continues.
For a reversal, Solana would need to break above the Kijun-sen and push decisively toward the cloud, but for now, the trend remains tilted to the downside.
Solana DMI Shows Sellers Are In Control
Solana’s DMI chart shows a sharp rise in the ADX, now at 40.87—up from 19.74 just three days ago.
The ADX (Average Directional Index) measures the strength of a trend, with values above 25 indicating a strong trend and values above 40 signaling a very strong one.
This surge confirms that the current downtrend in SOL is gaining momentum.

At the same time, the +DI has dropped from 17.32 to 8.82, while the -DI has climbed to 31.09, where it has held steady for the past two days.
This setup suggests that the sellers are firmly in control, and the downtrend is strong and also strengthening.
As long as the -DI remains dominant and ADX stays elevated, SOL is likely to remain under pressure in the short term.
Can Solana Drop Below $110 Soon?
Solana recently formed a death cross, a bearish signal where short-term moving averages cross below long-term ones.
It’s now approaching key support at $120—if that level breaks, Solana price could drop to $112, and possibly below $110 for the first time since February 2024.

If bulls step in and buying pressure returns, SOL could rebound toward resistance at $136.
A breakout above that level may lead to a push toward $147, which acted as strong resistance just five days ago.
Disclaimer
In line with the Trust Project guidelines, this price analysis article is for informational purposes only and should not be considered financial or investment advice. BeInCrypto is committed to accurate, unbiased reporting, but market conditions are subject to change without notice. Always conduct your own research and consult with a professional before making any financial decisions. Please note that our Terms and Conditions, Privacy Policy, and Disclaimers have been updated.

Made in USA coins are showing mixed signals as April begins, with XRP, SUI, and Pi Network (PI) standing out. XRP leads in market cap but also posted the biggest drop among the top 10, down 10.6% this week.
SUI is the only major gainer, up 3.8%, showing some strength despite broader weakness. Meanwhile, PI has been the worst performer, plunging over 23% and staying below $1 all week.
XRP
XRP is the largest Made in USA crypto by market cap, but it’s also down 10.6% over the last 7 days—the biggest drop among the top 10. This sharp correction could present an opportunity, especially with Trump’s “Liberation Day” event coming up on April 2.
If XRP builds an uptrend, it could push to test resistance at $2.22. A breakout there may lead to moves toward $2.47 and even $2.59 if momentum grows.

If the downtrend continues, XRP could revisit support at $2.06. A breakdown below that level might drag it further down to $1.90.
With volatility rising and a possible narrative shift on the horizon, XRP could be a key coin to watch this week.
SUI
SUI is the only among major Made in USA cryptos showing gains over the past week, up 3.8%, even though it’s still down 13% over the last 30 days. This resilience sets it apart from the rest of the pack.
In the last 24 hours, trading volume has dropped 15% to $767 million. The coin’s current market cap is $7.43 billion.
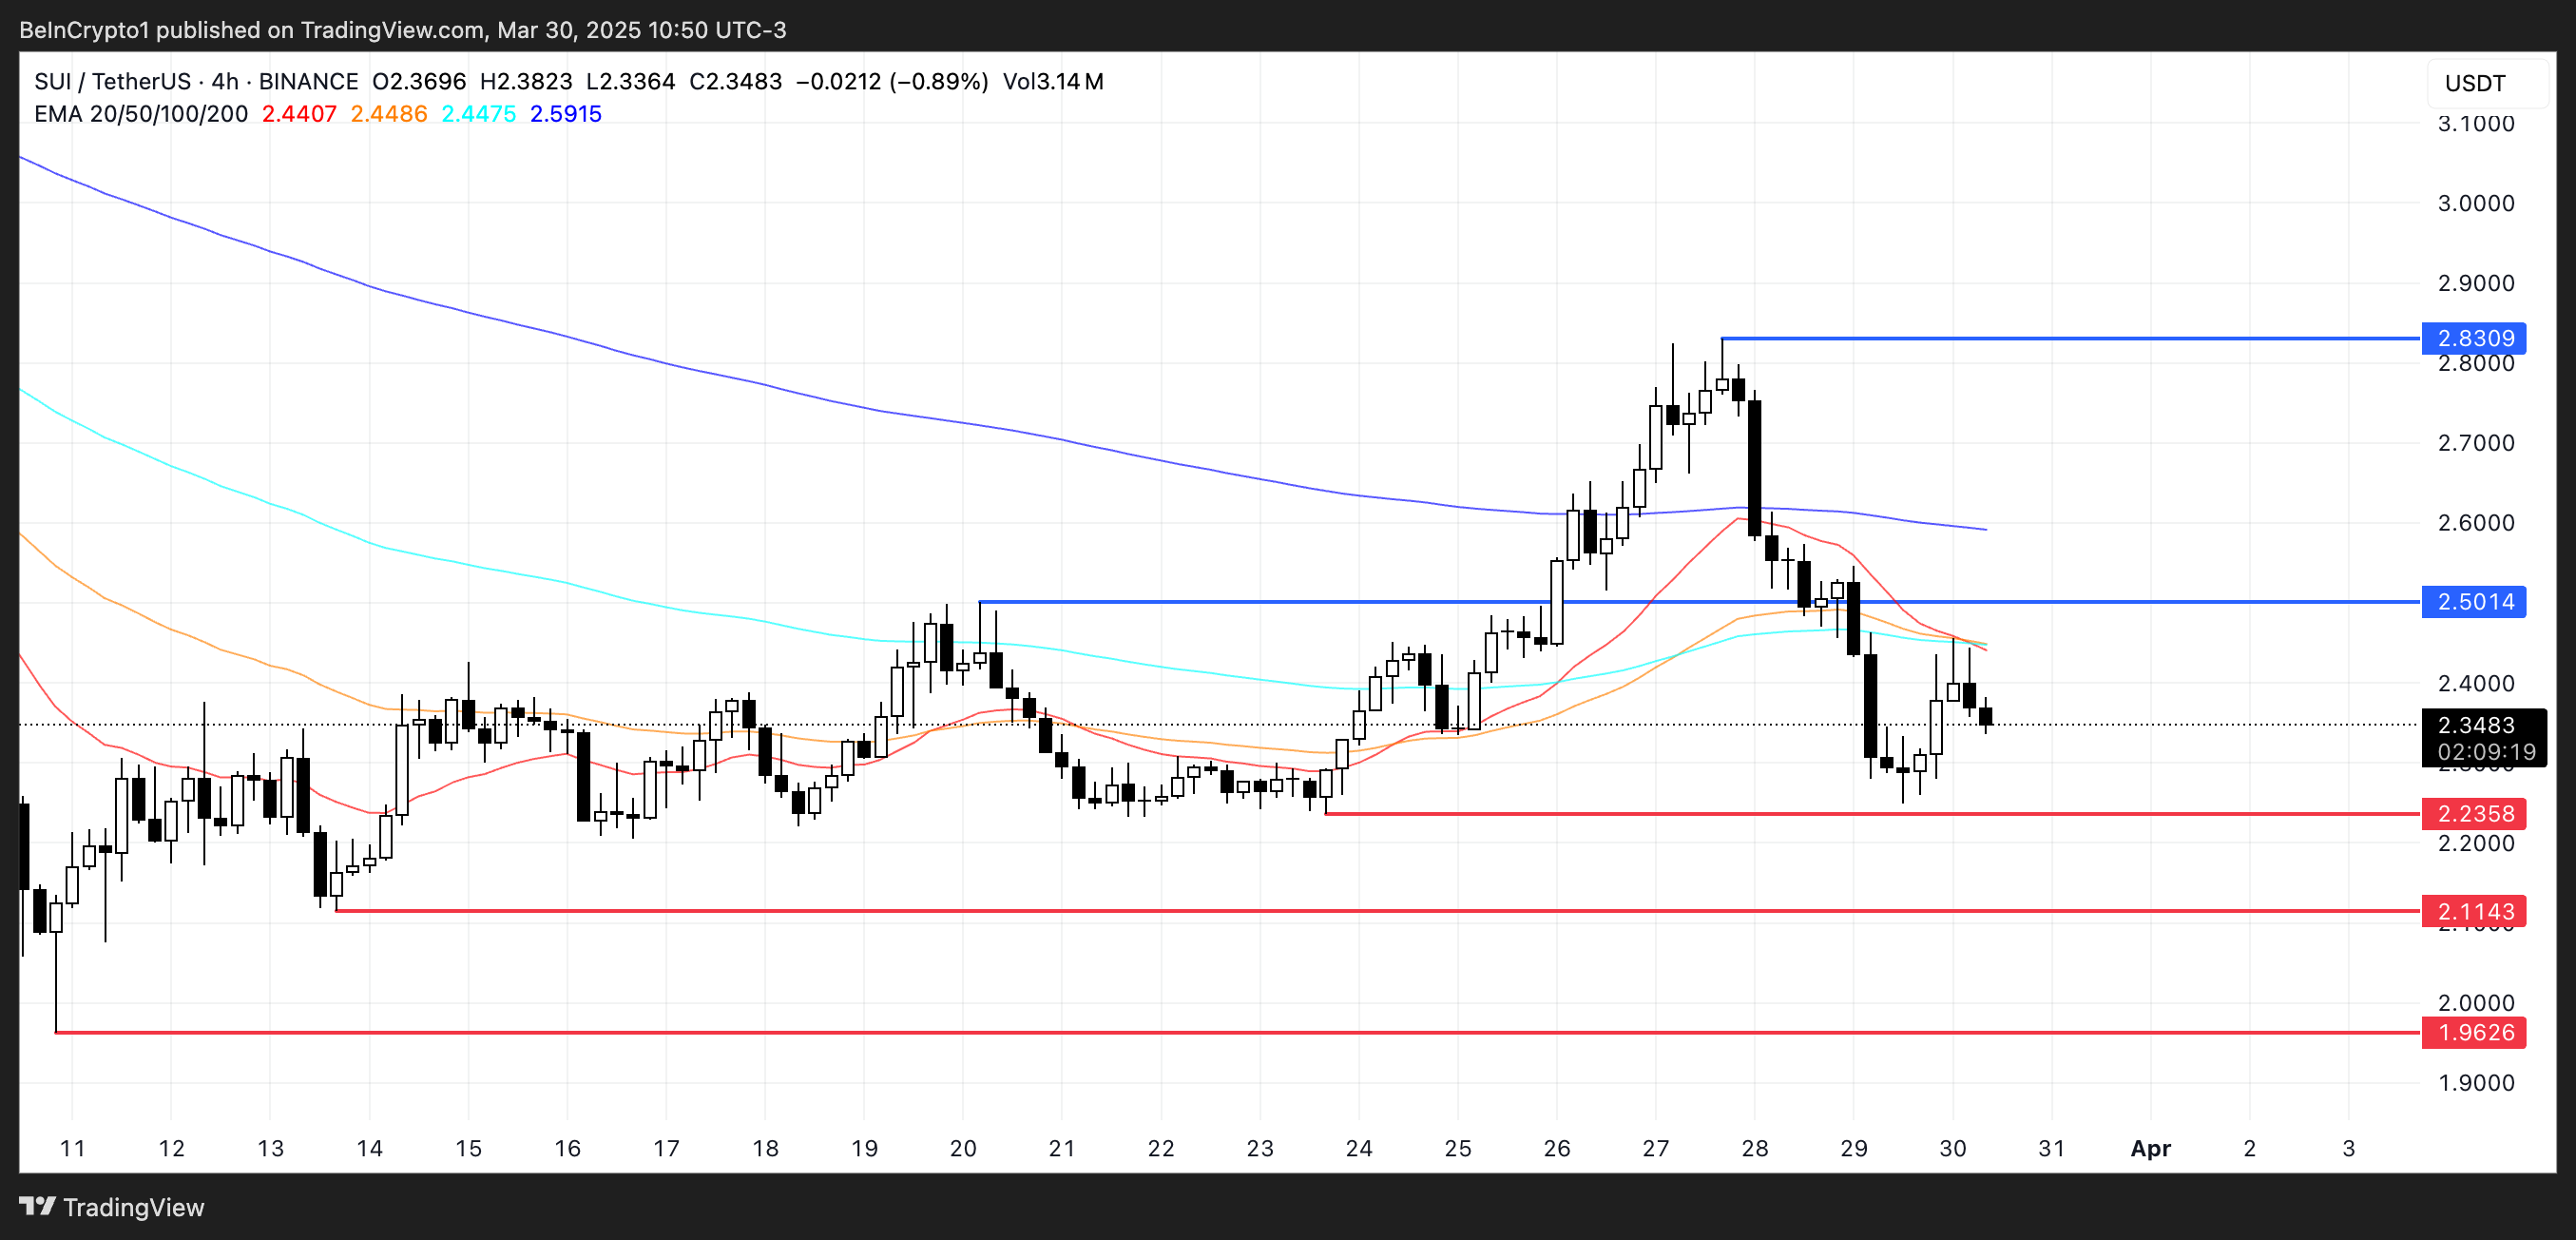
SUI’s EMA lines recently formed a death cross, hinting at a possible downtrend. If confirmed, the price could drop to $2.23, with further downside to $2.11 and $1.96.
If SUI manages to reverse the trend, it could climb toward $2.50. A breakout there would open the door to $2.83, nearly 20% higher from current levels.
Pi Network (PI)
Pi Network (PI) is the biggest loser among Made in USA cryptos this week, with its price down over 23% in the last seven days.
It has been trading below $1 throughout the entire week.

If sentiment shifts, PI could rebound toward resistance at $1.05. A breakout there might lead to a push-up to $1.23.
But if bearish pressure continues, PI could fall to test support at $0.718. A drop below that would send it to $0.62—its lowest level since February 21.
Disclaimer
In line with the Trust Project guidelines, this price analysis article is for informational purposes only and should not be considered financial or investment advice. BeInCrypto is committed to accurate, unbiased reporting, but market conditions are subject to change without notice. Always conduct your own research and consult with a professional before making any financial decisions. Please note that our Terms and Conditions, Privacy Policy, and Disclaimers have been updated.

Bitcoin Bears Tighten Grip—Where’s the Next Support?

Cardano Price Eyes Massive Pump In May Following Cyclical Patern From 2024

Solana (SOL) Price Risks Dip Below $110 as Bears Gain Control

Top 3 Made in USA Coins to Watch This Week

Japan Set To Classify Cryptocurrencies As Financial Products, Here’s All

3 Token Unlocks for April: Parcl, deBridge, Scroll

2.52 Million Altcoins Are Ruining Crypto’s Future

Animoca Brands Valuation Tanks 75% In Two Years, Here’s Why

Crypto exchange BingX hacked for $43 million

Are The Big Players Losing Interest?

Hong Kong’s Securities Association Tips Authorities On Crypto Self-Regulation

Coinbase cbBTC Set to go Live on Solana
2.52 Million Altcoins Are Ruining Crypto’s Future
Animoca Brands Valuation Tanks 75% In Two Years, Here’s Why
Crypto exchange BingX hacked for $43 million
Are The Big Players Losing Interest?
Hong Kong’s Securities Association Tips Authorities On Crypto Self-Regulation
Coinbase cbBTC Set to go Live on Solana
-
 Market17 hours ago
Whale Leverages $27.5 Million PEPE Long on Hyperliquid
-

 Ethereum17 hours ago
Ethereum MVRV Ratio Nears 160-Day MA Crossover – Accumulation Trend Ahead?
-

 Ethereum16 hours ago
Ethereum May Have Hit Cycle Bottom, But Pricing Bands Signal Strong Resistance At $2,300
-

 Market15 hours ago
Bitcoin (BTC) Whales Accumulate as Market Faces Uncertainty
-

 Ethereum15 hours ago
Ethereum Analyst Eyes $1,200-$1,300 Level As Potential Acquisition Zone – Details
-

 Bitcoin15 hours ago
Gold Keeps Outperforming Bitcoin Amid Trump’s Trade War Chaos
-

 Regulation22 hours ago
Kentucky Governor Signs Off On ‘Bitcoin Rights’ Bill, Strengthening Crypto Protections
-
 Altcoin14 hours ago
Analyst Reveals Why The XRP Price Can Hit ATH In The Next 90 To 120 Days