
Ethereum
Ethereum Whales Relentlessly Selling For 6 Months, Data Says

On-chain data shows the Ethereum whales have been participating in constant distribution for the last six months, a sign that’s not ideal for ETH.
Ethereum Accumulation Trend Score Has Been Red For Cohorts As A Whole
As analyst James Van Straten pointed out in a new post on X, the Accumulation Trend Score has been showing a grim picture for Ethereum recently. The “Accumulation Trend Score” here refers to an indicator from Glassnode that tells us whether the investors of a given asset are accumulating or not.
This metric takes into account for not just the net balance changes happening in the wallets of the investors, but also the size of the entities. This means that larger entities have a higher weight in the indicator. When the value of the score is close to 1, it means either the large investors are participating in strong accumulation or a large number of small holders are buying. On the other hand, it being close to 0 implies net distribution is going on in the network or at least, there is a lack of accumulation taking place.
In the context of the current topic, the version of the Accumulation Trend Score that’s of interest is the one for the individual cohorts. Addresses have been divided into these groups based on the balance that they are carrying.
Now, here is a chart that shows the trend in the Ethereum Accumulation Trend Score for the different cohorts over the past year:
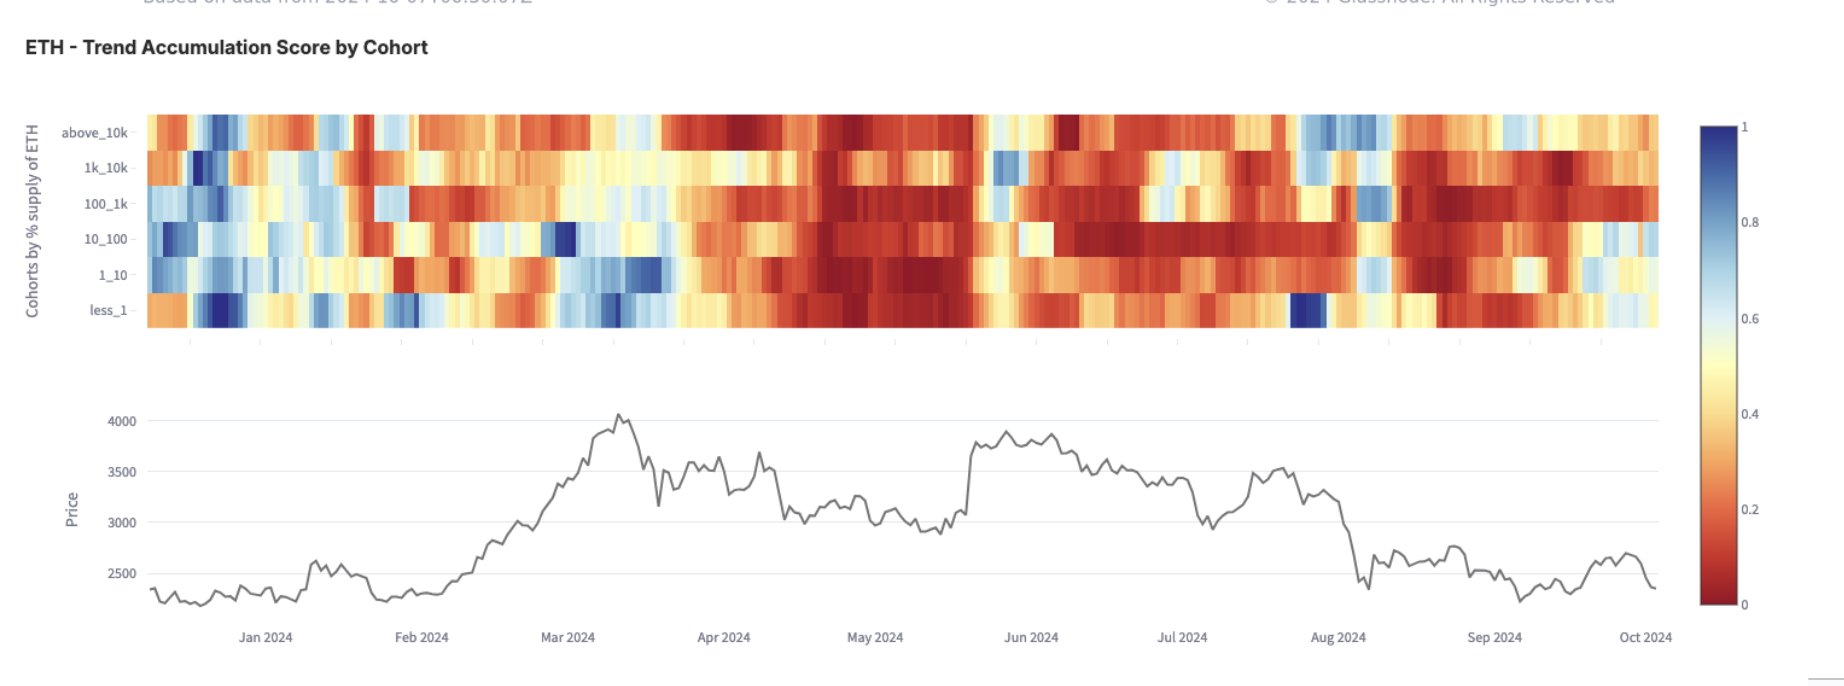
The value of the metric appears to have been red for most of the cohorts recently | Source: @btcjvs on X
As displayed in the above graph, the Ethereum Trend Accumulation Score showed a shade of blue across the cohorts during the early parts of the year, implying the investors as a whole were participating in some degree of accumulation.
Shortly after the Bitcoin all-time high (ATH) back in March, however, the investors started aggressively selling, with the indicator’s value taking a deep red color (that is, very close to the zero mark). Since the initial sharp distribution, selling has calmed down over the last few months, but the metric has still been tending towards being red. Of note, the 100 to 1,000 BTC, the 1,000 to 10,000 BTC, and the 10,000+ BTC groups are still in a phase of distribution.
These cohorts are popularly referred to as, in the same order, sharks, whales, and mega whales. Investors of this size can carry some degree of influence in the market, so their participation in consistent selling over the last six months or so is naturally not a good sign for Ethereum.
It’s possible that until the various cohorts return back to accumulation mode, ETH won’t be able to make any significant recovery.
ETH Price
At the time of writing, Ethereum is floating around $2,400, down more than 7% over the last seven days.
Looks like the price of the coin has been moving sideways over the last few days | Source: ETHUSDT on TradingView
Featured image from Dall-E, Glassnode.com, chart from TradingView.com


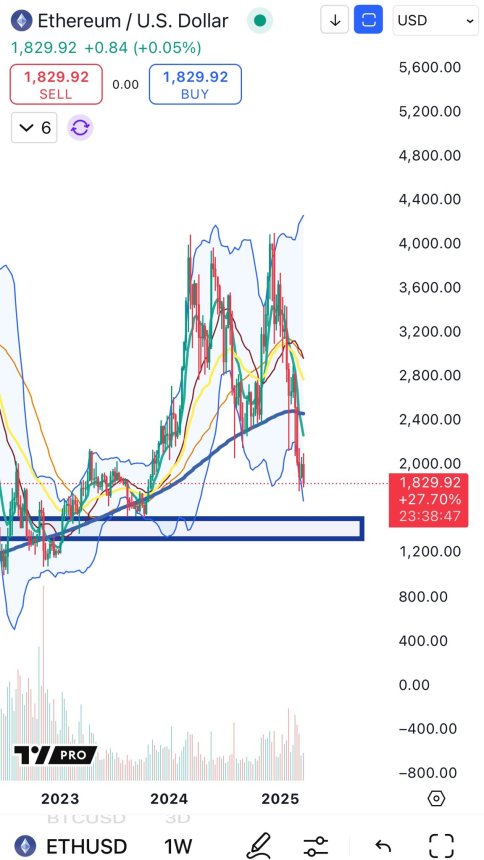
Ethereum is now trading above the $2,000 mark after several days of struggle, marking a potential turning point for the second-largest cryptocurrency by market cap. ETH had plunged over 38% since late February, sparking panic among investors when the price broke below the critical $2,000 level and briefly fell under $1,800. This sharp drop led many to question whether the broader altcoin market was entering a prolonged bear phase.
However, the recent recovery and price stabilization above $2,000 have renewed optimism among Ethereum holders. Many investors believe the worst may be over and that ETH could begin building the foundation for a sustained recovery in the coming months.
Supporting this sentiment, data from Santiment reveals that whales have bought roughly 470,000 ETH over the past week. This notable accumulation from large holders suggests growing confidence in Ethereum’s long-term potential, even amid recent volatility. Historically, whale accumulation has preceded major price rallies, adding to speculation that Ethereum could be gearing up for a significant upward move.
While uncertainty remains, current on-chain signals and market behavior hint that ETH may be preparing for a bullish breakout — if bulls can defend key support levels and reclaim higher ground.
Ethereum Builds Momentum Amid Potential Recovery
Ethereum is showing signs of life after a prolonged period of consolidation and selling pressure. The recent push above the $2,000 mark has given bulls a critical opportunity to reclaim control and ignite a recovery uptrend. However, price action remains uncertain, with the market caught between expectations of a continued downtrend and hopes for a meaningful reversal.
Bulls must now defend the $2,000 support level with strength. This price point has been a major psychological and technical barrier over the past few months, and a solid hold above it could provide the foundation for a broader rally. A failure to maintain this level, however, could invite further downside pressure and signal the continuation of the bearish trend.
Adding to the growing optimism is new on-chain data shared by top analyst Ali Martinez. According to Santiment, Ethereum whales have accumulated roughly 470,000 ETH in the past week. This surge in accumulation from large holders suggests confidence is returning to the market and could indicate that smart money is positioning for a potential move higher.

Historically, heavy whale buying has often preceded major price increases, serving as a leading indicator for broader market sentiment. If bulls continue to step in and Ethereum maintains its footing above $2,000, a recovery toward $2,300 and beyond may soon be on the table.
ETH Price Hovers Above $2,000 As Bulls Try To Find Momentum
Ethereum is trading at $2,090 after a sharp rebound from recent lows, marking its first sustained move above the $2,000 level in weeks. This area has become a critical battleground between bulls and bears, as ETH has struggled below this mark since early March. Now, with price action pushing higher, bulls must defend this support zone to maintain momentum.

To confirm a meaningful recovery, Ethereum must break above the $2,200 resistance—an area aligned with previous consolidation and short-term moving averages. A successful reclaim of this level would likely ignite renewed bullish momentum and open the path toward $2,300 and higher.
However, if bulls fail to hold the $2,000 mark, selling pressure could return quickly. A breakdown below this level would signal weakness and potentially send ETH back toward the $1,800 zone, which served as a recent bottom during the sell-off.
Momentum is slowly shifting, but the next few trading sessions will be crucial. Ethereum needs sustained buying volume and stronger confirmation above $2,200 to establish a true bullish reversal. Until then, the $2,000 line remains the key level to watch as the battle for direction continues.
Featured image from Dall-E, chart from TradingView
Editorial Process for bitcoinist is centered on delivering thoroughly researched, accurate, and unbiased content. We uphold strict sourcing standards, and each page undergoes diligent review by our team of top technology experts and seasoned editors. This process ensures the integrity, relevance, and value of our content for our readers.

Reason to trust
![]()
Strict editorial policy that focuses on accuracy, relevance, and impartiality
Created by industry experts and meticulously reviewed
The highest standards in reporting and publishing
Strict editorial policy that focuses on accuracy, relevance, and impartiality
Morbi pretium leo et nisl aliquam mollis. Quisque arcu lorem, ultricies quis pellentesque nec, ullamcorper eu odio.
Ethereum is facing mounting pressure after weeks of relentless selling and underwhelming price action. Since January, bulls have failed to regain control, and ETH has continued to bleed value in a market increasingly dominated by fear and uncertainty. With no clear signs of a reversal, the coming weeks could bring more pain for investors holding long positions.
Related Reading
Global financial markets remain on edge as trade war fears and geopolitical tensions intensify. This hostile macro environment has driven investors away from high-risk assets like cryptocurrencies, and Ethereum has been one of the hardest hit. The weakness in price reflects not only technical breakdowns but also a broader lack of confidence in short-term recovery.
Top analyst Big Cheds recently shared a technical analysis showing Ethereum is now trading at $1,840 — a staggering drop from its $3,400 level earlier this year. According to Cheds, this confirms the continuation of the current downtrend, with ETH now moving into lower demand zones that could offer limited support.
Unless bulls step in with strength, Ethereum’s outlook remains bearish. The market is watching closely to see if $1,800 can hold — or if deeper losses lie ahead as momentum continues to favor the downside.
Ethereum Under Pressure As Key Levels Collapse
Ethereum is in a critical position as it continues to lose key support levels under mounting selling pressure. After briefly reclaiming the $2,000 mark in recent weeks, ETH has once again fallen below this crucial threshold — a failure that has intensified bearish sentiment and placed bulls in a defensive stance. With each failed recovery attempt, investor confidence weakens, and analysts are now calling for a deeper correction in the coming weeks.
The situation is particularly delicate as Ethereum serves as the backbone for much of the crypto ecosystem. A sustained downtrend in ETH doesn’t just impact its own holders but also influences the broader altcoin market and DeFi sectors that rely on Ethereum’s price strength for momentum. The continued decline has heightened concerns that a prolonged bear phase may be unfolding.
Big Cheds shared a bearish technical outlook, pointing to the severity of ETH’s drop from its $3,400 local high to the current $1,840 level. According to Cheds, if the downtrend continues, the next key accumulation zone to watch could be between $1,200 and $1,300 — a range that previously acted as a strong base during earlier cycles.
If Ethereum falls to that zone, it would represent a correction of over 60% from its recent peak. Such a move would signal a major breakdown in structure and test long-term investor conviction. For now, bulls must fight to hold the $1,800 level and attempt to reclaim lost ground. Without a shift in momentum soon, the road ahead for ETH looks increasingly challenging — and the broader market may follow its lead downward.
Related Reading
Key Resistance Levels Remain Untouched
Ethereum is currently trading at $1,840, continuing to show weakness after failing to reclaim the 4-hour 200 moving average (MA) and exponential moving average (EMA), both sitting near the $2,100 level. These indicators have acted as strong dynamic resistance since December 2024, and ETH has consistently traded below them — a clear sign that bears remain in control of the trend.
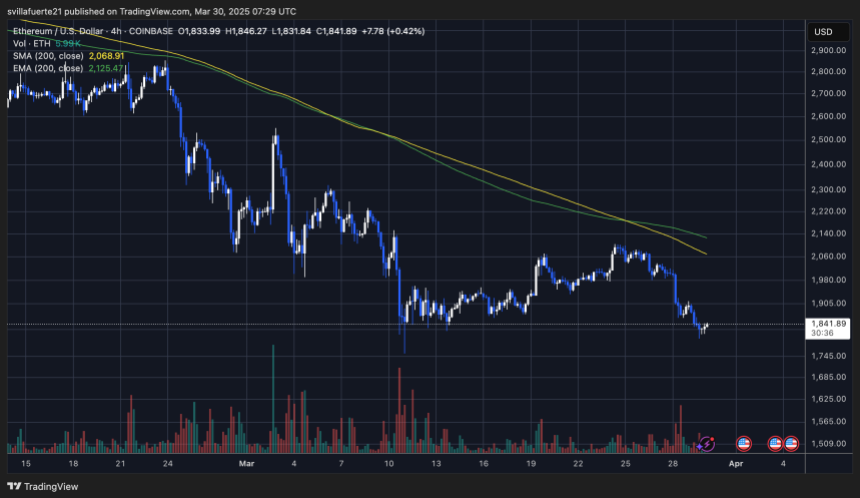
This prolonged weakness below the 200 MA and EMA has reinforced the bearish momentum, with bulls unable to regain any meaningful ground in recent months. Until Ethereum can break back above these key technical levels, any attempt at a sustained recovery is likely to fall short.
A reclaim of the 200 MA and EMA could trigger a significant upside move, as it would signal a shift in short-term market structure and potentially spark renewed buying interest. However, even before that happens, bulls must focus on reclaiming the psychological $2,000 level — a major price zone that has repeatedly defined the battle between buyers and sellers.
Related Reading
If ETH can break above both $2,000 and $2,100 with volume, it may mark the beginning of a stronger recovery phase. Until then, price action remains vulnerable and tilted toward the downside.
Featured image from Dall-E, chart from TradingView

Multiple crypto analysts suggest that Ethereum (ETH) may have already reached the bottom for this market cycle. However, the second-largest digital asset by market cap is expected to encounter significant price resistance in the near term.
Ethereum Has Likely Hit This Cycle’s Bottom
According to an X post by crypto analyst TraderPA, ETH has likely found this market cycle’s bottom. The analyst shared the following chart showing ETH repeatedly bouncing off a five-year-old support level.

The last time ETH touched this support line, it triggered a powerful rally, with its price surging an impressive 340%. A similar move this time could potentially push ETH to a new all-time high (ATH).
Fellow crypto trader Merlijn The Trader proposed that Ethereum might be on the verge of another parabolic run. He pointed out that ETH appears to follow the ‘1, 2, 3 bounce pattern,’ which previously led to a massive 3,600% gain the last time this setup played out.
For the uninitiated, the 1, 2, 3 bounce pattern is a technical analysis setup where the underlying asset’s price bounces off a trendline – point 1 and 2 in the below chart – followed by a range breakout after bouncing off from point 3.

Crypto analyst CryptoBullet provided a medium-term outlook for ETH’s price action. He suggested that ETH may be primed for a “good mid-term bounce.” He added:
This month ETH hit the 300-Week MA. In its history, ETH hit the 300-Week MA only 2 times: in June 2022 (bear market bottom) and this month – March 2025. My target for the bounce is $2900-3200. Once my target is reached, we will re-evaluate.

ETH Faces Strong Resistance At $2,300
In a recent X post, prominent digital assets analyst Ali Martinez noted that while Ethereum has reclaimed its realized price of $2,040, its next major obstacle lies at $2,300, based on pricing bands analysis.

Meanwhile, on-chain data and other indicators suggest a potential price recovery for ETH. Recent data from Santiment shows that ETH whales – wallets holding large amounts of ETH – accumulated more than 420,000 ETH over five days.
Additionally, ETH reserves on cryptocurrency exchanges hit a new all-time low this week, dropping to 18.3 million tokens. Shrinking ETH reserves on trading platforms often fuel a supply scarcity narrative, potentially driving prices higher.
That said, ETH continues to underperform against Bitcoin (BTC), sliding to fresh multi-year lows with no clear signs of recovery. At press time, ETH trades at $2,052, down 0.9% over the past 24 hours.

Featured Image from Unsplash.com, Charts from X and TradingView.com
Editorial Process for bitcoinist is centered on delivering thoroughly researched, accurate, and unbiased content. We uphold strict sourcing standards, and each page undergoes diligent review by our team of top technology experts and seasoned editors. This process ensures the integrity, relevance, and value of our content for our readers.

Cardano Price Eyes Massive Pump In May Following Cyclical Patern From 2024

Solana (SOL) Price Risks Dip Below $110 as Bears Gain Control

Top 3 Made in USA Coins to Watch This Week

Japan Set To Classify Cryptocurrencies As Financial Products, Here’s All

3 Token Unlocks for April: Parcl, deBridge, Scroll

Whales Accumulate 470,000 Ethereum In One Week – Bullish Momentum Ahead?

2.52 Million Altcoins Are Ruining Crypto’s Future

Animoca Brands Valuation Tanks 75% In Two Years, Here’s Why

Crypto exchange BingX hacked for $43 million

Are The Big Players Losing Interest?

Hong Kong’s Securities Association Tips Authorities On Crypto Self-Regulation

Coinbase cbBTC Set to go Live on Solana
2.52 Million Altcoins Are Ruining Crypto’s Future
Animoca Brands Valuation Tanks 75% In Two Years, Here’s Why
Crypto exchange BingX hacked for $43 million
Are The Big Players Losing Interest?
Hong Kong’s Securities Association Tips Authorities On Crypto Self-Regulation
Coinbase cbBTC Set to go Live on Solana
-

 Altcoin22 hours ago
Gemini Crypto Exchange Announces Rewards For XRP Users, Here’s How To Get In
-
 Ethereum11 hours ago
Whales Accumulate 470,000 Ethereum In One Week – Bullish Momentum Ahead?
-

 Market18 hours ago
Crypto Derivatives Get a Boost from US CFTC
-

 Market17 hours ago
Can Ethereum’s Utility Make a Comeback Against Bitcoin?
-

 Ethereum16 hours ago
Ethereum Playing Catch-Up? Bloomberg Examines ETH’s Struggles In New Report
-
 Market15 hours ago
Whale Leverages $27.5 Million PEPE Long on Hyperliquid
-

 Ethereum15 hours ago
Ethereum MVRV Ratio Nears 160-Day MA Crossover – Accumulation Trend Ahead?
-

 Ethereum14 hours ago
Ethereum May Have Hit Cycle Bottom, But Pricing Bands Signal Strong Resistance At $2,300